

Abstract
In both the suprachiasmatic nucleus and peripheral tissues, the circadian oscillator drives rhythmic transcription of downstream target genes. Recently, a number of studies have used DNA microarrays to systematically identify oscillating transcripts in plants, fruit flies, rats and mice. These studies have identified several dozen to many hundred rhythmically expressed genes by sampling tissues every four hours for one, two, or more days. To extend this work, we have performed DNA microarray analysis on RNA derived from the mouse pituitary sampled every hour for two days. COSOPT and Fisher's G-test were employed at a false-discovery rate less than 5% to identify more than 250 genes in the pituitary that oscillate with a 24-hour period length. We found that increasing the frequency of sampling across the circadian day dramatically increased the statistical power of both COSOPT and Fisher's G-test, resulting in considerably more high-confidence identifications of rhythmic transcripts than previously described. Finally, to extend the utility of these data sets, a web-based resource has been constructed at http://wasabi.itmat.upenn.edu/circa/mouse that is freely available to the research community.
Introduction
The central circadian oscillator in mammals is located in a small cluster of neurons in the hypothalamus called the suprachiasmatic nucleus (SCN) (Stratmann and Schibler, 2006). These neurons have an endogenous circadian clock that oscillates with a period of approximately 24 hours (Ko and Takahashi, 2006). In addition, these neurons receive information from retinal ganglion cells, permitting them to entrain the clock to environmental light cues (Cermakian and Sassone-Corsi, 2002). Peripheral tissues have endogenous circadian clocks as well and may be entrained by a number of different stimuli (reviewed in Stratmann and Schibler, 2006). However, these peripheral oscillators are subordinate to the central circadian clock in the SCN, which is responsible for integrating environmental input and orchestrating the biological rhythms of the entire organism (Schibler and Sassone-Corsi, 2002).
Consequently, many complex physiologies in an organism show regular oscillations during the course of a single day. For example, rhythms of sleep and arousal are controlled by the circadian clock, as well as rhythms in food consumption, blood pressure, body temperature and metabolism (reviewed in Curtis and Fitzgerald, 2006; Hastings et al., 2003). These rhythms have direct and indirect implications for human heath. The metabolism and efficacy of drugs depends considerably on the time of day they are administered (Antoch et al., 2005; Halberg et al., 2006; Lis et al., 2003). Moreover, disruptions of the circadian clock have been shown to increase susceptibility to cancer, heart disease, and metabolic disorders while directly causing serious sleep disorders and influencing mental illness (Curtis and Fitzgerald, 2006; Halberg et al., 2006; Klerman, 2005; Levi and Schibler, 2007).
Despite considerable effort, the link between the molecular oscillations of the core circadian clock and rhythms of organismal physiology remains poorly understood (Hastings et al., 2003). As a first step towards bridging this gap, many groups, including ours, have used DNA microarrays to systematically identify genes which oscillate during the course of a signal day (for examples of this work see Akhtar et al., 2002; Ceriani et al., 2002; Claridge-Chang et al., 2001; Duffield et al., 2002; Harmer et al., 2000; Kornmann et al., 2007; Lin et al., 2002; McDonald and Rosbash, 2001; Panda et al., 2002; Storch et al., 2002; Ueda et al., 2002). Typically, these studies have analyzed RNA samples isolated every four hours over the course of two or more days and used curve-fitting algorithms, Fourier analysis, or autocorrelation tests to identify rhythmic transcripts (Table 1). Using these methodologies, several hundred genes have been identified as circadianly regulated in mouse tissues and rat fibroblasts, as well as in plants (Arabidopsis) and fruit flies (Drosophila) (Table 1). These data and analyses represented an important first step in elucidating the link between molecular oscillations of the core circadian clock and downstream physiology.
Table 1. Previous circadian microarray studies have predominately used four-hour time resolution.
| Study | Year | Tissue | Time Resolution |
|---|---|---|---|
| Harmer et al. | 2000 | Arabidopsis | 4-hour |
| Claridge-Change et al. | 2001 | Fly heads | 4-hour |
| McDonald and Rosbash | 2001 | Fly heads | 4-hour |
| Ceriani et al. | 2002 | Fly heads and bodies | 4-hour |
| Lin et al. | 2002 | Fly heads | 4-hour |
| Akhtar et al. | 2002 | mouse liver | 4-hour |
| Storch et al. | 2002 | mouse liver and heart | 4-hour |
| Panda et al. | 2002 | mouse SCN and liver | 4-hour |
| Ueda et al. | 2002 | mouse SCN and liver | 4-hour |
| Duffield et al. | 2002 | rat-1 fibroblasts | 4-hour |
| Kornmann et al. | 2007 | mouse liver | 4-hour |
However, several controversies emerged as a consequence of this work (Duffield, 2003; Etter and Ramaswami, 2002; Hayes et al., 2005). For example, most transcriptional profiling studies were able to identify many of the core components of the circadian clock, although a number of bona fide oscillating genes and clock components were missed by these studies (Ceriani et al., 2002; Harmer et al., 2000; Panda et al., 2002). This suggests that the conventional design of these experiments may have been insufficiently powerful to identify every significant circadian gene. Similarly, there was surprisingly small overlap between the rhythmically expressed genes identified in different studies (Etter and Ramaswami, 2002). In part, this discrepancy can be explained by the use of different experimental designs, strains of organisms, array platforms, condensation algorithms, and finally the analytic methods used to detect cycling genes (Walker and Hogenesch, 2005). These examples illustrate the high false-positive and high false-negative rates in these original studies, and taken as a whole, suggest that additional work is necessary to precisely define the subset of the transcriptome regulated by the circadian clock.
Transcriptional profiling at high temporal resolution
To address this issue, a second-generation microarray analysis was performed to identify genes whose transcripts are under circadian regulation. Wild type mice were entrained to a 12 hours light, 12 hours dark (12:12 L:D) schedule prior to release into constant darkness conditions. Tissue samples from pituitary of 3-5 mice were collected every hour for two full days and RNA samples were analyzed using Affymetrix microarrays. To identify rhythmically expressed genes, these data were subsequently analyzed using COSOPT, a method that relies on curve fitting and permutation analysis, and Fisher's G-test, based on the Fourier transform. Following the initial analyses, the false discovery rate (FDR) was calculated for all transcripts using both methods in R, a high-level programming language used for statistical computing.
Using this analysis, we found considerable evidence for robust circadian rhythms (Figure 1). These included confidently detecting the circadian oscillations of known core clock transcripts. For example, two components of the core oscillator, Bmal1 and Clock (Ko and Takahashi, 2006), as well as many other components of the circadian clock, including Rev-erbα, Rorα, Per2, Cry1, and Cry2 were among the genes with the lowest p-values by both statistical tests (Figure 1 and data not shown). Importantly, the phase-relationship between these components in both the liver and pituitary was in excellent agreement with previous expectations and resolved to a preciseness that was not possible in previous studies.
Figure 1. Cycling transcripts detected by microarray analysis in the liver and pituitary.

Tissue samples from the pituitary (A-B) and liver (C-D) were collected from wildtype mice every hour for two days. RNA was purified from these samples and profiled on Affymetrix microarrays. Bmal1 (A, C) and Per2 (B, D) show robust circadian oscillations through the entire time course.
Prompted by earlier work on meta-analysis of circadian gene expression data from DNA arrays, we sought to identify a cohort of oscillating transcripts using two distinct statistical methods, COSOPT and Fisher's G-test. Each identified several hundred rhythmic transcripts in pituitary samples at highly restrictive false-discovery rates (Table 2). Importantly, there was considerable overlap between the transcripts identified by both tests, increasing the confidence that these genes are bona fide outputs of the circadian clock. All told, 274 transcripts were identified as rhythmically expressed by both COSOPT and Fisher's G-test at a false-discovery rate (FDR) of 5%; when the FDR is reduced to 1%, 120 genes were found to be rhythmic by both algorithms (Table 2). As expected, the vast majority of these genes show period lengths of approximately 24-hours (Figure 2). Taken as a whole, this data suggest that over 100 genes in the mouse pituitary oscillate in a circadian manner. Interestingly, the phases of these circadian genes show an approximately even distribution throughout a single day (Figure 3), indicating that the output of the clock is operating nearly equally at every hour in these tissues.
Table 2. Cycling transcripts identified at different false-discovery rates (FDR).
| Pituitary: | |||
|---|---|---|---|
| FDR | COSOPT | Fisher.G | Both |
| < 0.05 | 334 | 1152 | 274 |
| < 0.01 | 131 | 316 | 120 |
Figure 2. COSOPT and Fisher's G-test predominantly detect rhythmic transcripts with periods of approximately 24-hours.

In the pituitary (B) several hundred rhythmic transcripts were detected at a false-discovery rate of < 0.05.
Figure 3. The phases of circadian transcripts span the entire circadian day.
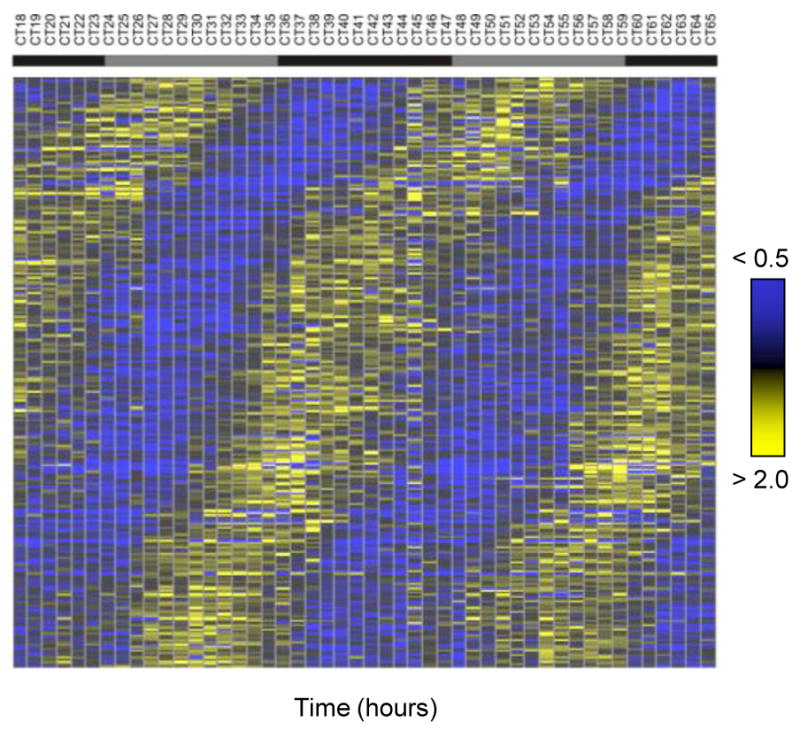
Rhythmic transcripts detected by COSOPT and Fisher.g at a false-discovery rate of < 0.05 were plotted on heat maps. Bright blue represents a two-fold down-regulation of a transcript relative to its median level; bright yellow represents a two-fold up-regulation.
Statistical analysis
The design of the original studies by our group and others was somewhat arbitrarily derived from Northern and Western blot analyses studies predominantly aimed at the study of one or a few genes. The inherent weakness in this approach for DNA array analysis is the multiple testing problem--instead of one or a few genes being analyzed, tens of thousands were, which greatly amplified the likelihood of both false positives and false negative identifications (type I and type II errors). The availability of the high resolution time course experiment enabled empirical statistical analyses to determine the optimal time frequency of sampling. By analyzing expression data from 48 time points across two complete days, the present study successfully identified several hundred rhythmically expressed genes in the mouse pituitary (Table 2). These data indicate that the power of statistical tests to determine rhythmicity is dramatically improved through modest increases in sampling frequency. One of the key questions was, how many time points in a 48 hour time course were necessary to robustly detect circadian transcription. In an era of tight research funding and relatively expensive DNA arrays, the best balance between sensitivity, selectivity, and cost would provide a tremendous benefit in the detection of cycling genes.
To evaluate this issue, we performed a number of simulations to assess the success of COSOPT and Fisher's G-test in identifying rhythmic transcripts at different sampling densities. To this end, we randomly selected time points from our dataset at one, two, three, and four hour intervals, and employed COSOPT and Fisher's G-test to identify oscillating genes. We discovered that there is a considerable statistical advantage in increasing the frequency of sampling (Figure 4). At a wide range of FDR (0.01 to 0.4), both COSOPT and Fisher's G-test show approximately logarithmic improvements in detecting rhythmic transcripts as sampling density increases (Figure 4). At low sampling resolutions (less than or equal to every three hours) Fisher's G-test performs considerable better than COSOPT, particularly at relatively high FDR (compare Figure 4A and B). Interestingly, both algorithms perform similar efficacies at high sampling resolutions, which is consistent with our expectation that sufficiently high-quality datasets render their downstream analysis insensitive to the particular algorithm used. These data indicate that the detection of circadianly regulated transcripts using conventional algorithms necessitates a sampling density of at least once every two hours over two full days and best balances cost and data quality.
Figure 4. Increasing the frequency of sampling improves the performance of Fisher's G-test and COSOPT algorithms.

Using the high-resolution circadian time course, simulations were performed to determine how many cycling transcripts could be detected at any given false-discovery rate (FDR). Both Fisher's G-test (A) and COSOPT (B) showed significant improvements in the number of cycling transcripts detected as the frequency of sampling is increased from four to one hour.
Bioinformatics resources
Several software resources were developed in the course this work and are publicly available to facilitate circadian gene expression analysis. COSOPT requires an input data step that is transcript centric, meaning that the number of input files rises linearly with the number of genes being analyzed. To streamline this process, we developed a Perl script that automatically converts microarray data (in *.txt or *.cvs format) into the files necessary for COSOPT. In addition, we have written an R script that utilizes the GeneTS package, calculates the average periodogram of the data, and finds period length of transcription.
The identification of novel circadian genes in the pituitary will enable further studies on the molecular mechanism of peripheral oscillators as well as additional work on the output of the circadian clock. To facilitate the distribution of this dataset, we have created a web-based interface available at http://wasabi.itmat.upenn.edu/circa/mouse (Figure 5). This interface, affectionately known as ‘Wasabi’, is written in Ruby on Rails, implemented on a Linux server, and permits the user to search for the transcriptional profile of any gene in either the liver or pituitary (Figure 5A). At the same time, q-values (representing the false-discovery rate) and p-values (representing the probability that a transcript was identified as rhythmic by chance alone) from COSOPT and Fisher's G-test as well as phase and period length can be use to filter queries (Figure 5A).
Figure 5. ‘Wasabi’ is a web-based resource available to the circadian community.
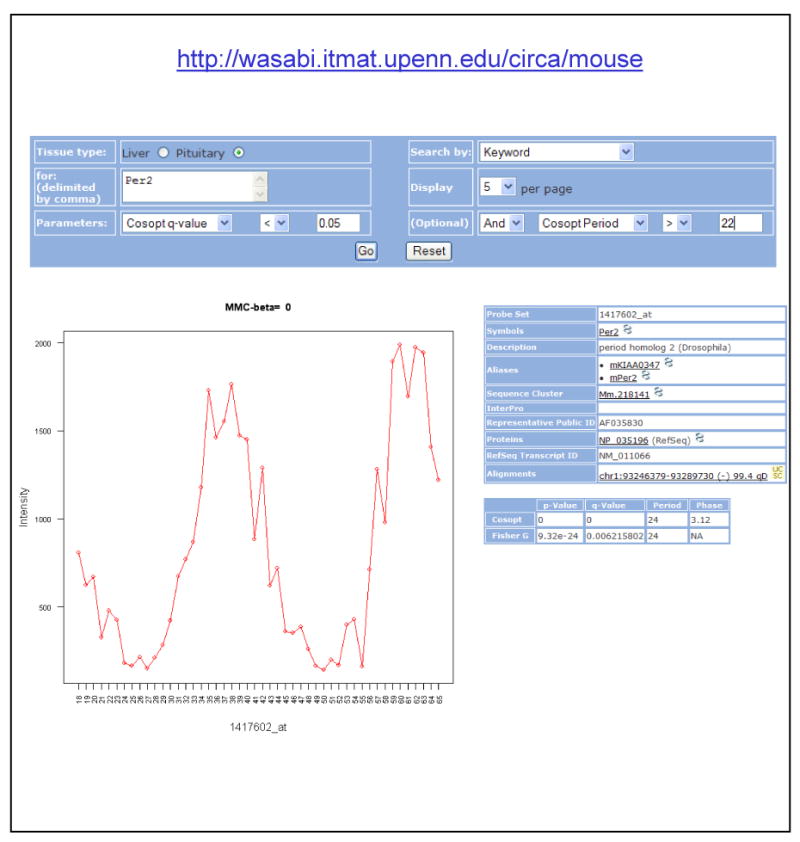
The high-resolution microarray dataset is available to the public at http://wasabi.itmat.upenn.edu/circa/mouse. This interface permits the user to search for any transcript or probe set using filters based on p- and q-values as well as period and phase (A). Data is displayed as a plot of intensity versus time (B) and information on the gene as well as COSOPT and Fisher's G-test statistics is supplied (C).
Figure 5 shows an example of a query submitted to Wasabi. The user is searching for the transcriptional profile of Per2 in the pituitary, filtered by COSOPT q-value (< 0.05) and period length (>22 hours). The resulting profile is shown in Figure 5B; Per2's transcriptional profile is plotted as intensity (expression level) versus time. Additionally, information on the statistical analysis of this transcript as well as external Web links to information on Per2 and its genomic locus are available within this interface (Figure 5C). By streamlining the storage and retrieval of gene expression data, we anticipate Wasabi will become an important resource for the circadian community, analogous to SymAtlas, a web-based resource describing the tissue-specific expression of most mammalian genes (Su et al., 2004).
Analysis of cycling transcripts
As previously discussed, there is a considerable gap in our understanding between the molecular mechanisms of the circadian clock and its role in regulating rhythmic physiologies (Duffield, 2003; Etter and Ramaswami, 2002; Hastings et al., 2003). High throughput gene expression analysis enabled by DNA arrays and informatics tools can help to bridge this gap. In its simplest form, this analysis can consist of identifying a rate limiting enzyme in a biochemical pathway as a target of the clock, inferring that the pathway is clock regulated, and testing the hypothesis. Even more power can be generated by analyzing groups, rather than single, transcripts for their coherent action in cellular pathways. For example, we can use informatics technologies to infer the physiological function of subsets of rhythmically expressed genes. We have used Ingenuity Pathway Analysis (IPA) to identify networks of interrelated circadian genes in the pituitary (Figure 6). As expected, the highest confidence network identified (14 genes, p < 10-8) focused on the canonical circadian clock (Figure 6A). In this network, BMAL1 / ARNTL and Clock form a pair of central nodes which link together familiar components of the clock, including Per, Cry and Rev-erb genes. The similarity of this network to conventional models of clock mechanics suggests that IPA is a useful tool for identifying functionally related genes.
Figure 6. Network analysis of circadian transcripts suggests a putative role in cell-cycle regulation.
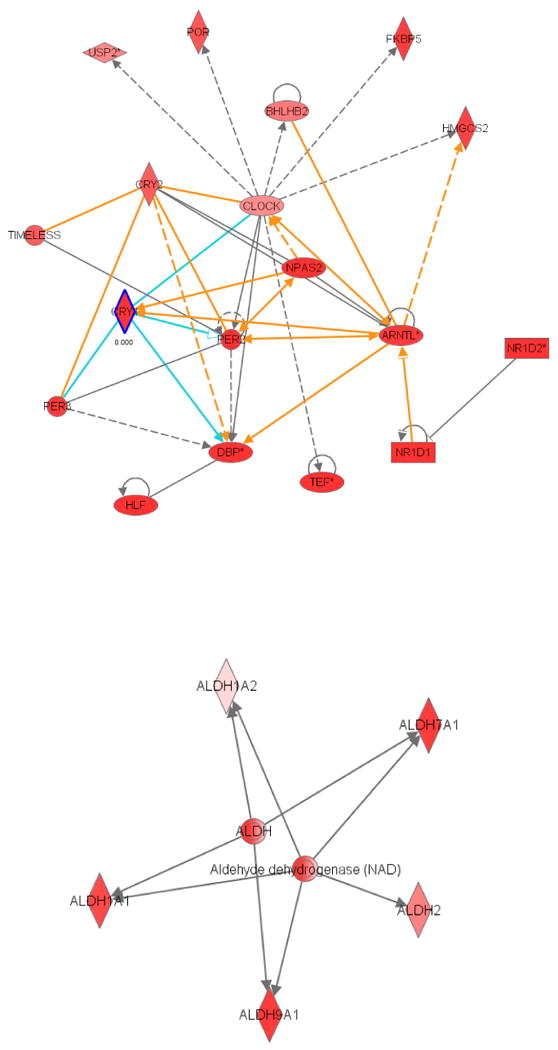
Ingenuity Pathway Analysis (IPA) was used to identify genetic and biochemical interactions between cycling transcripts in the pituitary. Genes involved in aldehyde metabolism cell-cycle regulation were among the most highly represented group identified by IPA. Labeled polygons represent gene products, lines represent functional interactions.
Interestingly, another significant network identified by IPA (p < 10-4) seems to pivot around genes involved in aldehyde metabolism (Figure 6B). Of the 17 aldehyde dehydrogenase genes in mice, five show significant rhythmicity in the pituitary (Figure 6B). Previous work has established the role of the hypothalamic-pituitary-adrenal axis in modulating alcohol sensitivity (Gianoulakis, 1998). Moreover, considerable efforts have been made to document circadian variation in the organismal response to alcohol (Wasielewski and Holloway, 2001). However, to the best of our knowledge, no study has addressed the role of ALDH genes in the pituitary let alone their role in modulating circadian rhythms of alcohol metabolism. Moreover, several member of the ALDH family have been shown to play important roles in the metabolism of GABA (Vasiliou et al., 2004), an inhibitory neurotransmitter known play a role in susceptibility to alcoholism (Morrow et al., 2006). Based on the Ingenuity's network analysis, we suggest that the circadian regulation of ALDH genes in the pituitary may be an important component of the organismal response to alcohol. Thus, the combined use of both informatics tools and the Wasabi database may prove to be a valuable strategy for generating testable hypotheses in subsequent studies of circadian clock output and its relation to clock regulated physiology.
Conclusions
Recently, more than 70 studies have used microarray analysis to identify genes whose transcription is under circadian control. To extend on this work, we have analyzed RNA samples isolated from the pituitary of wild type mice every hour over the course of two complete days. By increasing the frequency of sampling to once every hour, more than 250 genes in the pituitary were identified as circadianly regulated. Simulations based on this dataset indicate that the power of conventional algorithms for detecting rhythmic transcripts is dramatically improved by increasing the sampling density of transcriptional profiling studies. Consequently, we recommend that future studies sample tissues at least once every two hours for 48 hours as the best balance in managing costs and robustly identifying circadian genes. Software tools to analyze circadian data sets and the results of this transcriptional profiling study have been made available to the circadian community in fully searchable web resource, Wasabi.
Acknowledgments
We would like to thank members of the Hogenesch and Panda laboratories for helpful comments through the execution of these experiments and the preparation of the manuscript. The microarray facilities at Scripps Research Institute and the University of Pennsylvania were indispensable for the collection and analysis of these data. J.B.H. is supported by the National Institute of Neurological Disease and Stroke (1R01NS054794), and the National Institute of Mental Health (P50 MH074924-01, awarded to Joseph S. Takahashi, Northwestern University).
References
- Akhtar RA, Reddy AB, Maywood ES, Clayton JD, King VM, Smith AG, Gant TW, Hastings MH, Kyriacou CP. Circadian cycling of the mouse liver transcriptome, as revealed by cDNA microarray, is driven by the suprachiasmatic nucleus. Curr Biol. 2002;12:540–550. doi: 10.1016/s0960-9822(02)00759-5. [DOI] [PubMed] [Google Scholar]
- Antoch MP, Kondratov RV, Takahashi JS. Circadian clock genes as modulators of sensitivity to genotoxic stress. Cell cycle (Georgetown, Tex. 2005;4:901–907. doi: 10.4161/cc.4.7.1792. [DOI] [PMC free article] [PubMed] [Google Scholar]
- Ceriani MF, Hogenesch JB, Yanovsky M, Panda S, Straume M, Kay SA. Genome-wide expression analysis in Drosophila reveals genes controlling circadian behavior. J Neurosci. 2002;22:9305–9319. doi: 10.1523/JNEUROSCI.22-21-09305.2002. [DOI] [PMC free article] [PubMed] [Google Scholar]
- Cermakian N, Sassone-Corsi P. Environmental stimulus perception and control of circadian clocks. Current opinion in neurobiology. 2002;12:359–365. doi: 10.1016/s0959-4388(02)00347-1. [DOI] [PubMed] [Google Scholar]
- Claridge-Chang A, Wijnen H, Naef F, Boothroyd C, Rajewsky N, Young MW. Circadian regulation of gene expression systems in the Drosophila head. Neuron. 2001;32:657–671. doi: 10.1016/s0896-6273(01)00515-3. [DOI] [PubMed] [Google Scholar]
- Curtis AM, Fitzgerald GA. Central and peripheral clocks in cardiovascular and metabolic function. Annals of medicine. 2006;38:552–559. doi: 10.1080/07853890600995010. [DOI] [PubMed] [Google Scholar]
- Duffield GE. DNA microarray analyses of circadian timing: the genomic basis of biological time. Journal of neuroendocrinology. 2003;15:991–1002. doi: 10.1046/j.1365-2826.2003.01082.x. [DOI] [PubMed] [Google Scholar]
- Duffield GE, Best JD, Meurers BH, Bittner A, Loros JJ, Dunlap JC. Circadian programs of transcriptional activation, signaling, and protein turnover revealed by microarray analysis of mammalian cells. Curr Biol. 2002;12:551–557. doi: 10.1016/s0960-9822(02)00765-0. [DOI] [PubMed] [Google Scholar]
- Etter PD, Ramaswami M. The ups and downs of daily life: profiling circadian gene expression in Drosophila. Bioessays. 2002;24:494–498. doi: 10.1002/bies.10109. [DOI] [PubMed] [Google Scholar]
- Gianoulakis C. Alcohol-seeking behavior: the roles of the hypothalamic-pituitary-adrenal axis and the endogenous opioid system. Alcohol health and research world. 1998;22:202–210. [PMC free article] [PubMed] [Google Scholar]
- Halberg F, Cornelissen G, Ulmer W, Blank M, Hrushesky W, Wood P, Singh RK, Wang Z. Cancer chronomics III. Chronomics for cancer, aging, melatonin and experimental therapeutics researchers. Journal of experimental therapeutics & oncology. 2006;6:73–84. [PMC free article] [PubMed] [Google Scholar]
- Harmer SL, Hogenesch JB, Straume M, Chang HS, Han B, Zhu T, Wang X, Kreps JA, Kay SA. Orchestrated transcription of key pathways in Arabidopsis by the circadian clock. Science (New York, NY. 2000;290:2110–2113. doi: 10.1126/science.290.5499.2110. [DOI] [PubMed] [Google Scholar]
- Hastings MH, Reddy AB, Maywood ES. A clockwork web: circadian timing in brain and periphery, in health and disease. Nature reviews. 2003;4:649–661. doi: 10.1038/nrn1177. [DOI] [PubMed] [Google Scholar]
- Hayes KR, Baggs JE, Hogenesch JB. Circadian clocks are seeing the systems biology light. Genome biology. 2005;6:219. doi: 10.1186/gb-2005-6-5-219. [DOI] [PMC free article] [PubMed] [Google Scholar]
- Klerman EB. Clinical aspects of human circadian rhythms. Journal of biological rhythms. 2005;20:375–386. doi: 10.1177/0748730405278353. [DOI] [PubMed] [Google Scholar]
- Ko CH, Takahashi JS. Molecular components of the mammalian circadian clock. Human molecular genetics. 2006;15 Spec No 2:R271–277. doi: 10.1093/hmg/ddl207. [DOI] [PubMed] [Google Scholar]
- Kornmann B, Schaad O, Bujard H, Takahashi JS, Schibler U. System-driven and oscillator-dependent circadian transcription in mice with a conditionally active liver clock. PLoS biology. 2007;5:e34. doi: 10.1371/journal.pbio.0050034. [DOI] [PMC free article] [PubMed] [Google Scholar]
- Levi F, Schibler U. Circadian rhythms: mechanisms and therapeutic implications. Annual review of pharmacology and toxicology. 2007;47:593–628. doi: 10.1146/annurev.pharmtox.47.120505.105208. [DOI] [PubMed] [Google Scholar]
- Lin Y, Han M, Shimada B, Wang L, Gibler TM, Amarakone A, Awad TA, Stormo GD, Van Gelder RN, Taghert PH. Influence of the period-dependent circadian clock on diurnal, circadian, and aperiodic gene expression in Drosophila melanogaster. Proceedings of the National Academy of Sciences of the United States of America. 2002;99:9562–9567. doi: 10.1073/pnas.132269699. [DOI] [PMC free article] [PubMed] [Google Scholar]
- Lis CG, Grutsch JF, Wood P, You M, Rich I, Hrushesky WJ. Circadian timing in cancer treatment: the biological foundation for an integrative approach. Integrative cancer therapies. 2003;2:105–111. doi: 10.1177/1534735403002002002. [DOI] [PubMed] [Google Scholar]
- McDonald MJ, Rosbash M. Microarray analysis and organization of circadian gene expression in Drosophila. Cell. 2001;107:567–578. doi: 10.1016/s0092-8674(01)00545-1. [DOI] [PubMed] [Google Scholar]
- Morrow AL, Porcu P, Boyd KN, Grant KA. Hypothalamic-pituitary-adrenal axis modulation of GABAergic neuroactive steroids influences ethanol sensitivity and drinking behavior. Dialogues in clinical neuroscience. 2006;8:463–477. doi: 10.31887/DCNS.2006.8.4/amorrow. [DOI] [PMC free article] [PubMed] [Google Scholar]
- Panda S, Antoch MP, Miller BH, Su AI, Schook AB, Straume M, Schultz PG, Kay SA, Takahashi JS, Hogenesch JB. Coordinated transcription of key pathways in the mouse by the circadian clock. Cell. 2002;109:307–320. doi: 10.1016/s0092-8674(02)00722-5. [DOI] [PubMed] [Google Scholar]
- Schibler U, Sassone-Corsi P. A web of circadian pacemakers. Cell. 2002;111:919–922. doi: 10.1016/s0092-8674(02)01225-4. [DOI] [PubMed] [Google Scholar]
- Storch KF, Lipan O, Leykin I, Viswanathan N, Davis FC, Wong WH, Weitz CJ. Extensive and divergent circadian gene expression in liver and heart. Nature. 2002;417:78–83. doi: 10.1038/nature744. [DOI] [PubMed] [Google Scholar]
- Stratmann M, Schibler U. Properties, entrainment, and physiological functions of mammalian peripheral oscillators. Journal of biological rhythms. 2006;21:494–506. doi: 10.1177/0748730406293889. [DOI] [PubMed] [Google Scholar]
- Su AI, Wiltshire T, Batalov S, Lapp H, Ching KA, Block D, Zhang J, Soden R, Hayakawa M, Kreiman G, et al. A gene atlas of the mouse and human protein-encoding transcriptomes. Proceedings of the National Academy of Sciences of the United States of America. 2004;101:6062–6067. doi: 10.1073/pnas.0400782101. [DOI] [PMC free article] [PubMed] [Google Scholar]
- Ueda HR, Matsumoto A, Kawamura M, Iino M, Tanimura T, Hashimoto S. Genome-wide transcriptional orchestration of circadian rhythms in Drosophila. The Journal of biological chemistry. 2002;277:14048–14052. doi: 10.1074/jbc.C100765200. [DOI] [PubMed] [Google Scholar]
- Vasiliou V, Pappa A, Estey T. Role of human aldehyde dehydrogenases in endobiotic and xenobiotic metabolism. Drug metabolism reviews. 2004;36:279–299. doi: 10.1081/dmr-120034001. [DOI] [PubMed] [Google Scholar]
- Walker JR, Hogenesch JB. RNA profiling in circadian biology. Methods in enzymology. 2005;393:366–376. doi: 10.1016/S0076-6879(05)93016-4. [DOI] [PubMed] [Google Scholar]
- Wasielewski JA, Holloway FA. Alcohol's interactions with circadian rhythms. A focus on body temperature. Alcohol Res Health. 2001;25:94–100. [PMC free article] [PubMed] [Google Scholar]