

Abstract
The Wnt signaling pathway regulates cell growth and development in metazoans, and is therefore of interest for drug discovery. By screening a library of 5,808 pre-fractionated marine extracts in a cell-based Wnt signaling assay, several signaling activators and inhibitors were observed. LCMS based fractionation rapidly identified an active compound from Pseudoceratina purpurea as psammaplin A, a known HDAC inhibitor. Other HDAC inhibitors similarly activated signaling in this assay, indicating HDAC inhibitors will be identified through many cell-based reporter assays. In a large scale analysis of P. purpurea, three previously undescribed bromotyrosine based natural products were identified; the structure of one of these was confirmed by synthesis. Additionally, three other derivatives of psammaplin A were prepared: a mixed disulfide and two sulfinate esters. Finally, evidence to support a structural reassignment of psammaplin I from a sulfone to the isomeric sulfinate ester is presented.
1. Introduction
Cell-based drug screens are valuable tools to identify novel compounds that block or activate signaling pathways, and it is important to understand what classes of molecules may be detected in these assays. The Wnt signaling pathway regulates cell growth and development in metazoans. Anomalies in the regulation of Wnt signaling are associated with multiple diseases including cancer.1 Small molecule modulators of the Wnt pathway are therefore potential therapeutics.2
Bromotyrosine derivatives are a well known group of marine natural products that have been isolated from numerous sponges, most of which belong to the order Verongida. Hundreds of these compounds are known, and they have been extensively reviewed.3 Psammaplin A (1)4-6 was the first identified member of the subgroup of bromotyrosine derivatives that contain both oxime functional groups and carbon-sulfur bonds.7 Subsequently, at least nineteen members of this group of compounds have been isolated from marine organisms.3
Herein is outlined a library screen of 5,808 pre-fractionated marine natural product extracts using a cell-based Wnt signaling assay. This Wnt assay uses a cell line we termed STF3a that was engineered to express luciferase, from an integrated reporter construct, in response to autocrine Wnt signaling. These cells facilitate the identification of both activators and inhibitors of Wnt signaling. The current report focuses on chemical investigation of bromotyrosine derivatives following the identification of 1 as a potent activator of signaling in the STF3a cell line. Using an LCMS based fractionation method,8 1 was rapidly identified from an archive HP20SS fraction of the sponge Pseudoceratina purpurea (Carter, 1880). Mechanistically, 1 appears to activate signaling in the cell-based assay through inhibition of histone deacetylases (HDACs) rather than through a specific Wnt pathway. HDAC inhibitors in general may score as hits in cell-based assays dependent on integrated reporters.

In follow up chemistry studies looking for congeners of 1 three compounds (2, 3, 4) were isolated from P. purpurea. The acid 2 has been synthesized,9 but has not been reported as a natural product. The mixed disulfides 3 and 4 are novel. The structure of 3 was confirmed by semi-synthesis from 1 and N-methyl glutathione. Additionally, three other semi-synthetic derivatives of psammaplin A (1) were prepared: the mixed disulfide 5, and the two sulfinate esters 6 and 7. Furthermore, a structural revision is proposed for psammaplin I10 from the sulfone 8 to the isomeric sulfinate ester 6.
2. Results and Discussion
2.1 Wnt signaling assay and the library screen
In order to identify compounds that inhibit Wnt signaling at any point in the signaling process, an assay was developed which utilized a new cell line (STF3a). The STF3a cell line was generated from the HEK293-based “supertopflash” reporter cell line (STF) developed for Wnt signaling studies by Xu et al.11 To generate the STF3a cell line the STF cell line was modified to stably express high levels of murine Wnt3a. The STF3a cell line constitutively expresses high levels of luciferase, from the β-catenin-responsive integrated reporter, in response to autocrine Wnt signaling. Thus, this STF3a based assay will detect compounds that increase or decrease transcription of the integrated luciferase reporter.
Using these STF3a cells, a pre-fractionated marine natural products library was screened. This library was generated by fractionation of marine invertebrate extracts on Diaion HP20SS resin. In the initial screen for Wnt signaling inhibitors, we noted that there were library fractions that activated expression of the luciferase reporter. Analysis of the data revealed 46 wells with activity between 2 and 55 fold higher than the control (Figure 1), along with a number of wells that inhibited signaling. The current report focuses on follow up investigations arising from one of these activators (well 4WA7). Full details of the STF3a cell line and assay will be described in a separate publication.
Figure 1.

Wnt signaling activators identified from the library screen.
2.2 Rapid identification of psammaplin A as a signaling modulator in the STF3a cell line
Like many natural product libraries, the pre-fractionated library used in the current screen contains mixtures of compounds. In drug screening programs the challenges of rapid compound purification, identification and dereplication associated with natural product mixtures have been seen as disadvantageous vis-à-vis synthetic compound libraries.12 Nonetheless, the unique chemical space occupied by natural products provides a useful complement to synthetic libraries.13 To circumvent challenges associated with natural products based drug discovery a variety of different technologies have been developed.12,14,15 This report highlights an LCMS based fractionation method to expedite natural products based drug discovery,8 demonstrating a rapid identification of psammaplin A (1) from an active well identified in the library screen.
One of the most potent activators from the library screen (49 fold), obtained from the sponge P. purpurea, was selected for further analysis. Our automated LCMS fractionation protocol couples chromatography of library HP20SS fractions on a monolithic C-18 HPLC column with the online collection of accurate mass data on a Q-Tof mass spectrometer.8 A one milligram sample of archive material was subjected to automated LCMS fractionation, generating twenty fractions in a 96 well plate. The biologically active fraction, well number six, eluted between eight and nine min. A number of brominated ions were observed in the MS of this well. On the basis of the taxonomic identification of the source organism and an ion at m/z 662.9578 [M+H]+, the active compound was identified as psammaplin A (1) (calcd for C22H2579Br2N4O6S2, 662.9582). The well was then analyzed by NMR (600 MHz, cryoprobe), and the data were identical to those previously published for 1.16,17 Using this method the active compound was identified in less than one week.
2.3 Putative mechanism of Wnt signaling activation by psammaplin A in the STF3a cell line: a general effect of HDAC inhibitors
Upon considering the mechanism of Wnt signaling activation in the STF3a cell line by psammaplin A (1), it was noted that 1 is a known nanomolar inhibitor of HDACs.10 Therefore, other known HDAC inhibitors were tested in the STF3a assay. Suberoylanilide hydroxamic acid (SAHA),18 trichostatin A,19 and MS-27520 were all found to activate Wnt signaling in a similar manner to 1 (supplementary data Figures S1 to S3). This effect is presumably caused by a general increase in transcription activity by HDAC inhibition. Consistent with this, 1 also activated transcription from an unrelated integrated reporter construct in NPSR-I107 cells.
2.4 Scale up isolation of bromotyrosine derivatives from P. purpurea
In a search for analogs of 1 and to obtain more material for biological evaluation, a scale up extraction of P. purpurea was conducted. The MeOH extract of the sponge was chromatographed on HP20SS resin using a gradient of 100% H2O to 100% MeOH. Psammaplin A was obtained by RP-HPLC of the 100% MeOH fraction. The polar metabolites 2, 3 and 4 were isolated from the 25% MeOH fraction, by LH20 followed by RP-HPLC.
2.4.1 Compound 2
Compound 2 was obtained as an off-white amorphous solid. A mono-brominated cluster in the (-)ESI-MS spectrum supported a molecular formula of C9H8NO4Br (m/z 271.9558 [M-H]-, Δ 0.0 ppm). Comparison of the NMR data observed for 2 and psammaplin A (1) showed analogous chemical shifts and J coupling, with the exception that 2 lacked the CH2CH2 functionality. These data, along with the molecular formula, suggested the simplified parent acid structure for 2, which was supported by gHSQC, gHMBC and gCOSY experiments. Compound 2 has not previously been reported as a natural product; however, 2 is known synthetically9 and its existence as a possible biosynthetic precursor of 1 has been speculated.10,16 The 13C NMR data of the natural product showed some differences to that reported for the synthetic compound, and this was most pronounced on carbons adjacent to atoms subject to hydrogen bonding effects. Upon acidification of 2 with HCl the 13C chemical shifts matched the synthetic data. This suggested the natural product was isolated as a salt, and not surprisingly that the chemical shifts of 2 are pH dependant.
2.4.2 Mixed disulfides 3 and 4
The novel mixed disulfides 3 and 4 were isolated as amorphous white NH4OAc salts,21 and exhibited UV chromophores (λmax 282 nm) cognate to psammaplin A (1). The 1H NMR spectra of 3 and 4 (supplementary data Figures S4 and S5) were similar, with 3 differing by one additional methylene multiplet (δ 3.86). Preliminary analysis of these 1H NMR spectra suggested both compounds were derivatives of the psammaplin A (1) monomeric subunit (Psub, Figure 2), with extra peptide-like functionality. Given the relatively large molecular weights of 3 and 4, the comparative paucity of material and the corollary that sensitive and time consuming NMR experiments were necessary to obtain adequate 2D and 13C data sets, MS and MSMS fragment analysis was relied upon heavily in initial structural elucidation efforts.
Figure 2.

Psammaplin A monomeric subunit.
The ESI-MS spectrum of 3 revealed a mono-brominated molecular ion cluster (m/z = 652/654, [M+H]+). The approach at deriving a molecular formula utilized a bottom-up fragment analysis of the ESI-MSMS spectrum generated from the parent brominated cluster (Table 1 and supplementary data Figure S6). This yielded a molecular formula of C22H30N5O9BrS2 that was confirmed by high-resolution FT-MS analysis (m/z 652.07467 [M+H]+, Δ 0.015 ppm). The ESI-MSMS spectrum showed a number of fragments providing key structural data, including peaks supporting a disulfide derived from Psub (Table 1, entries 2 and 3), a glycine residue (Table 1, entry 6) and an N-methyl group (Table 1, entry 7).
Table 1.
MSMSa analysis of 3: selected key fragments
| Entry | Fragment m/z | Assignment | Interpretation | Calcd mass (Δ, mmu) |
|---|---|---|---|---|
| 1 | 177.0335 | [C5H9N2O3S]+ | Gly-Cys derived fragment | 177.0334 (0.1) |
| 2 | 330.9753 | [Psub]+ | Psammaplin A monomeric subunit (Psub) | 330.9752(0.1) |
| 3 | 362.9465 | [PsubS]+ | Disulfide functionality | 362.9473 (-0.8) |
| 4 | 405.9914 | [PsubSC2H5N]+ | Psammaplin A monomer + a fragment of a Cys or homo-Cys derivative | 405.9895(1.9) |
| 5 | 509.0176 | [PsubSC5H10N2O3]+ | Loss of N-methyl Asp derivative from [M]+ | 509.0164(1.2) |
| 6 | 577.0367 | [M-Gly]+ | Loss of Gly from [M]+ | 577.0426 (-5.9)b |
| 7 | 621.0319 | [M-CH4N]+ | Loss of N-methyl from [M]+ | 621.0325 (-0.6) |
| 8 | 652.0747 | [M+H]+ = C22H30N5O9BrS2 | Set as lock mass, based on ESI-MS |
Measured on a Micromass Q-Tof mass spectrometer.
The error in this peak (10 ppm) is enhanced by a contribution from a smaller overlapping fragment. A minor peak observed at m/z 575.0207 is assigned as C20H2479BrN4O7S2 (calcd 575.0270; Δ -6.3 mmu) and the 81Br isotopic ion of this fragment (calcd 577.0249) overlaps the [M-Gly]+ fragment. An analogous signal in the MSMS spectrum of the homolog 4 (see Table 2, entry 7), not distorted by overlapping peaks, shows a good match to the assigned formula (577.0433, Δ 0.7).
The structural elucidation of 3 was completed by analysis of gCOSY, TOCSY, gHSQC and gHMBC data. NMR signals (Table 3) consistent with cysteine, glutamate and glycine residues, along with Psub and an N-methyl group were present. The configuration about the oxime functionality in Psub was assigned as E based on the 13C shift of the benzylic carbon (δ 28.5), following the literature precedent.6 The N-methyl glutathione half of the disulfide was pieced together from the amino acid residues based on the gHMBC spectrum; see Figure 3 for key correlations. The overall structure was finalized by linking Psub and the N-methyl glutathione substructure, necessitating a disulfide bond between the Psub sulfur and the cysteine sulfur. This structure was consistent with the MSMS data (Figure 4).
Table 3.
NMR dataa for 3, 4 and 5
| Position |
3b |
4c |
5e |
|||
|---|---|---|---|---|---|---|
| δH (m, J in Hz) | δC | δH (m, J in Hz) | δC | δH (m, J in Hz) | δC | |
| 2 | 2.84 (m) | 38.3 | 2.80 (t, 6.1) | 37.7 | 2.84 (d, 6.9) | 38.7 |
| 3 | 3.54 (m) | 39.9 | 3.39 (m) | 38.8 | 3.53 (m) | 39.9 |
| 4 | - | - | 8.02 (m) | - | - | - |
| 5 | - | 166.0 | - | 164.1 | - | 166.1 |
| 6 | - | 153.5 | - | 152.3 | - | 153.2 |
| 7 | 3.78 (s) | 28.5 | 3.68 (s) | 28.2 | 3.78 (s) | 28.8 |
| 8 | - | 130.8 | - | 129.3 | - | 130.7 |
| 9 | 7.36 (d, 2.0) | 134.6 | 7.28 (d, 1.8) | 133.4 | 7.35 (d, 2.0) | 134.6 |
| 10 | - | 110.6 | - | 109.5 | - | 110.6 |
| 11 | - | 153.9 | - | 153.1 | - | 153.9 |
| 12 | 6.76 (d, 8.3) | 116.9 | 6.86 (d, 8.0) | 116.9 | 6.77 (d, 8.3) | 117.2 |
| 13 | 7.06 (dd, 2.0, 8.3) | 130.2 | 6.98 (dd, 1.8, 8.0) | 129.7 | 7.05 (dd, 2.0, 8.3) | 130.5 |
| Glu | ||||||
| 1' | - | 173.1 | - | 173.0d | - | 174.4 |
| 2' | 3.52 (m) | 64.7 | 3.28 (m) | 63.0 | 3.66 (m) | 55.7 |
| N-CH3 | 2.66 (s) | 32.3 | 2.48 (s) | 32.3 | - | - |
| 3' | 2.02 (m) | 26.0 | 1.94 (m) | 26.3 | 2.14 (m) | 28.0 |
| 2.20 (m) | ||||||
| 4' | 2.55 (m) | 32.5 | 2.30 (m) | 32.6 | 2.54 (m) | 33.2 |
| 5' | - | 175.4 | - | 175.7d | - | 175.5 |
| Cys | ||||||
| N-H | - | - | 8.15 (m) | - | - | - |
| 6' | - | 173.0 | - | 171.1d | - | 172.4 |
| 7' | 4.70 (dd, 4.2, 10.0) | 54.1 | 4.24 (m) | 53.7 | 4.70 (dd, 4.5, 9.7) | 54.3 |
| 8' | 2.91 (dd, 10.0, 14.0) | 40.8 | 2.98 (m) | 42.8 | 2.93 (dd, 9.7, 14) | 41.3 |
| 3.26 (dd, 4.2, 14.0) | 3.17 (m) | 3.25 (dd, 4.5, 14) | ||||
| N-H | - | - | - | - | - | - |
| Gly | ||||||
| 9' | - | 173.4 | - | - | - | 176.2 |
| 10' | 3.82 (d, 17.0) | 42.8 | - | - | 3.77 (m) | 44.6 |
| 3.90 (d, 17.0) | ||||||
| NH4OAc | 1.93 (s) | 176.0, 22.2 | 1.95 (s) | 172.1, 19.6 | 1.95 (s) | 177.4, 22.2 |
Signals were assigned using a combination of gHSQC, gHMBC and gCOSY experiments.
CD3OD: 1H and 13C spectra were recorded at 600 and 150 MHz, respectively.
DMSO-d6: 1H and 13C spectra were recorded at 500 and 125 MHz, respectively.
These carbons were observed in a separate experiment; at 125 MHz in a Shigemi tube in DMSO-d6/CD3CN/H2O (5:2.5:1).
CD3OD: 1H and 13C spectra were recorded at 500 and 125 MHz, respectively.
Figure 3.
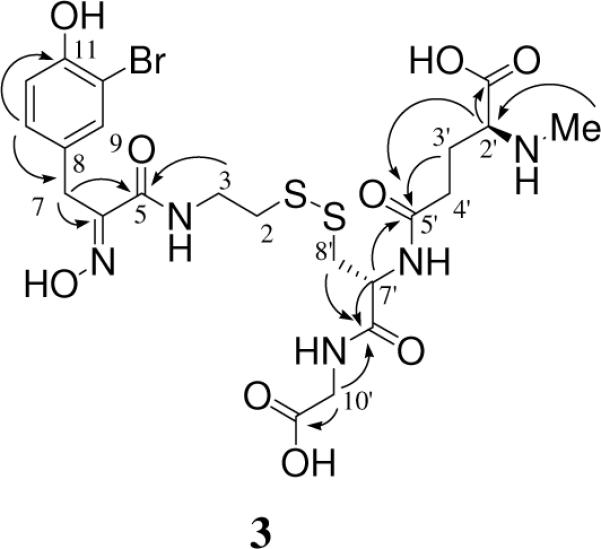
Selected gHMBC correlations (600 MHz) observed for 3.
Figure 4.

Selected MSMS fragments for 3.
The structural assignment of 3 was initially supported by a synthesis of the analog 5 from 1 and L-glutathione. Subsequently the structure of 3 was unambiguously confirmed by its synthesis from 1 and N-methyl L-glutathione (see section 2.5). The absolute configuration of each stereocenter in 3 was assigned to match that of naturally occurring L-glutathione based on the close similarities between the optical rotation of the natural product 3 ([α]D -21°, MeOH), with the semi-synthetic compounds 3 ([α]D -33°, MeOH) and 5 ([α]D -22°, MeOH).
The structural elucidation of 4 was achieved by reference to 3. The molecular formula of 4 was similarly derived by bottom up fragment analysis of the ESI-MSMS spectrum (Table 2 and supplementary data Figure S7). This yielded a molecular formula of C20H27N4O8BrS2 that was confirmed by high resolution FT-MS analysis (m/z 595.05347 [M+H]+, Δ 0.47 ppm). The molecular formula of 4 represents a difference of a glycine residue from 3. The MSMS and NMR data (Table 3) of 4 were consistent with this compound being a homolog of 3, lacking the glycine. The optical rotations of 3 and 4 were similar suggesting they possess identical absolute stereochemical configurations, as would be expected from a biosynthetic perspective.
Table 2.
MSMSa analysis of 4: selected key fragments
| Entry | Fragment m/z | Assignment | Interpretation | Calcd mass (Δ, mmu) |
|---|---|---|---|---|
| 1 | 120.0202 | [C3H6NO2S]+ | Cys derived fragment | 120.0119(8.3) |
| 2 | 330.9765 | [Psub]+ | Psammaplin A monomeric subunit (Psub) | 330.9752(1.3) |
| 3 | 362.9484 | [PsubS] | Disulfide functionality | 362.9473(1.1) |
| 4 | 405.9911 | [PsubSC2H5N]+ | Psammaplin A monomer + a fragment of a Cys or homo-Cys derivative | 405.9895(1.6) |
| 5 | 451.9975 | [PsubSC3H7NO2]+ | Loss of N-methyl Asp derivative from [M]+ | 451.9949(2.6) |
| 6 | 564.0140 | [M-CH4N]+ | Loss of N-methyl from [M]+ | 564.0110(3.0) |
| 7 | 577.0433 | [M-OH]+ | Loss of water from [M+H]+ | 577.0426 (0.7) |
Measured on a Micromass Q-Tof mass spectrometer.
The mixed disulfides 3 and 4 possess some interesting structural features. We are only aware of one other report of marine derived small molecules (two analogs) that contain the glutathione substructure.22 Furthermore, we are unaware of any other natural products that contain the N-methyl glutathione substructure. Biosynthetically 3 and 4 are likely derived by disulfide exchange between 1 and oxidized N-methyl glutathione (or derivatives). Several other mixed disulfide derivatives of 1 have been isolated from sponges.4,10,16,17,23,24 These previously reported compounds all contain -CH2CH2SSCH2CH2- functional groups, which contrasts with the disulfide functionality in 3 and 4.
2.5 Semi-synthesis of the mixed disulfides 3 and 5
Syntheses of 3 and its de-methylated primary amine analog 5 were achieved by disulfide exchange chemistry. The latter compound was readily prepared as a model compound from commercially available oxidized L-glutathione (9) and psammaplin A (1). Based on a modification of a disulfide exchange method,25 1 and 9 were coupled in the presence of dithiothreitol (DTT) to give 5 (Scheme 1). MSMS and NMR data for 5 supported the structural assignments of the natural products 3 and 4. The MSMS spectrum of 5 (supplementary data Figure S8) displayed all the same peaks observed in the MSMS spectrum of 3 other than those attributable to fragments containing the N-methyl moiety (though analogous peaks to these were observed). The NMR spectra for 3 and 5 (supplementary data Figures S9 and S10) were similar, with the major difference being the chemical shift of the signals observed about C-2' (Table 3).
Scheme 1.

Semi-synthesis of 5. Conditions: DTT, K2CO3, THF/MeOH/PBS (pH=8.4), 22 hr, 46% from 1 (unoptimized).
While 5 was easily prepared from 1 and commercially available 9, the synthesis of 3 required access to an appropriate N-methyl derivative of glutathione as a building block. Our approach to this key precursor was based in part on a literature preparation of an N-methyl glutathione containing leukotriene, which utilized a reductive methylation strategy.26 In this direction 9 was esterified27 to give 10,28 which was then converted to the imine 11 by condensation with 2-nitrobenzaldehyde (Scheme 2). Initial attempts to convert this imine directly into the tertiary amine 12, following a slight modification of a literature single-pot strategy (MeOH, NaBH3CN, paraformaldehyde),29 were unsuccessful, presumably due to the low solubility of 11 in methanol. A reduction of 11 using NaBH3CN in acetonitrile/DMSO26 successfully gave the secondary amine 13, which was then reductively methylated with paraformaldehyde and NaBH3CN to give 12. Subsequently, an efficient one-pot reduction of 11 to 12 was achieved in acetonitrile/DMSO. In this case the thiocyanate derivative 14 was obtained as a minor side product.
Scheme 2.

Reductive alkylation reactions. Conditions: (a) NaOH (2.1 equiv), 2-nitrobenzaldehdyde (2.2 equiv.), MeOH/H2O, overnight, 83%; (b) NaBH3CN, ACN/DMSO, AcOH(cat), 3-16 hr, 13 71%; (c) paraformaldehyde (excess), ACN/DMSO, 8-16 hr, (d) NaBH3CN, AcOH(cat), overnight, 12 66-84%, 14 6%.
The synthesis of 3 was completed by removal of the protecting groups on the amine and carboxylic acid functionalities, followed by a disulfide exchange reaction (Scheme 3). Firstly, photolytic cleavage of the 2-nitrobenzyl group in 12 led to N-methyl glutathione tetra ethyl ester (15) in good yield. Compound 15 was then treated with 5.1 equivalents of LiOH (THF/H2O) to hydrolyze the ester moieties. In the same pot, the reaction was buffered (PBS) and then DTT and 1 in MeOH were added. After reacting overnight, analytical HPLC of this disulfide exchange reaction revealed a peak with an identical retention time and chromophore to the 3 isolated from P. purpurea. Purification of this material by semi-preparative HPLC gave semi-synthetic 3, which exhibited spectroscopic data consistent with that recorded for the natural product.
Scheme 3.

Photolysis of 12 and the semi-synthesis of 3. Conditions: (a) 0.5 mmol in ACN, hν 360 nm, 2 hr, 91%; (b) LiOH (5.1 equiv), THF/H2O, overnight; (c) PBS (pH 8.4), MeOH, 1 (6 equiv), DTT, overnight, 38% over two steps.
2.6 Semi synthetic sulfinate ester derivatives of 1 and proposed structural revision of psammaplin I
To develop structure activity relationships and provide analogs of psammaplin A (1), two semi-synthetic methyl sulfinate ester derivatives of 1 were prepared by oxidative methanolysis. Following a modified version of Brownbridge's method,30 1 was treated with an excess of N-bromosuccinimide (NBS) in methanol. HPLC purification led to the isolation of the methyl sulfinate ester 6 (11%) and its di-brominated analog 7 (14%) (Scheme 4). Although yields are low and unoptimized sufficient material was obtained for full compound characterization.
Scheme 4.

Oxidative methanolysis of 1. Conditions: NBS (2.4 equiv), MeOH, 0°C → room temp., 40 min, 6 11%, 7 14% (unoptimized).
Psammaplin I is a bromotyrosine derivative reported from the sponge P. purpurea that was assigned as the terminal methyl sulfone 8,10 and represents a structural isomer of the methyl sulfinate ester 6. The 13C and 1H NMR spectra of 6 (supplementary data Figures S11 and S12) are identical to those reported for psammaplin I. On the basis of spectroscopic equivalence, the above synthesis and additional data discussed below, we propose a structural revision of psammaplin I from 8 to 6.
The sulfone functionality in psammaplin I was originally assigned on the basis of an infrared absorbance (IR) at 1284 cm-1 and the 13C NMR shift of the methyl group at δc 54.1.10,31 Most known psammaplin analogs reportedly exhibit IR absorbances in the range 1255-1290 cm-1;10,16,32 for example, psammaplin E (16) and F (17) both show peaks at 1287 cm-1.10 Thus, the IR absorbance at 1284 cm-1 in psammaplin I can not be reliably attributed to a sulfone moiety. Also, the 13C NMR shift at δc 54.1 is not consistent with a terminal methyl sulfone substructure, such methyl carbons are usually observed in the range of δc 37-45.33 We conducted DFT calculations34 modeling the 13C NMR shifts of 8 and 6 (Table 4). These showed a much better fit to the observed data for the sulfinate ester structure.
Table 4.
Calculated NMR shifts for 6 and 8 compared to observed data
| Position | Synthetic product | 6 | 8 | ||
|---|---|---|---|---|---|
| Observed δc | Calcd δc | Δδ | Calcd δC | Δδ | |
| CH3 | 55.7 | 53.3 | -2.4 | 43.8 | -11.9 |
| C-2 | 57.4 | 59.9 | 2.5 | 58.9 | 1.5 |
| C-3 | 33.5 | 34.8 | 1.3 | 38.4 | 4.9 |

Methyl sulfinate esters and their isomeric terminal methyl sulfones can be distinguished by mass spectrometry. Methyl sulfinate esters fragment to give intense peaks resulting from a loss of methanol; comparable peaks of significant intensity are not observed from sulfone isomers.35 Additional evidence supporting the structural assignment of 6 as a methyl sulfinate ester was obtained by FT-ESI-MSMS analysis (Figure 5). The molecular ion from 6 was fragmented and formed a base peak at m/z 347, resulting from a loss of methanol (Δ 32.0264, CH3OH calcd 32.0262). This fragmentation pattern would not be expected for the sulfone 8; rather a peak arising from a loss of the terminal methyl group would be expected.
Figure 5.

FT-MSMS of sulfinate ester 6 showed a loss of methanol.
3. Conclusions
In conclusion, we screened a pre-fractionated marine natural product library in a luciferase based Wnt signaling assay. This assay utilized the STF3a cell line, which constitutively expressed luciferase in response to autocrine Wnt signaling. Several activators and inhibitors of signaling were identified from the library. Psammaplin A (1), a known HDAC inhibitor from P. purpurea, was rapidly identified as an activator of the reporter construct in the STF3a cell line; other known HDAC inhibitors elicited similar activations of signaling. In follow up chemical studies three new bromotyrosine based natural products (1, 3 and 4) were identified. The structures of 3 and 4 were supported by a syntheses of the former compound and of 5. Finally, a structural reassignment of psammaplin I from the sulfone 8 to the isomeric sulfinate ester 6, supported by synthetic and spectroscopic studies, was presented.
4. Experimental
4.1 General procedures
Optical rotations were measured on a Perkin Elmer Model 343 Digital Polarimeter. Infrared spectra were recorded on NaCl plates, using a JASCO FTIR-420 spectrophotometer. UV spectra were acquired on a Hewlett-Packard 8452A spectrophotometer. ESI-MS spectra were obtained using a Q-Tof Micromass spectrometer. FT-MS spectra were obtained using a ThermoFinnigan LTQ-FT mass spectrometer. NMR spectra were obtained either on a Varian Mercury spectrometer operating at 400 and 100 MHz for 1H and 13C respectively, or on Varian INOVA spectrometers operating at 500/600 and 125/150 MHz for 1H and 13C respectively. Chemical shifts are reported in ppm and were referenced to residual solvent signals: CD3OD (δH 3.30; δC 49.15), DMSO-d6 (δH 2.50; δC 40.3), Cδ3CN (δH 1.94; δC 1.32).
4.2 LCMS based analysis of library hit 4WA7
The preliminary LCMS fractionation of the active HP20SS fraction (4WA7 = FJ04-4-36-F2), utilized a sample of archive material (200 μL, 5.0 mg/mL). The HPLC method started with 10% ACN/H2O (flow rate 1.5 mL/min) and held for one min, followed by a linear gradient from 10% to 100% over 16 min and held at 100% ACN for 4.5 min, returning to starting conditions over 0.5 min (total run time 22.0 min). A solvent delay was set on the mass spectrometer for 1.8 min to allow the DMSO slug to elute prior to acquiring MS data. At two min, the fraction collector began collecting one min fractions for a total of 20 fractions. The active fraction was number six and eluted between eight and nine min. MS gave [M+H]+ m/z 662.9578, calcd for psammaplin A (1) C22H2579Br2N4O6S2, 662.9582. Leucine enkephalin was used for lock mass and set at m/z 556.2771 for the [M+H]+.
4.3 HDAC inhibitor effect on Wnt signaling
HDAC inhibitors were tested by plating 20,000 STF3a cells/well in 96 well tissue culture plates pretreated with poly-L-lysine. Plates were incubated overnight at 37°C in 5% CO2. Just prior to adding compounds, media was replaced with 200 μL of fresh media containing HDAC inhibitors in a range from 30 μM to 10 nM and incubated overnight. Cells were washed once with 200 μL of cold PBS and then lysed in 20 μL Cell Culture Lysis Reagent (Promega) and complete protease inhibitor cocktail without EDTA (Roche). Lysates were mixed with 60 μL of 0.15 mg/mL D-luciferin in 25 mM gly-gly pH 7.8, 15 mM MgSO4, and 4 mM EGTA. Luminescence data were obtained using a Veritas microplate luminometer (Turner Biosystems).
After luminescence data were collected, lysates were mixed with 60 μL of substrate solution for a coupled assay to detect lactate dehydrogenase activity. Light absorbance at 490 nm was read every 10 seconds for 5 minutes, and slopes were plotted and used for normalization of luminescence data. The substrate solution was made by combining three separate component solutions. Component one: 316 mM sodium L-lactate in 10 mM Tris, pH 8.5; component two: 40 mM iodonitrotetrazolium chloride in DMSO; component three: 10 units/mL diaphorase, 325 μg/mL BSA, 12 mg/mL sucrose, and 3 mg/mL NAD+ in PBS. Components one and three were frozen in 20 mL aliquots at -20°C. Component two was frozen in 2 mL aliquots at -20°C and was diluted in 18 mL of PBS before mixing with components one and three for use.
4.4 Collection, extraction and identification of Pseudoceratina purpurea
The sponge Pseudoceratina purpurea (Carter, 1880) was collected by SCUBA off the coast of Fiji in 2004 (S 17° 00.064', E 178° 37.705'). A voucher specimen (FJ04-4-36) is retained at the University of Utah.
A portion of the frozen sponge (300 g, wet weight) was broken into pieces and extracted with MeOH (2 × 700 mL), which was filtered and concentrated in vacuo. The combined vacuum dried extracts (15 g) were adsorbed onto diaion HP20SS resin (5 g) in a minimal volume of MeOH. The resulting HP20SS slurry was concentrated in vacuo and then loaded on the top of a packed HP20SS column (25 g resin, length 15 cm, radius 1.5 cm) pre-equilibrated with H2O. The column was eluted with a gradient of H2O/MeOH (four steps 100:0→75:25→50:50→25:75→ 0:100) followed by 100% IPA. The 100% MeOH fraction contained fairly pure psammaplin A (1, 2.5 g), a sample of which was further purified by RP-HPLC (Phenomenex, phenylhexyl, 5 μm, 250 × 10 mm, 4 mL/min) using isocratic MeOH/H2O (65:35, retention time 14.5 min).
The 25% MeOH fraction off the HP20SS column was subjected to gel permeation chromatography on a Sephadex LH-20 column (length 30 cm, radius 1.5 cm, 100% MeOH) yielding 14 sub-fractions. The seventh LH-20 sub-fraction (7 mg) was purified by RP-HPLC (Phenomenex, C-18, 5 μm, 250 × 10 mm, 4 mL/min) using an isocratic mixture (4:21) of ACN and aqueous NH4OAc buffer (0.1 M), to give 3 (1.5 mg, retention time 21.5 min) and 4 (1.0 mg, retention time 23.8 min) as amorphous white solids.
The eighth LH-20 sub-fraction (14 mg) was also purified by RP-HPLC. The material was first processed on a C-18 column (Phenomenex, 5 μm, 250 × 10 mm, 4 mL/min) using an isocratic mixture (27:73) of ACN and aqueous AcOH (0.1%) to give impure 2 (~2 mg, retention time 11.5 min). Reprocessing of the material on a phenylhexyl column (Phenomenex, 5 μm, 250 × 10 mm, 4 mL/min) using an isocratic mixture of MeOH/H2O (12:88) yielded a salt of 2 (~1 mg, retention time 7.7 min) as an amorphous off-white solid. The salt of 2 was dissolved in H2O and acidified with HCl (1 M, 40 μL), before being extracted with EtOAc (5 mL). The organic phase was concentrated in vacuo to yield 2 (< 1 mg).
4.4.1 Compound 3
(+) ESI-MS m/z: 652 ([M+H]+, 79Br), 654 ([M+H]+, 81Br). (+) FT-MS m/z: found 652.07467 (C22H31N5O9S2Br [M+H]+ calcd 652.07466). ESI-MSMS: Table 1, and supplementary data Figure S6. UV (MeOH) λmax (log ε): 212 (4.36), 282 (3.75). [α]D -21° (MeOH). IR ν (cm-1): 2800-3600, 1654, 1539. 1H NMR: see Table 3. 13C NMR: see Table 3.
4.4.2 Compound 4
(+) ESI-MS m/z: 595 ([M+H]+, 79Br), 597 ([M+H]+, 81Br). (+) FT-MS m/z: found 595.05347 (C20H28N4O8S2Br [M+H]+ calcd 595.05319). ESI-MSMS: Table 2, and supplementary data Figure S7. [α]D -26° (MeOH). 1H NMR: see Table 3. 13C NMR: see Table 3.
4.5 Synthesis of the imine 11
The imine 11 was prepared by the following two step process. Anhydrous HCl gas (420 mmol) was bubbled into an ice cooled and stirred suspension of 9 (Acros, 1.18 g, 1.9 mmol) in dry EtOH (25 mL) over 40 min. The resulting solution was sealed and stored at 4°C for three days. The solution was then concentrated in vacuo to afford 10 (1.54 g, 1.9 mmol, quant.).
NaOH solution (2.13 mL, 1.0 M) was added to an ice cooled stirred solution of 10 (850 mg, 1.07 mmol) in MeOH/H2O (2:10, 12 mL), followed by the addition of 2-nitrobenzaldehyde (Acros, 331 mg, 2.19 mmol). After stirring at room temperature overnight the resulting white suspension was collected by filtration (washing with ice cold water) and dried in vacuo to yield 11 (873 mg, 0.9 mmol, 83%) as an amorphous white solid.
4.5.1 Compound 10
(+) ESI-MS m/z 725 [M+H]+.[α]D -77° (MeOH).1H NMR (400 MHz, CD3OD) δ ppm: 4.76 (dd, 4.5, 9.4 Hz, H-7), 4.30 (q, 7 Hz, CH2CH3), 4.17 (q, 7 Hz, CH2CH3), 4.13 (m, H-2), 3.95 (d, 2.1 Hz, H-10), 3.26 (dd, 4.1, 13.8 Hz, H-8a), 2.97 (dd, 13.8, 9.4 Hz, H-8b), 2.59 (t, 7.6 Hz, H-4), 2.25 (m, H-3), 1.33 (t, 7 Hz, CH2CH3), 1.26 (t, 7 Hz, CH2CH3). 13C NMR (100 MHz, CD3OD) δ ppm: 174.5, 173.1, 171.2, 170.3, 64.0, 62.5, 54.0, 53.8, 42.3, 41.5, 32.4, 27.1, 14.64, 14.57.
4.5.2 Compound 11
(+) ESI-MS m/z: 991.3189 (C42H55N8O16S2 [M+H]+ calcd 995.3177). 1H NMR (500 MHz, DMSO-d6) δ ppm: 8.65 (s, imine-CH), 8.38 (t, 6.0 Hz, glycine-NH), 8.24 (d, 8.5 Hz, cysteine-NH), 8.07 (d, 8.0 Hz, ArH), 7.98 (d, 7.8 Hz, ArH), 7.82 (m, ArH), 7.74 m, ArH), 4.60 (m, H-7), 4.15 (m, H-2), 4.12 (q, 7 Hz, CH2CH3), 4.05 (q, 7 Hz, CH2CH3), 3.80 (d, 5.7 Hz, H-10), 3.08 (dd, 4.5, 13.6 Hz, H-8a), 2.80 (dd, 10, 13.6 Hz, H-8b), 2.17 (m, H-4) 2.16, 1.99 (m, H-3 a & b), 1.20 (t, 7 Hz, CH2CH3), 1.17 (t, 7 Hz, CH2CH3). 13C NMR (100 MHz, DMSO-d6) δ ppm: 172.4 (C-5), 171.6 (C-1), 171.4 (C-6), 170.2 (C-9), 161.0 (imine CH), 149.6 (ArC), 134.5 (ArC), 132.5 (ArC), 130.7 (ArC), 130.4 (ArC), 125.1 (ArC), 71.7 (C-2), 61.4 (CH2CH3), 61.2 (CH2CH3), 52.2 (C-7), 41.6 (C-10), 40.9 (C-8), 32.0 (C-4), 29.2 (C-3), 14.8 (2×CH3).
4.6 Synthesis of the N-(2-nitrobenzyl) amine 13
To a solution of the imine 11 (122 mg, 123 μmol) in acetonitrile/DMSO (3:1, 4 mL) was added NaBH3CN (61 mg, 970 μmol) followed by AcOH (6 drops). After stirring for three hours saturated NaHCO3 solution (50 mL) and methylene chloride (150 mL) were added. The mixture was extracted and separated. The aqueous phase was then reextracted with methylene chloride (150 mL). The combined organic phases were dried (MgSO4) and concentrated in vacuo. The resulting crude material was purified by gel permeation chromatography on LH-20 (30 cm, 90 mL, 100% MeOH) to give 13 (87 mg, 87.6 μmol, 71%) as an amorphous off white solid.
4.6.1 Compound 13
(+) ESI-MS m/z: 995.3516 (C42H59N8O16S2 [M+H]+ calcd 995.3490). [α]D -61° (MeOH). 1H NMR (400 MHz, CD3OD) δ ppm: 7.91 (1H, d, 6.6 Hz, Ar-H), 7.63 (2H, m, ArH), 7.47 (1H, m ArH), 4.88 (m, H-7), 4.15 (q, 7 Hz, CH2CH3), 4.09 (q, 7 Hz, CH2CH3), 3.98 (d, 8.3 Hz, NHCH2), 3.93 (d, 2.5 Hz, H-10), 3.27 (m, H-2), 3.19 (dd, 4.7, 14.5 Hz, H-8a), 2.92 (dd, 9.2, 14.5 Hz, H-8b), 2.40 (t, 7.1 Hz, H-4), 2.01-1.82 (m, H-3), 1.23 (t, 7 Hz, CH2CH3). 13C NMR (125 MHz, CD3OD) δ ppm: 176.3 (C-1), 175.5 (C-5), 173.2 (C-6), 171.2 (C-9), 150.9 (ArC), 136.3 (ArC), 134.4 (ArC), 132.8 (ArC), 129.6 (ArC), 125.8 (ArC), 62.5 (CH2CH3), 62.2 (CH2CH3), 61.8 (C-2), 53.8 (C-7), 49.7 (NHCH2), 42.3 (C-10), 42.0 (C-8), 33.2 (C-4), 30.0 (C-3), 14.7 (CH3), 14.6 (CH3).
4.7 Synthesis of the tertiary amine 12 and the thiocyanate derivative 14
4.7.1 Synthesis of compound 12 from 13
A solution of the amine 13 (76.5 mg, 77 μmol) and paraformaldehyde (Acros, 40 mg, 1.3 mmol) in acetonitrile/DMSO (3:1, 4 mL) was stirred for eight hours. NaBH3CN (35 mg, 557 μmol) and AcOH (6 drops) were then added, and the solution was left to stir overnight. Saturated NaHCO3 solution (50 mL) and methylene chloride (25 mL) were then added and the mixture extracted and separated. The aqueous phase was reextracted with methylene chloride (25 mL). The combined organic phases were dried (MgSO4) and concentrated in vacuo. The resulting crude material was purified by gel permeation chromatography on LH-20 (30 cm, 90 mL, 100% MeOH) to give 12 (51.5 mg, 51.8 μmol, 66%) as an oil.
4.7.2 Synthesis of compounds 12 and 14 from 11
To a solution of the imine 11 (773 mg, 0.78 mmol) in acetonitrile/DMSO (3:1, 12 mL) was added NaBH3CN (105 mg, 1.67 μmol) followed by AcOH (6 drops). After stirring overnight paraformaldehyde (Acros, 200 mg, 6.7 mmol) was added. After another nine hours additional NaBH3CN (400 mg, 6.4 mmol) was added and the solution was again stirred overnight. Saturated NaHCO3 solution (75 mL) and methylene chloride (150 mL) were then added. The mixture was separated, and the aqueous phase re-extracted with methylene chloride (150 mL). The combined organic phases were dried (MgSO4) and concentrated in vacuo. The resulting crude material was purified by gel permeation chromatography on LH-20 (30 cm, 90 mL, 100% MeOH) to give 12 (672 mg, 0.65 μmol, 84%) as an immobile oil, along with 14 (48 mg, 6%) as an amorphous solid.
4.7.3 Compound 12
(+) ESI-MS m/z: 1023.3806 (C44H63N8O16S2 [M+H]+ calcd 1023.3803). [α]D -74° (MeOH). 1H NMR (500 MHz, CD3OD) δ ppm: 7.80 (1H, m, ArH), 7.61 (2H, m, ArH), 7.45 (1H, m, ArH), 4.86 (dd, 5.1, 9.2 Hz, H-7), 4.18 (m, CH2CH3), 4.05, 3.96 (both d, 14.5 Hz, NHCH2), 3.93 (d, 2.5 Hz, H-10), 3.32 (m, H-2), 3.19 (dd, 5.1, 14.0 Hz, H-8a), 2.94 (dd, 9.2, 14.0 Hz, H-8b), 2.31 (m, H-4), 2.17 (s, N-CH3), 1.97 (m, H-3), 1.29 (t, 7 Hz, CH2CH3), 1.23 (t, 7 Hz, CH2CH3). 13C NMR (125 MHz, CD3OD) δ ppm: 175.7 (C-1), 173.4 (C-5), 173.2 (C-6), 171.2 (C-9), 151.5 (ArC), 135.5 (ArC), 133.9 (ArC), 132.6 (ArC), 129.6 (ArC), 125.6 (ArC), 66.6, (C-2), 62.5 (CH2CH3), 61.6 (CH2CH3), 57.6 (NHCH2), 53.9 (C-7), 42.3 (C-10), 42.1 (C-8), 37.0 (N-CH3), 33.3 (C-4), 26.5 (C-3), 15.0 (CH2CH3), 14.6 (CH2CH3).
4.7.4 Compound 14
ESI-MS m/z: 538.1978 (C23H32N5O8S [M+H]+ calcd 538.1972). [α]D -27° (MeOH). IR ν (cm-1): 2156 sharp (C≡N stretch). 1H NMR (400 MHz, CD3OD) δ ppm: 7.81 (1H, m, ArH), 7.61 (2H, m, ArH), 7.47 (1H, m, ArH), 4.81 (dd, 5.0, 7.7 Hz, H-7), 4.18 (m, CH2CH3), 4.08, 3.97 (both d, 14.5 Hz, NHCH2), 3.94 (d, 2.5 Hz, H-10), 3.50 (dd, 5.0, 13.5 Hz, H-8a), 3.33 (m, H-2), 3.29 (dd, 7.7, 13.5 Hz, H-8b), 2.31 (m, H-4), 2.18 (s, N-CH3), 1.99 (m, H-3), 1.31 (t, 7 Hz, CH2CH3), 1.25 (t, 7 Hz, CH2CH3). 13C NMR (100 MHz, CD3OD) δ ppm: 175.9 (C-1), 173.4 (C-5), 171.6 (C-6), 171.2 (C-9), 151.5 (ArC), 135.5 (ArC), 133.9 (ArC), 132.6 (ArC), 129.6 (ArC), 125.6 (ArC), 113.6 (C≡N), 66.6, (C-2), 62.5 (CH2CH3), 61.6 (CH2CH3), 57.7 (NHCH2), 53.9 (C-7), 42.3 (C-10), 36.8 (N-CH3), 36.4 (C-8), 33.2 (C-4), 26.2 (C-3), 15.0 (CH2CH3), 14.6 (CH2CH3).
4.8 Synthesis of oxidized glutathione N-methyl amine, tetraethyl ester (15)
The amine 12 (28.5 mg, 27 μmol) was photolyzed in six batches. Samples dissolved in acetonitrile (concentration of ~0.5 mmol/L) were placed in pear shaped Kontes flasks disposed ~10 cm away from a 360 nm lamp. No cooling was necessary and each sample was irradiated for two hours. The combined photolyzed samples were concentrated in vacuo to give an orange gum. Purification by gel permeation chromatography on LH-20 (30 cm, 90 mL, 100% MeOH) yielded 15 (19 mg, 25 μmol, 91%) as a semi-solid.
4.8.1 Compound 15
(+) ESI-MS m/z 753.3165. (C30H53N6O12S2 [M+H]+ calcd 753.3163) [α]D -34° (MeOH). 1H NMR (500 MHz, CD3OD) δ ppm: 4.82 (dd, 4.5, 9.5 Hz, H-7), 4.20 (q, 7 Hz, CH2CH3), 4.17 (q, 7 Hz, CH2CH3), 3.95 (d, 3.0 Hz, H-10), 3.27 (dd, 6.5, 13.5 Hz, H-2), 3.22 (dd, 4.5, 14.0 Hz, H-8a), 2.92 (dd, 9.5, 14.0 Hz, H-8b), 2.36 (m, H-4), 2.34 (N-CH3), 1.97 (m, H-3), 1.28 (t, 7 Hz, CH2CH3), 1.25 (t, 7 Hz, CH2CH3). 13C NMR (125 MHz, CD3OD) δ ppm: 175.3 (C-5),* 175.2 (C-1),* 173.2 (C-6), 171.2 (C-9), 63.5 (C-2), 62.5 (CH2CH3), 62.3 (CH2CH3), 53.8 (C-7), 42.3 (C-10), 41.8 (C-8), 34.4 (N-CH3), 33.0 (C-4), 29.1 (C-3), 14.8 (CH2CH3), 14.6 (CH2CH3). *Interchangeable assignments.
4.9 Synthesis of the natural product 3
To a vigorously stirred solution of 15 (14 mg, 18.6 μmol) in THF/H2O (1:1, 3 mL) was added aqueous LiOH (95 μmol from a 1.0 M solution). The solution was stored at 4°C overnight and then stirred four hours at room temperature. Phosphate buffer (4 mL, pH = 8.4, 12 mM phosphates) was then added followed by DTT (2 mg, 13 μmol) and psammaplin A (1, 75 mg, 113 μmol) in MeOH (10 mL). After stirring overnight, at room temperature, the reaction was concentrated in vacuo and the crude material purified by RP-HPLC (Phenomenex, C-18, 5 μm, 250 × 10 mm, 4 mL/min) using an isocratic mixture (19:81) of ACN and aqueous NH4OAc buffer (0.1 M), to give 3 (4.7 mg, 7.2 μmol, 38% based on 15; retention time 12.7 min).
4.10 Synthesis of compound 5
A solution of psammaplin A (1, 37 mmol), oxidized L-glutathione (Acros, 68 mmol), K2CO3 (90 mg, excess) and DTT (38 mmol) in THF:MeOH (1:6, 7 mL) and phosphate buffer (3 mL, pH = 8.4, 12 mM phosphates) was stirred at room temperature for 22 hr. The reaction was then concentrated in vacuo and the crude material purified by RP-HPLC (Phenomenex, C-18, 5 μm, 250 × 10 mm) using an isocratic mixture (19:81) of ACN and aqueous NH4OAc buffer (0.1 M), to give 5 (11 mg, 17 mmol, 46%, based on 1, unoptimized, retention time 11.6 min) as an off-white amorphous solid.
4.10.1 Compound 5
(-) ESI-MS m/z: found 638.0592 (C21H29N5O9S2Br [M+H]+ calcd 638.0590). ESI-MSMS: supplementary data Figure S8. [α]D -22° (MeOH). IR ν (cm-1): 2800-3600, 1653, 1539. 1H NMR: see Table 3. 13C NMR: see Table 3.
4.11 Oxidative methanolysis of psammaplin A: synthesis of 6 and 7
To an ice cooled, stirred solution of psammaplin A (1, 4 mg, 6 μmol) in MeOH (10 mL) was added NBS (2.6 mg, 14.6 μmol), in MeOH (2.6 mL), over a period of two minutes. After 40 min the flask was allowed to warm to room temperature, and after another 40 min the reaction mixture was partitioned between methylene chloride (50 mL) and water (75 mL). The organic phase was separated and the aqueous phase twice more extracted with methylene chloride (2×50 mL). The combined methylene chloride extracts were concentrated in vacuo to give a crude mixture of two major products. HPLC purification of this material (Phenomenex, phenylhexyl, 5 μm, 250 × 10 mm, 4 mL/min, MeOH/H2O [60:40]) yielded the methyl sulfinate esters 6 (0.5 mg, 1.3 μmol, 11%, unoptimized, retention time 6.8 min) and 7 (0.8 mg, 1.7 μmol, 14%, retention time 10.5 min) as colorless amorphous solids.
4.11.1 Compound 6
(+) ESI-MS m/z: found 400.9785 (C12H15BrN2O5SNa [M+Na] calcd 400.9783). (+) FT-MS m/z: found 378.9963 (C12H16BrN2O5S [M+H]+ calcd 378.9963). IR ν (cm-1): 3000-3600, 1655, 1540, 1421, 1282, 1101, 982. 1H NMR (500 MHz, CD3OD) δ ppm: 7.35 (d, 2.0 Hz, H-9), 7.06 (dd, 2.0, 8.0 Hz, H-13), 6.75 (d, 2.0 Hz, H-12), 3.78 (s, H-7), 3.75 (s, OCH3), 3.62 (dt, 2.0, 6.5 Hz, H-3), 2.89-3.05 (m, H-2). 13C NMR (125 MHz, CD3OD) δ ppm: 165.9 (C-5), 153.8 (C-11), 153.0 (C-6), 134.5 (C-9), 130.6 (C-8), 130.4 (C-13), 117.0 (C-12), 110.5 (C-10), 57.4 (C-2), 55.7 (OCH3), 33.5 (C-3), 28.8 (C-7).
4.11.2 Compound 7
(+) ESI-MS m/z: found 478.8883 (C12H14Br2N2O5S [M+Na] calcd 478.8888). 1H NMR (500 MHz, CD3OD) δ ppm: 7.38 (s, H-9), 3.78 (s, H-7), 3.76 (s, OCH3), 3.64 (dt, 2.0, 6.0 Hz, H-3), 2.90-3.04 (m, H-2). 13C NMR (125 MHz, CD3OD) δ ppm: 165.8 (C-5), 152.6 (C-6), 151.1 (C-11), 134.1 (C-9), 132.2 (C-8), 112.2 (C-10), 57.4 (C-2), 55.7 (OCH3), 33.6 (C-3), 28.5 (C-7).
4.12 DFT calculations on structures 6 and 8
For each structure, a low energy conformer was identified by a MonteCarlo search using Ghemical 2.10. The low energy conformations were imported to Gaussian03,36 and each structure was subjected to a full geometry optimization using DFT/mpw 1pw91/6-311g(d,p). After geometry optimization, NMR calculations were performed using the GIAO method using DFT/mpw 1pw91/6-311g(d,p), which has been shown to provide reliable results for 13C calculations.34 All Gaussian calculations were performed at the Center for High Performance Computing at the University of Utah on an Opteron cluster. One node consisting of two 2.4 GHz dual-core Opteron processors and 7.2 Gb of memory was used for each calculation.
Supplementary Material
Acknowledgments
The authors thank Dr. Chad Nelson and Dr. Krishna Parsawar, from the University of Utah, Mass Spectrometry and Proteomics Core Facility, for recording the FT-MS spectra. An allocation of computer time from the Center for High Performance Computing at the University of Utah is gratefully acknowledged. The computational resources for this project have been provided by the National Institutes of Health (Grant # NCRR 1 S10 RR17214-01) on the Arches Metacluster, administered by the University of Utah Center for High Performance Computing. The following NIH and NSF grants funded NMR instrumentation, RR14768, RR06262, RR13030, DBI-0002806. This research was also supported by The Huntsman Cancer Institute, a University of Utah Seed Grant: Pharmacologic regulation of Wnt signaling (2006-2007), and by NIH grant CA 36622.
Footnotes
Publisher's Disclaimer: This is a PDF file of an unedited manuscript that has been accepted for publication. As a service to our customers we are providing this early version of the manuscript. The manuscript will undergo copyediting, typesetting, and review of the resulting proof before it is published in its final citable form. Please note that during the production process errors may be discovered which could affect the content, and all legal disclaimers that apply to the journal pertain.
Supplementary data associated with this article can be found, in the online version, at doi: XX
References and notes
- 1.Nusse R. Cell Res. 2005;15:28–32. doi: 10.1038/sj.cr.7290260. [DOI] [PubMed] [Google Scholar]
- 2.Coombs GS, Covey TM, Virshup DM. Curr. Drug Targets. 2008 doi: 10.2174/138945008784911796. In Press. [DOI] [PubMed] [Google Scholar]
- 3.Peng J, Li J, Hamann MT. In: The Alkaloids: Chemistry and Biology. Cordell GA, editor. Vol. 61. 2005. pp. 59–262. [DOI] [PMC free article] [PubMed] [Google Scholar]
- 4.Rodriguez AD, Akee RK, Scheuer PJ. Tetrahedron Lett. 1987;28:4989–4992. [Google Scholar]
- 5.Quinoa E, Crews P. Tetrahedron Lett. 1987;28:3229–3232. [Google Scholar]
- 6.Arabshahi L, Schmitz FJ. J. Org. Chem. 1987;52:3584–3586. [Google Scholar]
- 7.The majority of which are disulfide bonds, but these also include trisulfides, thiosulfinic esters, and thiocyanates.
- 8.Bugni TS, Richards B, Bhoite L, Cimbora D, Harper MK, Ireland CM. J. Nat. Prod. 2008 doi: 10.1021/np800184g. Submitted. [DOI] [PMC free article] [PubMed] [Google Scholar]
- 9.Knapp S, Amorelli B, Darout E, Ventocilla CC, Goldman LM, Huhn RA, Minnihan EC. J. Carbohydr. Chem. 2005;24:103–130. [Google Scholar]
- 10.Pina IC, Gautschi JT, Wang G-Y-S, Sanders ML, Schmitz FJ, France D, Cornell-Kennon S, Sambucetti LC, Remiszewski SW, Perez LB, Bair KW, Crews P. J. Org. Chem. 2003;68:3866–3873. doi: 10.1021/jo034248t. [DOI] [PubMed] [Google Scholar]
- 11.Xu Q, Wang Y, Dabdoub A, Smallwood PM, Williams J, Woods C, Kelley MW, Jiang L, Tasman W, Zhang K, Nathans J. Cell. 2004;116:883–895. doi: 10.1016/s0092-8674(04)00216-8. [DOI] [PubMed] [Google Scholar]
- 12.Lam KS. Trends Microbiol. 2007;15:279–289. doi: 10.1016/j.tim.2007.04.001. [DOI] [PubMed] [Google Scholar]
- 13.Butler MS. J. Nat. Prod. 2004;67:2141–2153. doi: 10.1021/np040106y. [DOI] [PubMed] [Google Scholar]
- 14.Eldridge GR, Vervoort HC, Lee CM, Cremin PA, Williams CT, Hart SM, Goering MG, O'Neil-Johnson M, Zeng L. Anal. Chem. 2002;74:3963–3971. doi: 10.1021/ac025534s. [DOI] [PubMed] [Google Scholar]
- 15.Harvey AL. Curr. Opin. Chem. Biol. 2007;11:480–484. doi: 10.1016/j.cbpa.2007.08.012. [DOI] [PubMed] [Google Scholar]
- 16.Jimenez C, Crews P. Tetrahedron. 1991;47:2097–2102. [Google Scholar]
- 17.Park Y, Liu Y, Hong J, Lee C-O, Cho H, Kim D-K, Im KS, Jung JH. J. Nat. Prod. 2003;66:1495–1498. doi: 10.1021/np030162j. [DOI] [PubMed] [Google Scholar]
- 18.Richon VM, Emiliani S, Verdin E, Webb Y, Breslow R, Rifkind RA, Marks PA. Proc. Natl. Acad. Sci. 1998;95:3003–3007. doi: 10.1073/pnas.95.6.3003. [DOI] [PMC free article] [PubMed] [Google Scholar]
- 19.Yoshida M, Horinouchi S. Ann. N. Y. Acad. Sci. 1999;886:23–36. doi: 10.1111/j.1749-6632.1999.tb09397.x. [DOI] [PubMed] [Google Scholar]
- 20.Saito A, Yamashita T, Mariko Y, Nosaka Y, Tsuchiya K, Ando T, Suzuki T, Tsuruo T, Nakanishi O. Proc. Natl. Acad. Sci. 1999;96:4592–4597. doi: 10.1073/pnas.96.8.4592. [DOI] [PMC free article] [PubMed] [Google Scholar]
- 21.Buffered HPLC was necessary for adequate peak resolution.
- 22.Matsunaga S, Nogata Y, Fusetani N. J. Nat. Prod. 1998;61:663–666. doi: 10.1021/np9704866. [DOI] [PubMed] [Google Scholar]
- 23.Pham NB, Butler MS, Quinn RJ. J. Nat. Prod. 2000;63:393–395. doi: 10.1021/np990335y. [DOI] [PubMed] [Google Scholar]
- 24.Shin J, Lee HS, Seo Y, Rho JR, Cho KW, Paul VJ. Tetrahedron. 2000;56:9071–9077. [Google Scholar]
- 25.Nicolaou KC, Hughes R, Pfefferkorn JA, Barluenga S, Roecker AJ. Chem.—Eur. J. 2001;7:4280–4295. doi: 10.1002/1521-3765(20011001)7:19<4280::aid-chem4280>3.0.co;2-3. [DOI] [PubMed] [Google Scholar]
- 26.Gareau Y, Zamboni R, Wong AW. J. Org. Chem. 1993;58:1582–1585. [Google Scholar]
- 27.Falck JR, Sangras B, Capdevila JH. Bioorg. Med. Chem. 2007;15:1062–1066. doi: 10.1016/j.bmc.2006.10.022. [DOI] [PMC free article] [PubMed] [Google Scholar]
- 28.Raso V, Fehrmann C, Solan VC, Rosowsky A. Biochem. Biophys. Res. Commun. 1988;150:104–110. doi: 10.1016/0006-291x(88)90492-5. [DOI] [PubMed] [Google Scholar]
- 29.White KN, Konopelski JP. Org. Lett. 2005;7:4111–4112. doi: 10.1021/ol051441w. [DOI] [PubMed] [Google Scholar]
- 30.Brownbridge P, Jowett IC. Synthesis. 1988:252–254. [Google Scholar]
- 31.In this reference the carbon NMR data for 8 was referenced to the methanol peaks at ~47.7 ppm (supporting information, spectrum S9); our spectra were referenced to 49.15 pp.
- 32.These probably represent either C-O or C-N stretches, or overtone bands.
- 33.Pretsch E, Clerc T, Seibl J, Simon W. In: Tables of Spectral Data for Structure Determination of Organic Compounds. 2nd ed. Biemann K, editor. Springer-Verlag; Berlin: 1989. p. C181. [Google Scholar]
- 34.Migda W, Rys B. Magn. Reson. Chem. 2004;42:459–466. doi: 10.1002/mrc.1366. [DOI] [PubMed] [Google Scholar]
- 35.Pihlaja K, Ovcharenko V, Zakrzewski A, Gawinecki R. Rapid Commun. Mass Spectrom. 2000;14:1674–1676. doi: 10.1002/1097-0231(20000930)14:18<1674::AID-RCM81>3.0.CO;2-Z. [DOI] [PubMed] [Google Scholar]
- 36.Frisch MJ, G. W. T., Schlegel HB, Scuseria GE, Robb MA, J. R. C., Montgomery JA, Jr., Vreven T, Kudin KN, J. C. B., Millam JM, Iyengar SS, Tomasi J, Barone V, B. M., Cossi M, Scalmani G, Rega N, Petersson GA, H. N., Hada M, Ehara M, Toyota K, Fukuda R, J. H., Ishida M, Nakajima T, Honda Y, Kitao O, Nakai H, M. K., Li X, Knox JE, Hratchian HP, Cross JB, Bakken V, C. A., Jaramillo J, Gomperts R, Stratmann RE, Yazyev O, A. J. A., Cammi R, Pomelli C, Ochterski JW, Ayala PY, K. M., Voth GA, Salvador P, Dannenberg JJ, Zakrzewski VG, S. D., Daniels AD, Strain MC, Farkas O, D. K. M., Rabuck AD, Raghavachari K, Foresman JB, J. V. O., Cui Q, Baboul AG, Clifford S, Cioslowski J, B. B. S., Liu G, Liashenko A, Piskorz P, Komaromi I, R. L. M., Fox DJ, Keith T, Al-Laham MA, Peng CY, A. N., Challacombe M, Gill PMW, Johnson B, W. C., Wong MW, Gonzalez C, Pople JA. Gaussian 03, Revision D.01. Gaussian, Inc.; Wallingford CT: 2004. [Google Scholar]
Associated Data
This section collects any data citations, data availability statements, or supplementary materials included in this article.