

Abstract
Anticancer agents often cause bone marrow toxicity resulting in progressive anemia which may influence the therapeutic effects of erythropoietic-stimulating agents. The objective of this study was to develop a pharmacodynamic (PD) model to describe chemotherapy-induced anemia in rats. Anemia was induced in male Wistar rats with a single intravenous (i.v.) injection of 60 mg/kg carboplatin. Hematological responses including reticulocytes, red blood cells (RBC), hemoglobin, and endogenous rat erythropoietin (EPO) were measured for up to 4 weeks. A catenary, lifespan-based, indirect response model served as a basic PD model to represent erythroid cellular populations in the bone marrow and blood involved in erythropoiesis. The model assumed that actively proliferating progenitor cells in the bone marrow are sensitive to anti-cancer agents and subject to an irreversible removal process. The removal rate of the target cells is proportional to drug activity concentrations and the cell numbers. An additional RBC loss from the circulation resulting from thrombocytopenia was described by a first-order process. The turnover process of rat EPO and EPO-mediated feedback inhibition mechanism regulated by hemoglobin changes were incorporated. Reticulocyte counts decreased rapidly and reached a nadir by day 3 after administration of carboplatin and returned to the baseline by day 13. This was followed by a gradual increase and the rebound peak occurred at about day 15. The hemoglobin nadir was approximately 9 g/dl observed at about 11–13 days compared to its normal value of 13 g/dl and hemoglobin returned to the baseline by day 30. The increase in endogenous rat EPO mirrored inversely hemoglobin changes and the maximum increase was observed soon after the hemoglobin nadir. The carboplatin-treated rats exhibited progressive anemia. The proposed model adequately described the time course of hematological changes after carboplatin in rats and can be a useful tool to explore potential strategies for the management of anemia caused by chemotherapy.
Introduction
Up to 75% of patients with cancer suffer from anemia either as a result of the disease or the myelosuppressive effects of chemotherapy and/or radiation on the bone marrow [1]. Anemia and resulting fatigue is associated with a significant decrease in the quality of life (QOL) of patients and may limit the applicability and efficacy of anticancer drugs [2]. Alleviating anemia with erythropoietic agents such as recombinant human erythropoietin (rHuEPO) has clinically proven to improve the QOL of such patients [3].
Several clinical studies [4–6] have been conducted to gain insight into optimizing the dose and schedule of hematopoietic supports to improve management of chemotherapy-related anemia. In addition, the importance of baseline hemoglobin values at the start of erythropoietic therapy and the timing of erythropoietic treatment relative to application of chemotherapy have been recognized [1, 7, 8]. Murine or rodent anemia models following chemotherapeutic agents aid in evaluating effects of erythropoietic agents in various settings. These studies can be facilitated with development of mechanism-based models that can characterize the time course of progression of anemia. Pharmacodynamic (PD) models for neutropenia and thrombocytopenia have been developed [9–12]. The hematopoietic system is most realistically captured by cell lifespan models which have had only limited implementation to reflect myelosuppressive effects of drugs [12].
We used carboplatin to induce prolonged anemia in rats. Carboplatin is a second-generation platinum compound that is recommended for chemotherapy of ovarian, head and neck, and lung cancers [13]. It has antineoplastic activity profile similar to cisplatin, but possesses an improved toxicity profile for nephrotoxicity and ototoxicity that are dose-limiting for cisplatin. Instead, carboplatin has myelosuppression as a dose-limiting toxicity. It has been reported that patients treated with platinum combinations had a higher incidence of severe anemia [14]. The objective of this study was to develop a physiology-based PD model to describe progression of anemia caused by carboplatin in rats.
Methods and materials
Animals and experimental design
Male Wistar rats weighing 250–275 g were purchased from Charles River Laboratories, Inc. (Raleigh, NC). The animals were maintained in a room with a 12/12 h light/dark cycle and had free access to food and water. The animals were used after 1-week acclimation. All studies were approved by the Institutional Animal Care and Use Committee (IACUC) of the University at Buffalo.
Carboplatin (Sigma-Aldrich, St Louis, MO) was dissolved in sterile saline immediately before injection. A single dose of carboplatin (60 mg/kg) was administered intravenously to the rats (n = 15) via the tail vein on day 0. Control animals (n = 6) received saline only. Blood (100 μl) was drawn at various time points up to 34 days from the tail vein under isofluorane anesthesia (Abbott Laboratories, North Chicago, IL) and treated with EDTA for hematological measurements. Blood samples were collected based on an alternating schedule among three subgroups of five rats within the carboplatin-treated group.
A separate group of rats were prepared to determine endogenous rat EPO in response to carboplatin-induced anemia. Rats received a single i.v. dose of either 60 mg/kg of carboplatin (n = 9) or saline (n = 3) via the tail vein. The rats in the carboplatin group were divided into three subsets of three rats for sampling purpose and 150 μl of blood was drawn via tail vein at various time points from three rats in a rotating manner. Sampling time points included day 0, 3, 5, 7, 9, 11, 13, 15, 17, 19, 21, 24, and 27, and terminal samples at sacrifice. To prepare serum, whole blood was directly transferred into a tube that contains no anticoagulant and allowed to clot for 30 min. The clotted bloods were centrifuged at 5,000g for 15 min at 4°C. Serum was separated and stored at −20°C until assay.
Hematological analysis
Complete blood counts (CBC) including red blood cells (RBC), hemoglobin, mean corpuscular hemoglobin (MCH), platelet, and white blood cell (WBC) differentials, and reticulocytes were monitored. CBC was performed on a Cell-Dyn 1700 (Abbott Laboratories, Abbott Park, IL) and reticulocytes were counted by flow cytometry (FAC-SCalibur; BD Biosciences, Franklin Lakes, NJ) using thioazole orange stain (Retic-reagent; BD Biosciences). Detailed procedures for sample staining and data analysis are described elsewhere [15].
Endogenous rat EPO assay by ELISA
Serum concentrations of rat EPO were determined by enzyme-linked immunosorbent assay (ELISA) with a commercially available kit (Medac Diagnostika, Hamburg, Germany) with antibodies against human EPO, which cross-reacts with rat EPO. Serum concentrations of rat EPO were quantitated based on the standard curve generated by rHuEPO (1.25–160 mIU/ml). Serum samples required for each well was 25 μl and assay done in duplicate. Procedures followed manufacturer’s instructions.
PK/PD analysis
The carboplatin PK data in rats following single i.v. doses (5 and 30 mg/kg) were obtained from the literature [16] and fitted to a three-compartment model:
| (1) |
| (2) |
| (3) |
where CP represents plasma concentration of carboplatin, and A2 and A3 are amounts of carboplatin in peripheral tissue compartments, Vp is the volume of distribution for the central compartment, kel is a first-order elimination constant from the central compartment, and k12, k21, k13, and k31 are first-order intercompartmental rate constants. The initial conditions for Eqs. 1–3 are CP(0) = Dose/Vp, A2(0) = 0, and A3(0) = 0.
The cytotoxicity of carboplatin is known to be due to the reaction of an aquated form of carboplatin with DNA, resulting in platinum-DNA adducts that are responsible for the subsequent formation of interstrand cross-links which block DNA replication [17–19]. This reactive species (M) was described as formed from carboplatin with a first-order rate (kf) and eliminated by a first-order rate (km) from the body.
| (4) |
The PD model for carboplatin-induced anemia is shown in Fig. 1. The process of erythropoiesis was depicted by four-catenary cell compartments including erythroid progenitors (P1), erythroblasts (P2), reticulocytes (RET), and mature RBC (RBCM). The progenitor cells are continuously produced from the hematopoietic stem cells by a zero-order rate constant (k0). The cell loss from each cell compartment is controlled by their own lifespans indicated by TP1, TP2, TRET, and TRBC. EPO is the main regulator for erythropoiesis [S(t)] where Smax is the maximum stimulation of responses by EPO and SC50_Rat is the EPO concentration producing half maximum stimulation. The differential equations for each cell population are:
| (5) |
| (6) |
| (7) |
| (8) |
and the pharmacologic/physiologic function for EPO is:
| (9) |
Fig. 1.

The scheme of the PD model for carboplatin-induced anemia. Symbols are defined in Table 3
The erythroid progenitor cells and proerythroblasts have a high capacity for DNA synthesis, and thus they were considered to be the primary cellular target in the erythroid lineage. The cytotoxic metabolite (M) of carboplatin is assumed responsible for hematopoietic toxicity in bone marrow (Eq. 5) where an irreversible cell killing rate (k) is proportional to the concentration of M and number of progenitor cells (P1). In a normal condition without carboplatin, the production rate of the progenitor cells is equal to the conversion rate [20]. After exposure to carboplatin, however, some portion of the progenitor cells were removed before converting to erythroblasts (P2). Therefore the fraction of the cells that survived from bone marrow toxicity throughout TP1 and finally converted into erythroblasts should be considered to determine the conversion rate [12] in Eq. 5 as follows
| (10) |
where survival fraction for the progenitors (SFBM) is
| (11) |
Derivation for the survival fraction is provided by Krzyzanski and Jusko [12].
It is known that internal hemorrhage is caused by thrombocytopenia as a result of myelosuppressive effects of carboplatin [21]. In a similar manner, the survival fraction of RBC from internal hemorrhage (SFH) in Eq. 8 is derived as
| (12) |
It was assumed that internal loss of mature RBC is occurring by a first-order process (kh) only during the platelet nadir as indicated by TC in Eqs. 8 and 12, where TC = 1 during the platelet nadir, otherwise TC = 0.
The initial conditions for Eqs. 5–8 are defined by the steady-state values:
| (13a) |
| (13b) |
| (13c) |
| (13d) |
The baseline of reticulocyte (RET0) was used as the pre-dose value of reticulocytes and the baseline value of mature RBC was obtained by difference between RET0 and the observed RBC (RBC0) at predose.
Erythropoietin is endogenously released by a zero-order rate kEPO and degraded by a rate of kdeg. The production of EPO is regulated in response to the change in hemoglobin relative to its baseline in the circulation [(Hb0/Hb(t))γ], which reflects the feedback mechanism of erythropoiesis process
| (14) |
The EPO production rate was computed as a secondary parameter according to kEPO = kdeg·EPO0. In the absence of endogenous rat EPO, the baseline of each cell population at steady-state is expressed as a product of the production rate of the progenitors and cell mean lifespan (e.g., RET0 = k0·TRET) [20]. When endogenous EPO is present at steady-state, the baseline value of rat EPO (EPO0) is maintained and Eq. 9 becomes
| (15) |
Subsequently, the baseline equations for the four cell populations (Eqs. 5–8) can be written as
| (16a) |
| (16b) |
| (16c) |
| (16d) |
The production rate for the progenitor cells was estimated as a secondary parameter based on k0 = RET0/(TRET·S0·S0) by rearranging Eq. 16c.
The mean time profiles of rat EPO, reticulocytes, and RBC were simultaneously fitted to Eqs. 7–8 and 14. The observed RBC represents a sum of reticulocytes (RET) and mature RBC (RBCM). Then hemoglobin in the circulation was calculated from MCH and RBC [22].
| (17) |
Carboplatin PK parameters were fixed; however, the formation and elimination rates of M were estimated with PD model Eqs. 7–8 and 14.
Gradual increases in RBC and hemoglobin over time were observed in the control group and this was taken into consideration in characterization of their responses in the carboplatin-treated group. The overall increase in RBC baseline (RBCb) in the control animals was described by the Gompertz equation [23] as before [15]:
| (18) |
where ks is the growth constant, RBCss is the upper limit of RBC, and RBC0 is the value of the measured RBC count at the starting point. A change in MCH was not significant throughout the study period and thus MCH was considered to be constant (MCH0 = 21 pg/cell). Subsequently the expected hemoglobin values in the control rats can be obtained by a product of RBCb and MCH0 according to Eq. 17. The values of parameters related to the baseline characterization of RBC were fixed to previous estimates from our recent study [15] as listed in Table 1.
Table 1.
Parameters used to characterize hematological baselines
| Parameter (unit) | Definition | Value |
|---|---|---|
| ks (h−1) | Growth constant in Gompertz equation | 0.00103 |
| RBCss (×106 cells/μl) | Upper limit of RBC count | 7.84 |
| RBC0 (×106 cells/μl) | Initial value of RBC count | 6.13 |
| MCH0 (pg/cell) | Initial value of MCH | 21.0 |
| RET0 (×104 cells/μl) | Initial value of RET count | 25.01 |
All computer fittings were done using ADAPT II [24] with the maximum likelihood estimation method. The variance model used was:
| (19) |
where Vi is the variance of the ith data point, σ1 and σ2 are the variance model parameters, and Yi represents the ith model predicted value.
Results
Pharmacokinetics of carboplatin
Figure 2 shows the intact carboplatin concentrations in plasma ultrafiltrate following single i.v. doses of 5 and 30 mg/kg in rats as obtained from the literature [16]. The carboplatin PK profiles exhibited a polyexponential decline after i.v. bolus dosing and the mean data were well described by a three-compartment model. The expected time course of carboplatin concentrations at the i.v. dose of 60 mg/kg in rats was simulated based on the estimated PK parameters listed in Table 2. The Fig. 2 also shows the model-calculated profile of the active moiety, M.
Fig. 2.

Plasma concentration versus time profiles of carboplatin for doses of 5 (filled circle) and 30 mg/kg (open circle) following a single i.v. injection in rats. Solid lines represent model predicted concentrations obtained from simultaneous fitting to Eqs. 1–3. The broken line represent the expected time course of carboplatin at i.v. dose of 60 mg/kg based on the estimated PK parameters in Table 2. The dotted line is the simulated time profile of cytotoxic metabolite M following 60 mg/kg of carboplatin
Table 2.
Estimated pharmacokinetic parameters of carboplatin in rats
| Parameter (unit) | Definition | Estimate (CV %) |
|---|---|---|
| Vp (ml/kg) | Central volume of distribution | 148.4 (47) |
| k10 (h−1) | Elimination rate constant | 2.788 (43) |
| k12 (h−1) | Inter-compartmental rate constant | 0.074 (73) |
| k21 (h−1) | Inter-compartmental rate constant | 0.425 (40) |
| k13 (h−1) | Inter-compartmental rate constant | 4.194 (136) |
| k31 (h−1) | Inter-compartmental rate constant | 5.611 (55) |
Hematopoietic changes after carboplatin
Changes in reticulocytes, RBC, and hemoglobin in rats receiving placebo or carboplatin are presented in Fig. 3. In control animals, gradual increases in RBC and hemoglobin over time were observed as seen in our recent study [15] in relation to growth of the rats. After carboplatin administration, the reticulocyte counts started decreasing from day 1 and reached a nadir by day 3. The duration of the reticulocyte nadir was about 5 days on days 3–8. A subsequent increase in reticulocytes was followed by a profound rebound peak at around day 15. The RBC counts and hemoglobin concentrations in the carboplatin-treated animals showed a biphasic decline before their nadir at around day 11. The initial gradual decreases in RBC and hemoglobin continued until day 8, which was expected from the reduction in reticulocyte counts. Afterward, a more rapid drop in the nadir followed while the reticulocytes were already in the rising phase, suggesting that this second decline phase may not be related to the changes in reticulocytes and there may be an additional loss of RBC from the circulation. The hemoglobin nadir was about 9 g/dl, resulting in an approximately 30% decease from its normal baseline of 13 g/dl. The RBC and hemoglobin slowly returned to normal values by days 30–34.
Fig. 3.

Time course of reticulocytes (a), RBC (b), hemoglobin (c), and endogenous rat EPO (d) profiles after single i.v. administration of either saline (open circle) or 60 mg/kg carboplatin (filled circle) in rats at day 0. The symbols depict the observed variables (mean ± SD) and the lines are model predicted profiles. The hemoglobin concentrations were calculated according to Eq. 17
Endogenous rat EPO increased in response to hematotoxicity by carboplatin (Fig. 3d). The mean serum concentration of rat EPO at predose was 3.15 mIU/ml (1.71–8.71 mIU/ml), which is similar to the reported value (5.9 mIU/ml) measured by the same ELISA kit in Wistar rats [25]. No significant changes in rat EPO was observed in the control group throughout the study period. The hemoglobin nadir preceded the peak concentration of EPO. As shown in Fig. 3d, in carboplatin-treated rats, endogenous EPO gradually increased and peaked at around day 11–13, inversely changing with hemoglobin.
As carboplatin is myelosuppressive, platelet and WBC counts were also affected by carboplatin administration. Figure 4 displays the mean platelet and WBC counts over time in the control and treated animals. The pattern was similar to the reticulocytes. Carboplatin produced a severe thrombocytopenia and the platelet nadir occurring at day 8–11 was a more than 90% decrease from its normal baseline. The initiation and degree of platelet recovery was faster than those of RBC and hemoglobin. Modeling of such data would require measurement of thrombopoietin (TPO) [26], which was not done. The initial temporary increase observed in RBC, hemoglobin, and platelet during the first 3 days after carboplatin injection appeared to be due to weight loss of animals receiving carboplatin which showed a maximum decrease about 3% at day three postdosing.
Fig. 4.

Time course of platelet (a) and WBC (b) counts following single i.v. injection of either saline (open circle) or 60 mg/kg carboplatin (filled circle) in rats at day 0. The symbols represent the observed variables (mean ± SD)
Pharmacodynamic model for anemia from carboplatin
The series of cell differentiation steps from erythroid progenitor cells to mature erythrocytes were depicted by the lifespan-based indirect response model (Fig. 1). The model portrays that erythropoiesis is maintained by endogenous EPO and changes in hemoglobin in the circulation increase or decrease the production of EPO, resembling the regulation of the erythropoiesis process. The irreversible cytotoxic effect on the erythroid progenitor cells (P1) in bone marrow via the active species of carboplatin (M) was described by a linear killing rate constant (k). Nonlinear killing may be also possible, but the single dose application limited the identifiability of nonlinear parameters. It was assumed that the nadir of thrombocytopenia was responsible for the second phase of RBC decline as a result of internal hemorrhage and this was modeled by a first-order removal rate constant (kh) functioning only for days 8–11 in proportion to the number of RBC in circulation.
The model-predicted profiles after simultaneous fittings to reticulocyte and RBC counts and EPO concentrations are shown in Fig. 3. The proposed PD model adequately characterized progression of anemia and endogenous EPO changes caused by the single i.v. dose of carboplatin. Table 3 lists the estimated PD parameters. The values of cell lifespans in erythroid populations were taken from the previous study [15] and fixed during the modeling. The maximum stimulation of the production of the progenitor cell by EPO (Smax = 1.87) was assumed to be the same as obtained from PK/PD studies of rHuEPO in rats with a wide range of doses [15]. The estimated SC50 for the endogenous rat EPO was 35.1 mIU/ml, which is about 11-fold higher than the baseline value (3.15 mIU/ml). The elimination rate of EPO (kdeg) was estimated to be 0.235 h−1. The second-order killing rate constant on the progenitor cells was 0.158 h−1·ml/ng. The longer duration of the reticulocyte nadir was not described by carboplatin plasma concentrations which produced the reticulocyte nadir of about 1 day and earlier recovery of RBC than observed. The half-life of the reactive species of carboplatin is about 13 times longer than the parent compound (15 min) and use of M was able to capture 5 days of the reticulocyte nadir with lower value of reticulocytes. The coefficients of variation (CV%) for the PD parameter estimates could not be obtained from the present study.
Table 3.
The estimated pharmacodynamic parameters
| Parameter (unit) | Definition | Estimatea |
|---|---|---|
| k (h−1·ml/ng) | Second-order killing rate constant on P1 | 0.158 |
| kh (h−1) | First-order removal rate constant on RBCM | 0.00452 |
| γ | Power coefficient for feedback loop | 7.37 |
| kf (h−1) | First-order formation rate constant of M | 0.704 |
| km (h−1) | First-order elimination rate constant of M | 0.209 |
| Smax | Maximum stimulation of production of P1 | 1.87b |
| SC50_Rat (mIU/ml) | Rat EPO concentration for 50% stimulation | 35.1 |
| kdeg (h−1) | First-order elimination constant for rat EPO | 0.235 |
| TP1 (h) | Mean cell lifespan of P1 | 42.97b |
| TP2 (h) | Mean cell lifespan of P2 | 3.02b |
| TRET (h) | Mean cell lifespan of RET | 72.33b |
| TRBC (h) | Mean cell lifespan of RBC | 1,440b |
The computer program was unable to generate percent coefficient of variation (CV %) values
Fixed parameters
Discussion
Anticancer agents often cause bone marrow toxicity, resulting in anemia. A model describing the relationship between PK and anemia progression could not only enhance effective uses of chemotherapeutic agents, but also guide optimized management of such anemia with erythropoietic-stimulating agents. Since bone marrow cells that are sensitive to cytotoxic drugs include the responsive cells for erythropoietic agents, the therapeutic effects of rHuEPO are highly likely to be affected by chemotherapeutic agents. Thus, the characterization of time course of anemia may also provide insight into bone marrow activity after exposure to cytotoxic agents. In the present study, we developed a PD model to reflect chemotherapy-induced anemia in rats using carboplatin.
The platinum-containing compounds such as cisplatin and carboplatin exert their antineoplastic effects mainly by inhibiting DNA synthesis as a result of formation of DNA interstrand cross-links [17]. Carboplatin is less nephrotoxic, but fivefold more toxic to bone marrow than cisplatin. Carboplatin possesses an improved chemical stability in comparison with cisplatin due to slower conversion to reactive species, which also produces different toxicity profiles [13]. The formation of positively charged moieties of cisplatin or carboplatin is the mechanism by which the drugs are activated prior to binding to nucleophilic sites of DNA in vivo [18]. There was approximately a 110-fold difference in the in vitro activation rate of cisplatin and carboplatin, which matches well with their binding rate to DNA [17].
The PK of carboplatin is linear and often described by a polyexponential decline [27]. Compared to carboplatin, which is relatively short, the platinum–DNA adducts, a reactive form of carboplatin, are stable on the time scale of days to weeks [28, 29]. One study showed that the peak concentration of DNA adducts and the area under the DNA adduct vs. time curve were important predictors to response to carboplatin [30]. As such, the formation of the cytotoxic metabolite (M) in our model (Fig. 1) reflects the activation process of carboplatin in vivo and thus M was used as the cytotoxic moiety.
A single dose of 60 mg/kg carboplatin induced a moderate degree of anemia in rats (i.e., 30% decrease in hemoglobin). Besides suppression of erythropoietic activity in bone marrow, thrombocytopenia appeared to contribute to a significant loss of RBC. Siddik et al. [21] have demonstrated that 51Cr-labeled control red cells administered to rats which had received 60 mg/kg of carboplatin were substantially lost during development of thrombocytopenia. They showed that this excessive loss from circulation was due to internal hemorrhage, but was not related to an increase in susceptibility to cell lysis or reduction in survival time of RBC.
Typical profiles of myelosuppression consist of an initial delay, decline toward nadir, recovery phase, overshoot (rebound), and return to the baseline. Similar patterns were seen in reticulocytes, platelets, and WBC following carboplatin in rats. The initial delay is introduced due to the maturation time of intermediate cellular populations between the target cells sensitive to cytotoxic drugs and the measured cells in the circulation. The length of the delay is dependent on the transit time of those intermediate cells. Since the maturation time of erythroblasts is relatively short in rats as indicated by TP2 (3.02 h), the initial lag time was not clearly visualized in the reticulocyte data. The slope of the reticulocyte decline is mostly controlled by the reticulocyte lifespan and how fast the drug is acting on the progenitor cells [12]. If the cell killing process is relatively fast, then the time to the reticulocyte nadir minus the initial lag time, which was about 3 days, reflects the lifespan of reticulocytes and was found to be close to our value (72 h). Similar decline slopes and times to the reticulocyte nadir of 3 days were observed after radiation or cyclophosphamide in rats [31]. However, the duration of the reticulocyte nadir differs for various cytotoxic agents [31, 32]. The duration is mainly governed by the difference in lifespan of progenitors and reticulocytes and the extent of cytotoxic effect by the drug [12]. After irradiation, a single point nadir was observed at day 3 in rats [31]. In the case of carboplatin, the lengthy period of the reticulocyte nadir observed could be indicative of the long half-life of platinum adducts (Fig. 2). The slopes of returning curves were almost symmetric to the decline slopes of responses in most cases. The rebound phase usually seen in RBC or hemoglobin data was not obvious probably due to the long lifespan of RBC. However, it may be present in that the initiation of the recovery of RBC and hemoglobin was faster than would have occurred without this process.
In the current model, the hemoglobin ratio relative to its baseline with the power coefficient (γ) was directly used as a regulator for the negative feedback loop [10]. In the PD model for rHuEPO effects [15], an inhibitory Imax function was applied to describe the feedback inhibition on the progenitor cells by the subsequent increase in hemoglobin upon rHuEPO dosing. As such, in case of anemia, the stimulatory Smax function would be needed to accommodate the erythropoietic stimulation following hemoglobin reduction. However, the advantage of the use of the ratio is to allow the negative feedback regulation be controlled in either direction by an increase or decrease in hemoglobin with one parameter.
Addition of EPO concentration data reflects more complete natural recovery processes from anemia following carboplatin. It also allowed us to describe the EPO-mediated feedback regulation mechanism by which the erythropoiesis is regulated via EPO production in response to changes in hemoglobin in blood. However, caution should be noted in that the regulation of EPO is not always inversely proportional to its stimulus. Several studies showed that the high EPO production was not sustained but was followed by a rapid decline while animals were still anemic from phlebotomy [33] or under continued hypoxia [34–36], suggesting that other regulation processes may be involved. It was revealed that this early decline of EPO was not due to the increase in EPO consumption by the activated progenitor cells since a substantial reduction in EPO mRNA was also observed in kidney along with the EPO decline [34]. Nevertheless, if the stimuli last relatively long, then an addition of a functional adaptation mechanism should be considered [33].
The elimination rate constant of rat EPO (kdeg) estimated from our study was 0.235 h−1. Eckardt et al. [34] conducted a PK study of EPO in rats after i.v. injection of endogenous rat EPO obtained from hypoxic donor animals. It followed a biexponential decline and the estimated disappearance rate constant of rat EPO (0.37 ~ 0.23 h−1) was similar to ours. This biphasic pattern is consistent with the two-compartment PK model used for rHuEPO in rats [15]. Although the clearance of rHuEPO in rats was characterized by a combination of saturable and linear kinetics, the elimination of rat EPO was expressed only by a linear first-order rate constant. This was based on the fact that the concentration ranges of endogenous EPO observed in this study were relatively small compared to those of rHuEPO and thus likely within the linear range. The overall elimination of rHuEPO in rats at a low-dose linear condition (0.69 h−1) was slightly higher than the loss rate of rat EPO.
Operation of lifespan-based indirect response models with feedback regulation requires a numerical technique to implement model equations and often involves intense computational time in parameter estimations. Along with such computational intensity, use of data from a single dose application may have limited generation of the percent coefficient variability for parameters in the present analysis.
Frieberg et al. [9, 10] have developed a semiphysiological model for chemotherapy-related neutropenia in consideration of the cell maturation time associated with neutropoiesis that is described by multiple transit compartments with the same rate constant between each compartment. This approach has been widely applied to various anticancer agents [10, 37–39] since it is simple in nature to operate with minimum number of parameters while accounting for the time delay for onset of responses and rebound phase typically observed in myelosuppression profiles. A similar approach has been also applied to chemotherapy-related thrombocytopenia [40].
Animal models of chemotherapy-induced anemia were often utilized to investigate effective dosing regimens and schedules of erythropoietic agents for improved management of anemia [32, 41–43]. As described in the PD model scheme (Fig. 1), the target cell populations for rHuEPO are also sensitive to cytotoxic drugs. Thus the timing of rHuEPO administration relative to chemotherapy treatment may influence erythropoietic responses. Timing of intervention has been of clinical interest not only for rHuEPO but also for other hematopoietic growth factor such as TPO [44, 45] and granulocyte colony-stimulating factor (G-CSF) [46]. Figure 5 presents the simulated time course of progenitor cells (P1) in bone marrow following the carboplatin administration. Matsumoto et al. [32] evaluated schedule-dependent erythropoietic effects of rHuEPO in 5-FU or cisplatin-induced anemia in rats by dosing rHuEPO 7 days prior to or after administration of anticancer drugs. The study showed that application of rHuEPO before chemotherapy resulted in more effective hemoglobin increases. Based on our simulation shown in Fig. 5, it can be speculated that erythroid progenitor cells available to respond to rHuEPO would be very few after administration of chemotherapy.
Fig. 5.
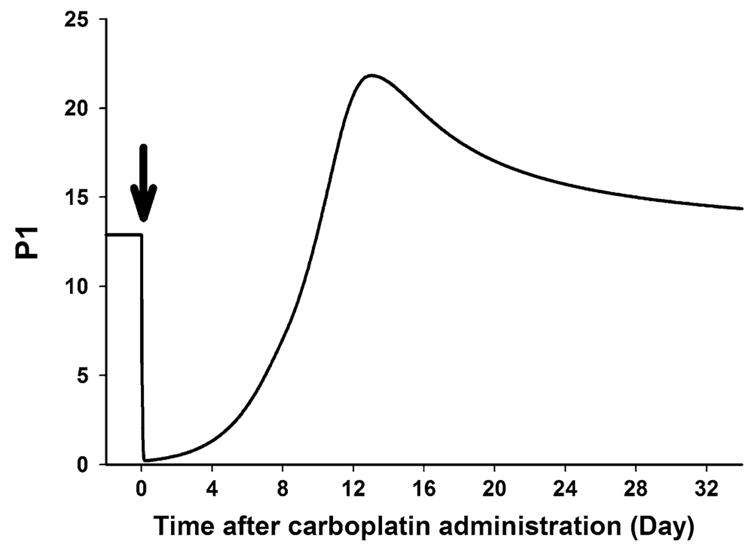
Simulated time profile of progenitor cell (P1) in bone marrow after single i.v. administration of carboplatin at day 0 (arrow)
The utility of our model is that it not only describes the entire time course of anemia after chemotherapy but also it is able to incorporate effects of erythropoietic agents. Since the present PD model shares a basic physiological model structure (i.e., erythropoiesis) with the PK/PD model for rHuEPO previously developed, once drug-related information such as PK and pharmacology (Smax and SC50_rHuEPO) parameters are added, the model can be utilized to test various dosing strategies of rHuEPO by simulating the expected hemoglobin responses in the anemic state.
While our PD model was developed based on the hematotoxic responses to carboplatin, it can be extended to other chemotherapeutic agents or different anemia models. Several methods have been used to induce anemia experimentally in preclinical animals, including phlebotomy or use of hemolytic agents such as phenylhydrazine (PHZ) [47–49]. The onset of physiological responses to blood loss or hemolysis is fast since a rapid drop in RBC and hemoglobin follows, and their recovery is relatively rapid as well because of intact bone marrow functions in those animals. Removal of the cell killing process from bone marrow (k = 0) from our model may characterize anemia associated with phlebotomy or hemolysis. In contrast to carboplatin, it was shown that EPO elevation did not occur after cisplatin administration [32, 50], suggesting that nephrotoxicity may be in part responsible for cisplatin-induced anemia via a reduced production of EPO. Thus, in the case of cisplatin-induced anemia, an inhibition process on the EPO synthesis (kEPO) by the cytotoxic metabolite can be included.
There are homeostatic changes during chronic administration of chemotherapeutic agents. Whether these can be captured in animal model remains to be studied. Hartley et al. [41] have shown accumulation of hematotoxicity after repeated exposures to carboplatin and radiation using a mouse model. While our PD model was adequate to describe single-cycle chemotherapy-induced anemia, it would require evaluating if the model can reflect anemia progression after multi-cycle chemotherapy. In case of myelosuppressive agents producing both anemia and thrombocytopenia, joint fittings with platelet and erythroid profiles would be desired since thrombocytopenia is associated with a cause of anemia as a result of hemorrhage.
In conclusion, a physiology-based mechanistic model for chemotherapy-induced anemia has been developed based on application of carboplatin in rats. Animal and mathematical models may be helpful to describe the time course of anemia from chemotherapy and to further assess optimization of erythropoietic treatment of such anemia.
References
- 1.Henry DH. The evolving role of epoetin alfa in cancer therapy. Oncologist. 2004;9:97–107. doi: 10.1634/theoncologist.9-1-97. [DOI] [PubMed] [Google Scholar]
- 2.Cella D, Dobrez D, Glaspy J. Control of cancer-related anemia with erythropoietic agents: a review of evidence for improved quality of life and clinical outcomes. Ann Oncol. 2003;14:511–519. doi: 10.1093/annonc/mdg167. [DOI] [PubMed] [Google Scholar]
- 3.Cella D, Zagari MJ, Vandoros C, Gagnon DD, Hurtz H-J, Nortier JWR. Epoetin alfa treatment results in clinically significant improvements in quality of life in anemic cancer patients when referenced to the general population. J Clin Oncol. 2003;21:366–373. doi: 10.1200/JCO.2003.02.136. [DOI] [PubMed] [Google Scholar]
- 4.Gabrilove JL, Cleeland CS, Livingston RB, Sarokhan B, Winer E, Einhorn LH. Clinical evaluation of once-weekly dosing of epoetin alfa in chemotherapy patients: improvements in hemoglobin and quality of life are similar to three-times-weekly dosing. J Clin Oncol. 2001;19:2875–2882. doi: 10.1200/JCO.2001.19.11.2875. [DOI] [PubMed] [Google Scholar]
- 5.Patton J, Kuzur M, Liggett W, Miranda F, Varsos H, Porter L. Epoetin alfa 60,000 U once weekly followed by 120,000 U every 3 weeks increases and maintains hemoglobin levels in anemic cancer patients undergoing chemotherapy. Oncologist. 2004;9:90–96. [PubMed] [Google Scholar]
- 6.Patton J, Reeves T, Wallace J. Effectiveness of darbepoetin alfa versus epoetin alfa in patients with chemotherapy-induced anemia treated in clinical practice. Oncologist. 2004;9:451–458. doi: 10.1634/theoncologist.9-4-451. [DOI] [PubMed] [Google Scholar]
- 7.Savonije JH, van Groeningen CJ, Wormhoudt LW, Giaccone G. Early intervention with epoetin alfa during platinum-based chemotherapy: an analysis of the results of a multicenter, randomized, controlled trial based on initial hemoglobin level. Oncologist. 2006;11:206–216. doi: 10.1634/theoncologist.11-2-206. [DOI] [PubMed] [Google Scholar]
- 8.Rizzo JD, Lichtin AE, Woolf SH, Seidenfeld J, Bennett CL, Cella D, Djulbegovic B, Goode MJ, Jakubowski AA, Lee SJ, Miller CB, Rarick MU, Regan DH, Browman GP, Gordon MS. Use of epoetin in patients with cancer: evidence-based clinical practice guidelines of the American Society of Clinical Oncology and the American Society of Hematology. J Clin Oncol. 2002;20:4083–4107. doi: 10.1200/JCO.2002.07.177. [DOI] [PubMed] [Google Scholar]
- 9.Friberg LE, Freijs A, Sandstrom M, Karlsson MO. Semi-physiological model for the time course of leukocytes after varying schedules of 5-fluorouracil in rats. J Pharmacol Exp Ther. 2000;295:734–40. [PubMed] [Google Scholar]
- 10.Friberg LE, Henningsson A, Maas H, Nguyen L, Karlsson MO. Model of chemotherapy-induced myelosuppression with parameter consistency across drugs. J Clin Oncol. 2002;20:4713–4721. doi: 10.1200/JCO.2002.02.140. [DOI] [PubMed] [Google Scholar]
- 11.Minami H, Sasaki Y, Saijo N, Ohtsu T, Fujii H, Igarashi T, Itoh K. Indirect-response model for the time course of leukopenia with anticancer drugs. Clin Pharmacol Ther. 1998;64:511–521. doi: 10.1016/S0009-9236(98)90134-5. [DOI] [PubMed] [Google Scholar]
- 12.Krzyzanski W, Jusko WJ. Multiple-pool cell lifespan model of hematologic effects of anticancer agents. J Pharmacokinet Pharmacodyn. 2002;29:311–337. doi: 10.1023/a:1020984823092. [DOI] [PubMed] [Google Scholar]
- 13.Go RS, Adjei AA. Review of the comparative pharmacology and clinical activity of cisplatin and carboplatin. J Clin Oncol. 1999;17:409. doi: 10.1200/JCO.1999.17.1.409. [DOI] [PubMed] [Google Scholar]
- 14.Tas F, Eralp Y, Basaran M, Sakar B, Alici S, Argon A, Bulutlar G, Camlica H, Aydiner A, Topuz E. Anemia in oncology practice: relation to diseases and their therapies. Am J Clin Oncol. 2002;25:371–379. doi: 10.1097/00000421-200208000-00011. [DOI] [PubMed] [Google Scholar]
- 15.Woo S, Krzyzanski W, Jusko WJ. Pharmacokinetic and pharmacodynamic modeling of recombinant human erythropoietin after intravenous and subcutaneous administration in rats. J Pharmacol Exp Ther. 2006;319:1297–1306. doi: 10.1124/jpet.106.111377. [DOI] [PubMed] [Google Scholar]
- 16.Guo P, Li S, Gallo JM. Determination of carboplatin in plasma and tumor by high-performance liquid chromatography-mass spectrometry. J Chromatogr B. 2003;783:43–52. doi: 10.1016/s1570-0232(02)00489-0. [DOI] [PubMed] [Google Scholar]
- 17.Knox RJ, Friedlos F, Lydall DA, Roberts JJ. Mechanism of cytotoxicity of anticancer platinum drugs: evidence that cis-diamminedichloro-platinum(II) and cis-diammine-(1,1-cyclo-butanedicarboxylato) platinum(II) differ only in the kinetics of their interaction with DNA. Cancer Res. 1986;46:1972–1979. [PubMed] [Google Scholar]
- 18.Schmalbach TK, Borch RF. Diethyldithiocarbamate modulation of murine bone marrow toxicity induced by cis-diammine (cyclobutanedicarboxylato) platinum (II) Cancer Res. 1989;49:6629–6633. [PubMed] [Google Scholar]
- 19.Boulikas T, Vougiouka M. Cisplatin and platinum drugs at the molecular level. Oncol Rep. 2003;10:1663–1682. (Review) [PubMed] [Google Scholar]
- 20.Krzyzanski W, Ramakrishnan R, Jusko WJ. Basic pharmacodynamic models for agents that alter production of natural cells. J Pharmacokinet Biopharm. 1999;27:467–489. doi: 10.1023/a:1023249813106. [DOI] [PubMed] [Google Scholar]
- 21.Siddik ZH, Boxall FE, Harrap KR. Haematological toxicity of carboplatin in rats. Br J Cancer. 1987;55:375–379. doi: 10.1038/bjc.1987.75. [DOI] [PMC free article] [PubMed] [Google Scholar]
- 22.Wintrobe MM. Wintrobe’s clinical hematology. Lippincott Williams & Wilkins; Philadelphia: 2003. [Google Scholar]
- 23.Laird AK. Dynamics of tumor growth. Br J Cancer. 1964;13:490–502. doi: 10.1038/bjc.1964.55. [DOI] [PMC free article] [PubMed] [Google Scholar]
- 24.D’Argenio DZ, Schumitzky A. ADAPT II user’s guide: pharmacokinetic/pharmacodynamic system analysis software. Biomedical Simulations Resource; Los Angeles: 1997. [Google Scholar]
- 25.Zhang Y, Andrews MC, Schyvens CG, McKenzie KU, Whitworth JA. Adrenocorticotropic hormone, blood pressure, and serum erythropoietin concentrations in the rat. Am J Hypertens. 2004;17:457–461. doi: 10.1016/j.amjhyper.2004.01.004. [DOI] [PubMed] [Google Scholar]
- 26.Bernstein SH, Jusko WJ, Krzyzanski W, Nichol J, Wetzler M. Pharmacodynamic modeling of thrombopoietin, platelet, and megakaryocyte dynamics in patients with acute myeloid leukemia undergoing dose intensive chemotherapy. J Clin Pharmacol. 2002;42:501–511. doi: 10.1177/00912700222011553. [DOI] [PubMed] [Google Scholar]
- 27.Desoize B, Madoulet C. Particular aspects of platinum compounds used at present in cancer treatment. Crit Rev Oncol Hematol. 2002;42:317–325. doi: 10.1016/s1040-8428(01)00219-0. [DOI] [PubMed] [Google Scholar]
- 28.Davies MS, Berners-Price SJ, Hambley TW. Slowing of cisplatin aquation in the presence of DNA but not in the presence of phosphate: improved understanding of sequence selectivity and the roles of monoaquated and diaquated species in the binding of cisplatin to DNA. Inorg Chem. 2000;39:5603–5613. doi: 10.1021/ic000847w. [DOI] [PubMed] [Google Scholar]
- 29.van der Vijgh WJ. Clinical pharmacokinetics of carboplatin. Clin Pharmacokinet. 1991;21:242–261. doi: 10.2165/00003088-199121040-00002. [DOI] [PubMed] [Google Scholar]
- 30.O’Dwyer PJ, Stevenson JP, Johnson SW. Clinical pharmacokinetics and administration of established platinum drugs. Drugs. 2000;59:19–27. doi: 10.2165/00003495-200059004-00003. [DOI] [PubMed] [Google Scholar]
- 31.Tanke HJ, van Vianen PH, Emiliani FM, Neuteboom I, de Vogel N, Tates AD, de Bruijn EA, van Oosterom AT. Changes in erythropoiesis due to radiation or chemotherapy as studied by flow cytometric determination of peripheral blood reticulocytes. Histochemistry. 1986;84:544–548. doi: 10.1007/BF00482989. [DOI] [PubMed] [Google Scholar]
- 32.Matsumoto T, Endoh K, Kamisango K, Akamatsu K, Koizumi K, Higuchi M, Imai N, Mitsui H, Kawaguchi T. Effect of recombinant human erythropoietin on anticancer drug-induced anaemia. Br J Haematol. 1990;75:463–468. doi: 10.1111/j.1365-2141.1990.tb07783.x. [DOI] [PubMed] [Google Scholar]
- 33.Al-Huniti NH, Widness JA, Schmidt RL, Veng-Pedersen P. Pharmacokinetic/pharmacodynamic analysis of paradoxal regulation of erythropoietin production in acute anemia. J Pharmacol Exp Ther. 2004;310:202–208. doi: 10.1124/jpet.104.066027. [DOI] [PubMed] [Google Scholar]
- 34.Eckardt K-U, Dittmer J, Neumann R, Bauer C, Kurtz A. Decline of erythropoietin formation at continuous hypoxia is not due to feedback inhibition. Am J Physiol. 1990;258:F1432–F1437. doi: 10.1152/ajprenal.1990.258.5.F1432. [DOI] [PubMed] [Google Scholar]
- 35.Jelkmann W. Temporal pattern of erythropoietin titers in kidney tissue during hypoxic hypoxia. Pflugers Arch. 1982;393:88–91. doi: 10.1007/BF00582397. [DOI] [PubMed] [Google Scholar]
- 36.Abbrecht PH, Littell JK. Plasma erythropoietin in men and mice during acclimatization to different altitudes. J Appl Physiol. 1972;32:54–58. doi: 10.1152/jappl.1972.32.1.54. [DOI] [PubMed] [Google Scholar]
- 37.Kloft C, Wallin J, Henningsson A, Chatelut E, Karlsson MO. Population pharmacokinetic-pharmacodynamic model for neutropenia with patient subgroup identification: comparison across anticancer drugs. Clin Cancer Res. 2006;12:5481–5490. doi: 10.1158/1078-0432.CCR-06-0815. [DOI] [PubMed] [Google Scholar]
- 38.Leger F, Loos WJ, Bugat R, Mathijssen RH, Goffinet M, Verweij J, Sparreboom A, Chatelut E. Mechanism-based models for topotecan-induced neutropenia. Clin Pharmacol Ther. 2004;76:567–578. doi: 10.1016/j.clpt.2004.08.008. [DOI] [PubMed] [Google Scholar]
- 39.Latz JE, Karlsson MO, Rusthoven JJ, Ghosh A, Johnson RD. A semimechanistic-physiologic population pharmacokinetic/pharmacodynamic model for neutropenia following pemetrexed therapy. Cancer Chemother Pharmacol. 2006;57:412–426. doi: 10.1007/s00280-005-0077-5. [DOI] [PubMed] [Google Scholar]
- 40.van Kesteren C, Zandvliet AS, Karlsson MO, Mathot RA, Punt CJ, Armand JP, Raymond E, Huitema AD, Dittrich C, Dumez H, Roche HH, Droz JP, Ravic M, Yule SM, Wanders J, Beijnen JH, Fumoleau P, Schellens JH. Semi-physiological model describing the hematological toxicity of the anti-cancer agent indisulam. Invest New Drugs. 2005;23:225–234. doi: 10.1007/s10637-005-6730-3. [DOI] [PubMed] [Google Scholar]
- 41.Hartley C, Elliott S, Begley CG, McElroy P, Sutherland W, Khaja R, Heatherington AC, Graves T, Schultz H, Del Castillo J, Molineux G. Kinetics of haematopoietic recovery after dose-intensive chemo/radiotherapy in mice: optimized erythroid support with darbepoetin alpha. Br J Haematol. 2003;122:623–636. doi: 10.1046/j.1365-2141.2003.04467.x. [DOI] [PubMed] [Google Scholar]
- 42.Thews O, Kelleher DK, Vaupel P. Erythropoietin restores the anemia-induced reduction in cyclophosphamide cytotoxicity in rat tumors. Cancer Res. 2001;61:1358–1361. [PubMed] [Google Scholar]
- 43.Thews O, Koenig R, Kelleher DK, Kutzner J, Vaupel P. Enhanced radiosensitivity in experimental tumours following erythropoietin treatment of chemotherapy-induced anaemia. Br J Cancer. 1998;78:752–756. doi: 10.1038/bjc.1998.572. [DOI] [PMC free article] [PubMed] [Google Scholar]
- 44.Skomorovski K, Harpak H, Ianovski A, Vardi M, Visser TP, Hartong SC, van Vliet HH, Wagemaker G, Agur Z. New TPO treatment schedules of increased safety and efficacy: preclinical validation of a thrombopoiesis simulation model. Br J Haematol. 2003;123:683–691. doi: 10.1046/j.1365-2141.2003.04696.x. [DOI] [PubMed] [Google Scholar]
- 45.Stefanich EG, Carlson-Zermeno CC, McEvoy K, Reich M, Fielder PJ. Dose schedule of recombinant murine thrombopoietin prior to myelosuppressive and myeloablative therapy in mice. Cancer Chemother Pharmacol. 2001;47:70–77. doi: 10.1007/s002800000203. [DOI] [PubMed] [Google Scholar]
- 46.Ron IG, Peleg L, Rienstein S, Dotan A, Ticher A, Wolfson S, Ashkenazi IE. Time dependency of hematopoietic growth factor coupled to chronotoxicity of carboplatin. Cancer Chemother Pharmacol. 1998;42:135–141. doi: 10.1007/s002800050796. [DOI] [PubMed] [Google Scholar]
- 47.Criswell KA, Sulkanen AP, Hochbaum AF, Bleavins MR. Effects of phenylhydrazine or phlebotomy on peripheral blood, bone marrow and erythropoietin in Wistar rats. J Appl Toxicol. 2000;20:25–34. doi: 10.1002/(sici)1099-1263(200001/02)20:1<25::aid-jat624>3.0.co;2-7. [DOI] [PubMed] [Google Scholar]
- 48.Chapel SH, Veng-Pedersen P, Schmidt RL, Widness JA. A pharmacodynamic analysis of erythropoietin-stimulated reticulocyte response in phlebotomized sheep. J Pharmacol Exp Ther. 2000;295:346–351. [PubMed] [Google Scholar]
- 49.Redondo PA, Alvarez AI, Diez C, Fernandez-Rojo F, Prieto JG. Physiological response to experimentally induced anemia in rats: a comparative study. Lab Anim Sci. 1995;45:578–583. [PubMed] [Google Scholar]
- 50.Unami A, Nishina N, Terai T, Sato S, Tamura T, Noda K, Mine Y. Effects of cisplatin on erythropoietin production in rats. J Toxicol Sci. 1996;21:157–165. doi: 10.2131/jts.21.3_157. [DOI] [PubMed] [Google Scholar]