Abstract
The annulus fibrosus (AF) of the intervertebral disc (IVD) exhibits a fiber-organized structure which is responsible for anisotropic and inhomogeneous mechanical and transport properties. Due to its particular morphology, nutrient transport within AF is regulated by complex transport kinetics. This work investigates the diffusive transport of a small solute in the posterior and anterior regions of AF since diffusion is the major transport mechanism for low molecular weight nutrients (e.g., oxygen and glucose) in IVD.
Diffusion coefficient (D) of fluorescein (332 Da) in bovine coccygeal AF was measured in the three major (axial, circumferential and radial) directions of the IVD by means of Fluorescence Recovery After Photobleaching (FRAP) technique. It was found that the diffusion coefficient was anisotropic and inhomogeneous. In both anterior and posterior regions, the diffusion coefficient in the radial direction was found to be lowest. Circumferential and axial diffusion coefficients were not significantly different in both posterior and anterior regions and their values were about 130% and 150% the value of the radial diffusion coefficient, respectively. The values of diffusion coefficients in the anterior region were in general higher than those of corresponding diffusion coefficients in the posterior region.
This study represents the first quantitative analysis of anisotropic diffusion transport in AF by means of FRAP technique and provides additional knowledge on understanding the pathways of nutritional supply into IVD.
Keywords: Confocal Laser Scanning Microscopy (CLSM), Spatial Fourier Analysis (SFA), Nutritional Pathways, Intervertebral Disc (IVD
INTRODUCTION
Intervertebral disc (IVD) is a complex cartilaginous structure consisting of gel-like material in the center (the nucleus pulposus), surrounded by concentric lamellar layers, i.e., the annulus fibrosus (AF). This structure, responsible for the biomechanical behavior of IVD, is synthesized and maintained by the cells present in the extracellular matrix of the disc.20 Thus, it is crucial for the cells within the tissue to have adequate nutrient supply in order to maintain the health of the disc.12,17,35,48 The IVD is the largest avascular structure of the human body and the supply of nutrients to disc cells is provided by the blood vessels in the surrounding tissues, through cartilage endplate route and periannular route.3,24,36,49,51 The distance of its cells from the nearest blood vessel can be up to 8 mm,7,45 and diffusion is the major mechanism for the transport of nutrients (e.g., glucose and oxygen) in IVD.48
Poor nutritional supply is believed to be one of the mechanisms for disc degeneration.8,25,26,35,48,50 However, relatively little is known on the nutrition transport and levels within the IVD, even though many studies have been done experimentally and theoretically. For examples, investigators have used quantitative mathematical models and finite element methods to study the mechanisms and pathways of nutrient transport into the disc.18,40,42,53,54 In these numerical studies, however, the diffusion of solutes in AF was assumed to be isotropic.
It is well known that the morphology of AF is characterized by concentric lamellar layers. Adjacent lamellae are composed by collagen fiber bundles inclined, with respect to the vertical axis of the spine, with angles varying from ±62 to ±45 degrees.13 This peculiar structure is responsible for an anisotropic behavior of AF observed in experiments, such as mechanical stiffness,16,19 hydraulic permeability,22 water diffusion15,27,36 and electrical conductivity.29
Thus, it is reasonable to hypothesize that the diffusion of solutes within the AF is anisotropic. As a first order approximation, in the present study, the diffusion tensor in AF is assumed to be orthotropic, with three principal directions along the axial, circumferential and radial directions of disc. The objective of this study was to experimentally determine the anisotropic diffusion tensor (D) of a relatively small solute (fluorescein, molecular weight: 332 Da) in AF using a fluorescent recovery after photobleaching (FRAP) technique.
FRAP has been extensively used to determine diffusion of macromolecules within tissues.5,6,14,31,33,39,43 The basic principle of FRAP is based on photobleaching the fluorescence of molecular probes and analysis of the recovery of the bleached area.2,30,38
In performing a FRAP test in the case of two-dimensional (2D) diffusion (e.g., translational mobility of molecules in membranes34 or polymeric films47), a common approach for calculating diffusion coefficient of fluorescent probes by video-FRAP technique is based on the transformation of the 2D mass transport field equation into the Fourier space by performing a Spatial Fourier Analysis (SFA).5,6,39,41,46 With respect to other methods for isotropic2 or anisotropic44,32 2D diffusion cases, the advantage of using a video-FRAP SFA approach is that the analysis is independent from the initial conditions of the bleached spot of the sample. On the other hand, when FRAP is performed in the case of 3D diffusion, fluorescent probe transport occurs in the plane of bleaching as well as in the direction orthogonal to this plane (z-direction). While several analytical and numerical models for 3D FRAP tests with Confocal Laser Scanning Microscope (CLSM) have been proposed for the case of isotropic diffusion,9,10,11 an extension of the SFA approach to the 3D case has not been developed yet, due to the difficulty in collecting 3D images of fluorescence recovery in real time.
In this work we propose an extension of the use of 2D SFA to the 3D diffusion case by combining the Fourier transformation approach with a multilayer bleaching (MLB) testing protocol. The basic principle of MLB consists of sequentially bleaching the sample over several layers parallel to the plane in which the fluorescence recovery is observed. Theoretically, if MLB is performed over the whole thickness of the sample, fluorescence recovery within the plane of interest could be two-dimensional. In practice only a limited number of sample layers can be sequentially bleached before fluorescence recovery occurs in the earlier bleached planes, therefore the diffusion is three-dimensional and the use of a 2D SFA approach leads to an overestimation of the diffusion coefficient. However, by optimizing the number and the size of the bleached layers, it is possible to minimize and the error in the estimation of the diffusion tensor (see Appendix).
In the following, a new approach for determining 3D anisotropic diffusion tensor using video-SFA and MLB protocol will be described. It will be illustrated that, from three independent FRAP tests performed in the three principal planes of the IVD, it is possible to extract the three principal components of the anisotropic diffusion tensor of AF. The results are compared to those in the literature and correlated to the anisotropic structure of the tissue.
THEORETICAL BACKGROUND
When MLB protocol is applied in FRAP test, diffusion of fluorescent probes in a bulk sample could be assumed to be confined within the focal plane of the microscope objective, see Appendix. Under the assumptions that diffusion is 2D and orthotropic, the field equation for solute concentration (c) within a medium can be obtained based on the conservation of mass and Fick's law:
| (1) |
where (x,y) are the coordinates of the imaging system within the focal plan, Dxx, Dxy and Dyy are components of diffusion coefficient tensor (D) in the (x,y) coordinate system. In arriving at Equation (1), the diffusion tensor is assumed to be constant with respect to time (t) and position (x,y) within the focal plane (∼460 × 460 μm2, see Material and Methods below). At the boundaries the concentration c(x,y,t) is constant. For an arbitrary initial condition Equation (1) can be solved using two dimensional SFA:41,46
| (2) |
In Equation (2), C(u,v,t) is the Fourier transform of c(x,y,t), defined as:
| (3) |
and
| (4) |
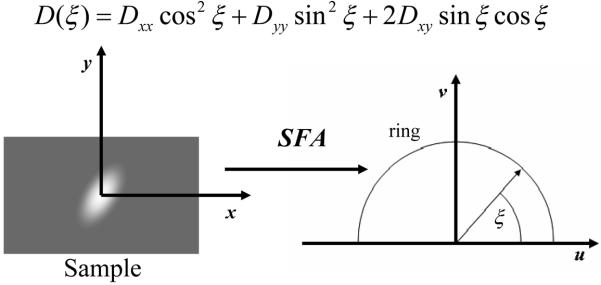
where the angle ξ is defined by the wave vector specified by u and v, and the positive u-axis (Figure 1):
| (5) |
Figure 1.
Transformation of a video-FRAP image into the frequency space using Spatial Fourier Analysis (SFA).
For a given interval of time [t1, t2], from Equation (2), the following relationship is obtained:
| (6) |
Curve-fitting of experimental data with Equation (6), one can obtain D(ξ) which depends on the choice of the frequencies u and v (or ξ), see Equation (4). For this orthotropic diffusion case, it can be shown that the mean value of D(ξ) [averaged over the entire frequency space (u,v)] is given as follows:
| (7) |
Equation (7) indicates that only the values of D(ξ) of the ‘ring’ [i.e., an arch of circumference with u2+v2 = constant in the (u,v) space, see Figure 1] are needed in order to evaluate Dav, which is similar to the isotropic case.46 By use of Equation (4), the solution of the above Equation (7) yields:
| (8) |
Since the sum (Dxx + Dyy) is the trace of the diffusion tensor, it follows that the value of Dav is equal to the averaged value of two diffusion coefficients in the principal directions (within the focal plane with surface normal in the z-direction). By measuring Dav in the three principal planes, one can determine the three diffusion coefficients in the principal directions. Note that for an isotropic case where Dxx = Dyy = D, Equation (8) recovers that Dav = D. Here D is a constant (independent of ξ). However, it is a common practice to average D over a range of [0,π/2] in order to reduce the noise and to improve the accuracy.46 For an anisotropic case, it is possible to obtain the value of Dxx or Dyy individually by choosing special frequency couples along the axes of the Fourier space, namely (u,0) and (0,v),46 see Equation (4). In the present study, the averaged diffusion coefficient is obtained by Equation (7) and individual components of diffusion tensor are obtained by use of Equation (8), see Materials and Methods below.
MATERIALS AND METHODS
Specimens Preparation
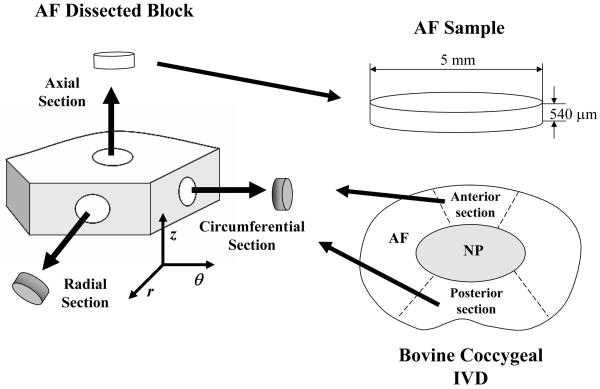
Nine discs (S2-3 and S3-4) were harvested from five bovine coccygeal spines obtained from a local supermarket, wrapped in plastic (in order to prevent dehydration) and stored at −20°C. Within a week, the specimens were partially thawed at room temperature and AF blocks were excised from the anterior and posterior regions of each disc in its three principal directions: axial, circumferential and radial, respectively, see Figure 2. From each AF block four cylindrical specimens of 5 mm diameter and 540 μm thickness were obtained using a microtome (SM24000, Leica Microsystems GmbH, Wetzlar, Germany) with a freezing stage (Model BFS-30, Physitemp, Clifton, NJ).
Figure 2.
Schematic of specimen preparation. The size and orientation of test specimens are shown.
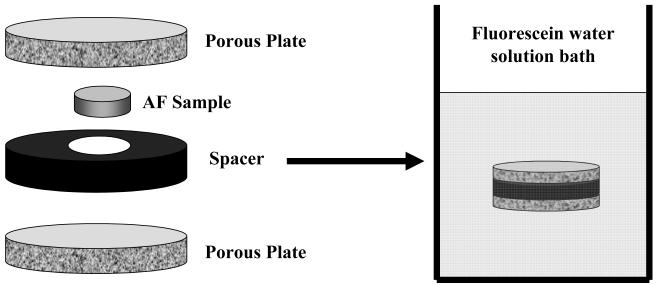
Cylindrical specimens were equilibrated in a fluorescein (332 Da, λex 490 nm; λem 514 nm, Fluka-Sigma-Aldrich®, St. Louis, Mo, USA) water solution (0.1 mol/m3). In order to prevent tissue swelling, the AF specimens were confined within two sinterized stainless steel platens (20μm porosity, Mott Corp., Farmington, CT) and an impermeable spacer (see Figure 3). Measurements of the height of the cylindrical specimens were performed by a custom-made current sensing micrometer21 before and after the samples reached equilibrium in the fluorescein solution. No variation in thickness of the sample was detected (data not shown), indicating that no swelling of the sample occurred during its equilibration in the fluorescein solution.
Figure 3.
Setup for equilibrating specimens in a fluorescein water solution (0.1 mol/m3).
Diffusivity Measurement
Fluorescein diffusion coefficients within the three principal planes of AF were determined by means of FRAP tests conducted at room temperature (22°C). AF specimens were photobleached using an argon laser (488nm wave length) of a confocal laser scanning microscope (LSM 510 Zeiss, Jena, Germany). A Plan-Neofluar 20X/0.50 WD 2.0 objective (Zeiss, Jena, Germany) was used in these experiments: for each test 200 frames (128×128 pixels, 460.7×460.7 μm2) were collected, five of them before bleaching the sample. For each region (anterior or posterior) and direction (axial, circumferential or radial) forty-eight tests were performed. The collected data (images) were analyzed by custom-made software performing an algorithm of SFA and curve-fitting the experimental results with Equation (6),4,6,46 to yield D(ξ). Note that D(ξ) is a function of the u-v frequency couples. The diffusion coefficient Dav was obtained by averaging D(ξ) over Ring 3 and Ring 4 by Equation (7), similar to the isotropic case proposed in the literature.46
MLB Protocol
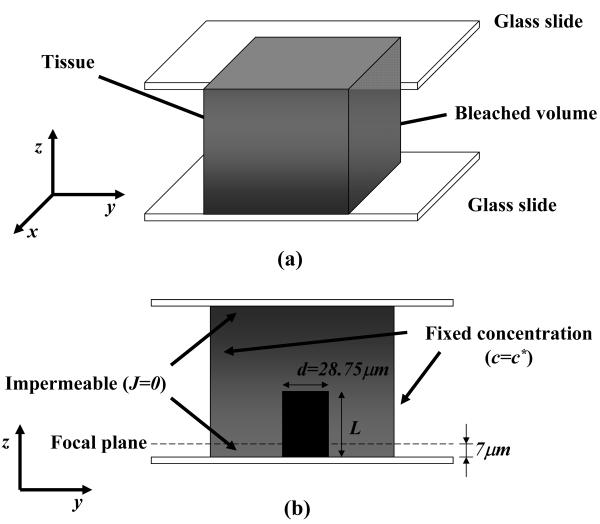
For each FRAP test four different layers of AF samples were sequentially bleached. The distance between the bottom glass slide (see Figure 7) and the focal plane of the microscope objective, where fluorescence recovery was observed, was 7 μm and the diameter of the bleach spot was 28.75 μm. The other bleach spots were produced in layers at 17, 27 and 32 μm from the bottom of the sample and their diameters were 43.12, 50.31 and 71.88 μm, respectively. The bleached spots were produced from top to bottom. Measurements of fluorescence intensity within the sample indicated that, after bleaching the four sample layers, the final shape of the bleached region is a cylinder of approximately 28 μm diameter and 47 μm height. Numerical simulations demonstrated that in these conditions the highest relative error (in the case D⊥/D=2) committed in the determination of Dav using 2D SFA is estimated to be approximately 18% (see Appendix for details).
Figure 7.
Schematic of the computational domain: (a) the three-dimensional sample is confined between two glass slides (top and bottom) with a cylinder representing bleached volume, obtained by multi-layer bleaching; (b) Cross-sectional view of the sample and the applied boundary conditions.
Determination Diffusion Tensor Components
Let Daxi, Dcir and Drad stand for the averaged diffusion coefficients measured in the IVD principal planes with surface normal along the axial, circumferential and radial directions of the disc, respectively; Dz, Dθ and Dr for the principal components of the diffusion tensor in the axial, circumferential, and radial directions, respectively. Applying Equation (8) to the three principal IVD planes, it follows that:
| (9) |
The above set of linear equations allows the extraction of the principal components of the diffusion tensor (Dz, Dθ and Dr) from the measured, averaged diffusion coefficients within the three principal planes of the IVD.
Scanning Electron Microscopy(SEM)
SEM of two bovine coccygeal intervertebral discs was performed in order to correlate the collagen fiber structure of AF to the diffusion coefficient data. Axial and radial sections of anterior and posterior regions of AF were fixed with a 2% gluteraldehyde (Electron Microscopy Sciences, Hatfield, Pa, USA) in phosphate buffer solution (Sigma®, St. Louis, Mo, USA), dehydrated in a graded series of ethanol (20, 40, 60, 80, 100%) and then dried by immersion in hexamethyldisilizane (Electron Microscopy Sciences, Hatfield, Pa, USA).23 Finally, the samples were sputter coated with Pd (Sputter Coater 108auto, Cressington, Watford, UK). High-resolution SEM images were taken on an Environmental Scanning Electron Microscope (XL30 ESEM-FEG, FEI Company, Hillsborg, Or, USA) in high-vacuum mode.
RESULTS
The values of averaged diffusion coefficient in axial, circumferential, and radial planes of AF were different (Table 1). A two-way analysis of variance (ANOVA) was performed to investigate the effects of the region and the direction on the measured, averaged diffusion coefficients in AF using Microsoft® Office Excel 2003 (Microsoft Corp., Seattle, WA). The two factors considered in the analysis were the disc region (two levels: anterior and posterior) and the direction (three levels: axial, circumferential, and radial).
Table 1.
Measured diffusion coefficients of fluorescein within each of the principal planes in the anterior and posterior regions of AF. The measured diffusion coefficients are averaged in the frequency space according to Equation (7).
| Daxi (10−6 cm2s−1) | Dcir (10−6 cm2s−1) | Drad (10−6 cm2s−1) | |
|---|---|---|---|
| Anterior | 1.02±0.3 | 1.04±0.21 | 1.24±0.46 |
| Posterior | 0.92±0.35 | 0.92±0.21 | 1.05±0.3 |
Both disc region and principal direction were shown to affect the fluorescein diffusion coefficient significantly (P<0.05). It was found that the mean values of the diffusion coefficient in anterior region were significantly different from those in the posterior region (P<0.05). These findings indicated that D is inhomogeneous within AF. In both posterior and anterior regions, the diffusion coefficient within the radial plane was significantly higher than that within the circumferential or axial plane. In both anterior and posterior regions, axial and circumferential diffusion coefficients were not significantly different.
The principal components of the diffusion tensor (D) were extracted from the experimental data (Table 1) according to Equation (9), see Figure 4. In both regions, the mean value of the radial diffusion coefficient (Dr) was the lowest with a value of in the anterior region and in the posterior region. In comparison, the mean values of the circumferential and axial diffusion coefficients were similar: along the θ–direction for the anterior region and for the posterior region; along the z-direction and for the anterior and posterior regions respectively, see Figure 4.
Figure 4.
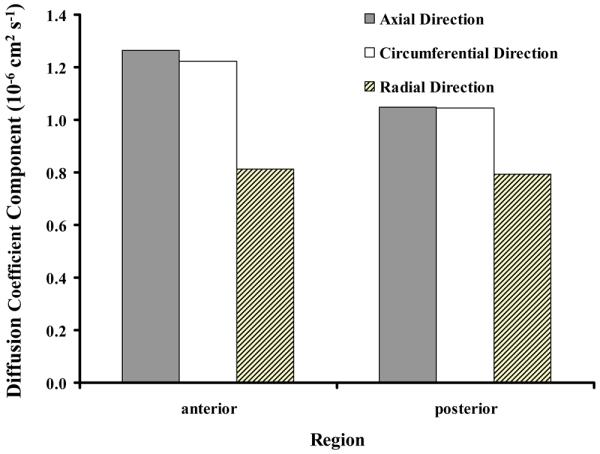
Anisotropic diffusion coefficients of fluorescein in axial, circumferential, and radial directions of AF.
DISCUSSION
The main objective of this study was to investigate the anisotropic diffusion of solute in AF using the FRAP technique. The results showed that the diffusion coefficients of the fluorescein dye in AF are different along its principal directions (axial, circumferential, and radial). In particular, the results showed that the diffusion coefficient in the radial direction is about 66-75% the value of axial or circumferential direction for specimens harvested from anterior and posterior regions respectively, see Figure 4.
This study represents the first measurement of anisotropic diffusion of a relatively small solute in AF using a video-FRAP technique. A new FRAP testing protocol (i.e., multilayer bleaching) was developed for bulk samples to achieve an approximately 2D diffusion condition (see Appendix). Numerical simulations showed that it was possible to combine multilayer beaching and the 2D SFA algorithm for determining anisotropic diffusion coefficients in AF (less than 18% error, Appendix). To further validate our method, our results were compared with the anisotropic diffusion coefficients of glucose in axial and radial directions of bovine coccygeal AF, measured by a direct diffusion experiment (manuscript in preparation). It was found that our results were consistent with those from the direct diffusion experiment in which the value of diffusion coefficient of glucose in the radial direction was about 66% of the value in the axial direction (manuscript in preparation). Moreover, the finding of anisotropic diffusion behavior of fluorescein in the present study is also consistent with a study on anisotropic ion diffusivity in bovine coccygeal AF in the literature.29 The values of ion (Na+ and Cl−) diffusivities are reported to be not significantly different between the axial and circumferential directions. In the radial direction, however, the ion diffusivity is, again, about 2/3 of the values in the axial or circumferential direction.29
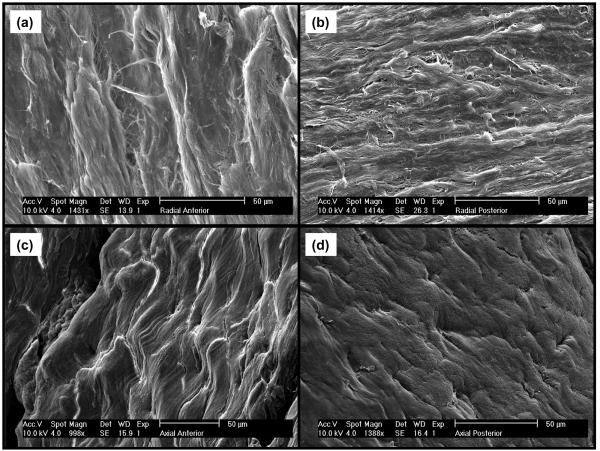
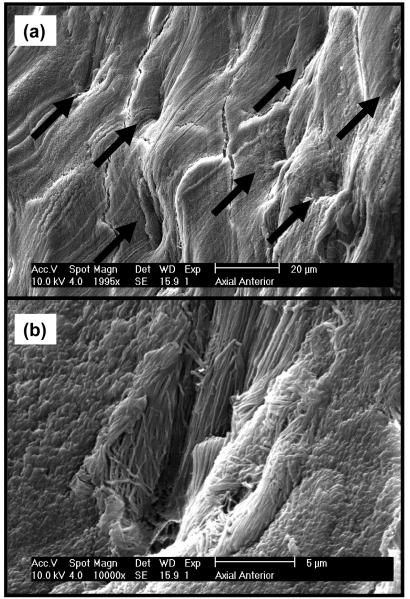
Our findings can be related to the tissue structure of the AF in terms of its collagen fiber organization. Figures 5a-5d show SEM images of radial and axial sections (or planes) in both posterior and anterior regions of AF. In contrast with the radial sections, axial sections show orderly distributed cavities (Figure 5c-5d). Higher magnifications of the anterior radial section show the cavities to be microtubules (∼5μm diameter) parallel to the direction of the collagen bundle fibers, see Figure 6a-6b. In case microtubules represent a preferential pathway for mass transport, this would explain the direction-dependent diffusive behavior of solutes in AF: while in the axial direction solutes could preferentially move through the microtubular pathway, in the radial direction this would not be possible since microtubules are not contiguous. Note that a similar structure (i.e., microtubules) has been reported in the literature for IVD of rat tails.28
Figure 5.
SEM images of AF sections: (a-b) anterior and posterior radial sections; (c-d) anterior and posterior axial sections.
Figure 6.
SEM images of anterior axial section of AF. (a) Microtubules are shown; (b) Magnification of a microtubule in picture (a).
In this study, the diffusion tensor is assumed to be orthotropic with three principal (axial, circumferential, and radial) directions. Indeed, at collagen fiber level, the principal directions should be parallel to the orientation of the collagen bundles within the lamellae[34] which varies from ±62 to ±45 degrees respect to the axial direction.13 However, collagen fiber orientations within two adjacent lamellae are alternating; therefore, the diffusivity values in the axial and circumferential directions should be interpreted as averaged values over two adjacent lamellae.
CONCLUSIONS
A new method has been developed for determining anisotropic diffusion of solute in bulk tissue using FRAP. This method has been successfully applied, for the first time, to the study on the anisotropic diffusion of solute in IVD. It has been found that the diffusion of solute in bovine coccygeal AF is inhomogeneous (varying from anterior to posterior regions) and anisotropic, with radial diffusion coefficient being lowest among three major directions (axial, circumferential, and radial). This finding is consistent with the findings on anisotropic diffusion of glucose (manuscript in preparation) and ions in bovine coccygeal IVD.29
The anisotropic diffusion behavior in AF is due to the organization of the collagen fibers in tissue. The microtubules parallel to the collagen fiber bundles may be a preferential pathway for solutes diffusing in the axial and circumferential directions.
Our results provide new understandings on the relationship between solute diffusion coefficient and the structure of AF. The methods and findings reported in the present study could help elucidate the pathways of nutritional supply to the human IVD (the largest avascular structure in the human body),1,40,42,52 which is crucial for understanding its degeneration.8,25,26,35,48
ACKNOWLEDGEMENTS
The project was supported by Grant Number AR050609 from NIH/NIAMS. The authors wish to thank Dr. Weizhao Zhao and Tai Yi Yuan for their assistance in imaging analysis and specimen preparation.
APPENDIX
When a tissue sample is bleached over its whole thickness in a FRAP test, the diffusive transport of fluorescent probes occurs within the focal plane of the microscope objective and diffusion is two-dimensional (2D) phenomenon. This condition is practically achievable when the thickness of the sample is comparable to the optical slice of the microscope objective (e.g., in membranes or polymeric films). In a FRAP test with CLSM on bulk samples, the bleached region does not extend over the entire thickness of the specimen. Therefore, the presence of a gradient of concentration of fluorescent solute in the direction orthogonal to the focal plane (z-direction) causes fluorescence recovery to be a 3D diffusion phenomenon.9,10,37 If 2D SFA is adopted in the analysis of FRAP test data, the contribution of the diffusive flux in the z-direction is neglected. Consequently, the calculated diffusion coefficient (D) is overestimated. The error in the estimation of D depends on two factors: (1) the ratio of the bleached size (d), in the focal plane, to the thickness (L) of the bleached volume (Figure 7); and (2) the ratio of the diffusion coefficient in the z-direction to the averaged diffusion coefficient in the focal plane (D⊥/D).
In order to quantify the error in the estimation of the diffusion coefficient by using the 2D SFA approach presented in this work, a numerical analysis was performed to simulate 3D diffusive transport of fluorescent molecules within a bulk sample using finite element method (COMSOL® 3.2, COMSOL Inc., Burlington, MA).
Figure 7a represents a schematic of the computational domain. A cubic sample of 460 μm side is placed between two glass slides. The initial fluorescent solute concentration within the cubic domain was assumed to be uniform with exception for a cylindrical volume, representing the bleached region, in which fluorescent probe concentration is zero. The diameter d of the cylinder was set equal to 28.75 μm in order to simulate the experimental conditions, see Materials and Methods. The height of the cylinder L varied according to the number of the planes being bleached in the simulation.
Since the domain is confined between to glass slides, on the bottom and top surfaces of the cube, an impermeable boundary condition (diffusive flux J=0) was imposed. Besides, since the cube is large enough with respect to the diameter of the cylinder, the solute concentrations on the lateral surfaces of the cube were assumed to be constant (c=c*), see Figure 7b.
Numerical simulations were performed using ∼35000 quadratic Lagrange tetrahedral elements. The degree of anisotropy in diffusion was simulated with the ratio of diffusion coefficient in the z-direction to that in the x-y plane (D⊥/D) varying from one (isotropy) to two. From each simulation a time series of 200 frames, representing the images on the focal plane of the microscope objective (7 μm from the bottom of the sample, see Materials and Methods), were extracted and analyzed by custom-made SFA software (see Materials and Methods above).
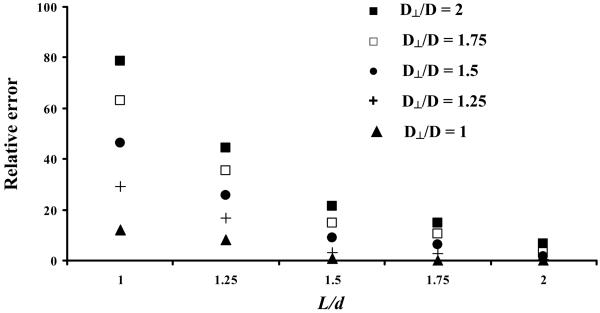
Figure 8 shows the relative error in the estimation of Dav by Equation (7) as a function of L/d for different degrees of anisotropy. The relative error increases with the ratio D⊥/D but decreases with L/d. By increasing the height of the bleached volume (cylinder), the relative error decreases (less than 7% for D⊥/D=2, when L/d=2) and, theoretically, it could be reduced to zero for sufficiently large values of L/d (or small values of D⊥/D). This indicates that the diffusive flux in the z-direction could be negligible under certain conditions.
Figure 8.
Relative error in the estimation of Dav as a function of L/d for different degrees of anisotropy in diffusion (D⊥/D).
In practice only a few layers can be sequentially bleached within the bulk sample before fluorescence recovery occurs in the earlier bleached planes. According to the testing protocol used in this work, four layers were sequentially bleached, generating a cylindrical bleach region of 28 μm diameter and 47 μm height (see Materials and Methods). By measuring the intensity of the fluorescence emission within the bleached volume (cylinder), three regions were identified (measured from the bottom glass slide): (1) from 0 to 17 μm, the fluorescence was completely depleted; (2) from 17 to 27 μm, the fluorescence linearly increased (i.e., recovered) to 50% of the intensity of the surrounding unbleached tissue (Io); (3) from 27 μm to 47 μm, the fluorescence intensity was approximately 50% of the value of Io (data not shown). Since the light intensity is proportional to the concentration of fluorescent molecules,6 the above information was used as an initial condition for probe concentration in the numerical simulation on mass transport of fluorescent solute, in order to evaluate the relative error committed in the determination of Dav using 2D SFA. Our simulation showed that the highest relative error (in the case D⊥/D=2) is approximately 18%.
REFERENCE
- 1.Andersson GB, An HS, Oegema TR, Setton LA. Directions for future research. J Bone Joint Surg. 2006;88:110–114. doi: 10.2106/JBJS.F.00030. [DOI] [PubMed] [Google Scholar]
- 2.Axelrod D, Koppel DE, Schlessinger J, Elson E, Webb WW. Mobility measurement by analysis of fluorescence photobleaching recovery kinetics. Biophys J. 1976;16:1055–1069. doi: 10.1016/S0006-3495(76)85755-4. [DOI] [PMC free article] [PubMed] [Google Scholar]
- 3.Ayotte DC, Ito K, Perren SM, Tepic S. Direction-dependent constriction flow in a poroelastic solid: the intervertebral disc valve. J Biomech Eng. 2000;122:587–593. doi: 10.1115/1.1319658. [DOI] [PubMed] [Google Scholar]
- 4.Belloulata K, Konrad J. Frantal image compression with region-based functionality. Image Processing, IEEE Transactions. 2002;11:351–362. doi: 10.1109/TIP.2002.999669. [DOI] [PubMed] [Google Scholar]
- 5.Berk DA, Yuan F, Leunig M, Jain RK. Direct in vivo measurement of targeted binding in a human tumor xenograft. Proc.Natl.Acad.Sci.USA. 1997;94:1785–1790. doi: 10.1073/pnas.94.5.1785. [DOI] [PMC free article] [PubMed] [Google Scholar]
- 6.Berk DA, Yuan F, Leunig M, Jain RK. Fluorescence photobleaching with spatial Fourier analysis: measurement of diffusion in light-scattering media. Biophys.J. 1993;65:2428–2436. doi: 10.1016/S0006-3495(93)81326-2. [DOI] [PMC free article] [PubMed] [Google Scholar]
- 7.Berlemann U, Gries NC, Moore RJ. The relationship between height, shape and histological changes in early degeneration of the lower lumbar discs. European Spine Journal. 1998;7:212–217. doi: 10.1007/s005860050058. [DOI] [PMC free article] [PubMed] [Google Scholar]
- 8.Bibby SR, Fairbank JC, Urban MR, Urban JP. Cell viability in scoliotic discs in relation to disc deformity and nutrient levels. Spine. 2002;27:2220–2228. doi: 10.1097/00007632-200210150-00007. [DOI] [PubMed] [Google Scholar]
- 9.Blonk JCG, Don A, van Aalst H, Birmingham JJ. Fluorescence photobleaching recovery in the confocal scanning light microscope. J Microsc. 1993;169:363–374. [Google Scholar]
- 10.Braeckmans K, Peeters L, Sanders NN, De Smedt SC, Demeester J. Three-dimensional fluorescence recovery after photobleaching with the confocal scanning laser microscope. Biophys J. 2003;85:2240–2252. doi: 10.1016/s0006-3495(03)74649-9. [DOI] [PMC free article] [PubMed] [Google Scholar]
- 11.Braga J, Desterro JM, Carmo-Fonseca M. Intracellular macromolecular mobility measured by fluorescence recovery after photobleaching with confocal scanning laser microscope. Mol.Cell Biol. 2004;15:4749–4760. doi: 10.1091/mbc.E04-06-0496. [DOI] [PMC free article] [PubMed] [Google Scholar]
- 12.Buckwalter JA. Aging and degeneration of the human intervertebral disc. Spine. 1995;20:1307–1314. doi: 10.1097/00007632-199506000-00022. [DOI] [PubMed] [Google Scholar]
- 13.Cassidy JJ, Hiltner A, Baer E. Hierarchical structure of the intervertebral disc. Connect Tissue Res. 1989;23:75–88. doi: 10.3109/03008208909103905. [DOI] [PubMed] [Google Scholar]
- 14.Chary SR, Jain RK. Direct Measurement of Interstitial Convection and Diffusion of Albumin in Normal and Neoplastic Tissues by Fluorescence Photobleaching. PNAS. 1989;86:5385–5389. doi: 10.1073/pnas.86.14.5385. [DOI] [PMC free article] [PubMed] [Google Scholar]
- 15.Chiu EJ, Newitt DC, Segal MR, Hu SS, Lotz JC, Majumdar S. Magnetic resonance imaging measurement of relaxation and water diffusion in the human lumbar intervertebral disc under compression in vitro. Spine. 2001;26:E437–E444. doi: 10.1097/00007632-200110010-00017. [DOI] [PubMed] [Google Scholar]
- 16.Elliott DM, Setton LA. Anisotropic and inhomogeneous tensile behavior of the human anulus fibrosus: experimental measurement and material model predictions. J Biomech Eng. 2001;123:256–263. doi: 10.1115/1.1374202. [DOI] [PubMed] [Google Scholar]
- 17.Eyre DR, Benya P, Buckwalter J, Caterson B, Heinegard D, Oegema T, Pearce R, Pope M, Urban J. Intervertebral disk: Basic science perspectives. In: Frymoyer JW, Gordon SL, editors. New Perspectives on Low Back Pain. American Academy of Orthopaedic Surgeons; Park Ridge, IL: 1989. pp. 147–207. [Google Scholar]
- 18.Ferguson SJ, Ito K, Nolte LP. Fluid flow and convective transport of solutes within the intervertebral disc. J Biomech. 2004;37:213–221. doi: 10.1016/s0021-9290(03)00250-1. [DOI] [PubMed] [Google Scholar]
- 19.Fujita Y, Wagner DR, Biviji AA, Duncan NA, Lotz JC. Anisotropic shear behavior of the annulus fibrosus: effect of harvest site and tissue prestrain. Med.Eng Phys. 2000;22:349–357. doi: 10.1016/s1350-4533(00)00053-9. [DOI] [PubMed] [Google Scholar]
- 20.Gruber HE, Hanley EJ. Recent Advances in Disc Cell Biology. Spine. 2003;28:186–193. doi: 10.1097/00007632-200301150-00017. [DOI] [PubMed] [Google Scholar]
- 21.Gu WY, Justiz MA. Apparatus for measuring the swelling dependent electrical conductivity of charged hydrated soft tissues. J Biomech Engng. 2002;124:790–793. doi: 10.1115/1.1516571. [DOI] [PubMed] [Google Scholar]
- 22.Gu WY, Mao XG, Foster RJ, Weidenbaum M, Mow VC, Rawlins BA. The anisotropic hydraulic permeability of human lumbar anulus fibrosus. Influence of age, degeneration, direction, and water content. Spine. 1999;24:2449–2455. doi: 10.1097/00007632-199912010-00005. [DOI] [PubMed] [Google Scholar]
- 23.Hayat MA. Fixation for electron microscope. Academic Press; 1982. p. 501. [Google Scholar]
- 24.Holm S, Maroudas A, Urban JP, Selstam G, Nachemson A. Nutrition of the intervertebral disc: solute transport and metabolism. Connect.Tissue Res. 1981;8:101–119. doi: 10.3109/03008208109152130. [DOI] [PubMed] [Google Scholar]
- 25.Holm S, Nachemson A. Nutritional changes in the canine intervertebral disc after spinal fusion. Clin.Orthop. 1982:243–258. [PubMed] [Google Scholar]
- 26.Horner HA, Urban JP. Volvo Award Winner in Basic Science Studies: Effect of nutrient supply on the viability of cells from the nucleus pulposus of the intervertebral disc. Spine. 2001;2001;26:2543–2549. doi: 10.1097/00007632-200112010-00006. [DOI] [PubMed] [Google Scholar]
- 27.Hsu EW, Setton LA. Diffusion tensor microscopy of the intervertebral disc anulus fibrosus. Magn Reson.Med. 1999;41:992–999. doi: 10.1002/(sici)1522-2594(199905)41:5<992::aid-mrm19>3.0.co;2-y. [DOI] [PubMed] [Google Scholar]
- 28.Iatridis JC, ap Gwynn I. Mechanisms for mechanical damage in the intervertebral disc annulus fibrosus. J Biomech. 2004;37:1165–1175. doi: 10.1016/j.jbiomech.2003.12.026. [DOI] [PMC free article] [PubMed] [Google Scholar]
- 29.Jackson AR, Yao H, Brown MD, Gu WY. Anisotropic ion diffusivity in intervertebral disc: an electrical conductivity approach. Spine. 2006;31:2783–2789. doi: 10.1097/01.brs.0000245842.02717.1b. [DOI] [PubMed] [Google Scholar]
- 30.Jacobson K, Derzko Z, Wu ES, Hou Y, Poste G. Measurement of the lateral mobility of cell surface components in single, living cells by fluorescence recovery after photobleaching. J Supramol Struct. 1976;5:565–576. doi: 10.1002/jss.400050411. [DOI] [PubMed] [Google Scholar]
- 31.Leddy HA, Guilak F. Site-specific molecular diffusion in articular cartilage measured using fluorescence recovery after photobleaching. Annals of Biomedical Engineering. 2003;31:753–760. doi: 10.1114/1.1581879. [DOI] [PubMed] [Google Scholar]
- 32.Leddy HA, Haider MA, Guilak F. Diffusional Anisotropy in Collagenous Tissues: Fluorescence Imaging of Continuous Point Photobleaching. Biophysical Journal. 2006;91:311–316. doi: 10.1529/biophysj.105.075283. [DOI] [PMC free article] [PubMed] [Google Scholar]
- 33.Lopez A, Dupou L, Alitibelli A, Trotard J, Tocanne JF. Fluorescence recovery after photobleaching (FRAP) experiments under conditions of uniform disk illumination. Critical comparison of analytical solutions, and a new mathematical method for calculation of diffusion coefficient D. Biophys J. 1988;53:963–970. doi: 10.1016/S0006-3495(88)83177-1. [DOI] [PMC free article] [PubMed] [Google Scholar]
- 34.Mullineaux CW. FRAP analysis of photosynthetic membranes. Journal of Experimental Botany. 2004;55:1207–1211. doi: 10.1093/jxb/erh106. [DOI] [PubMed] [Google Scholar]
- 35.Nachemson A, Lewin T, Maroudas A, Freeman MA. In vitro diffusion of dye through the end-plates and the annulus fibrosus of human lumbar inter-vertebral discs. Acta Orthop Scand. 1970;41:589–607. doi: 10.3109/17453677008991550. [DOI] [PubMed] [Google Scholar]
- 36.Ohshima H, Tsuji H, Hiarano N, Ishihara H, Katoh Y, Yamada H. Water diffusion pathway, swelling pressure, and biomechanical properties of the intervertebral disc during compression load. Spine. 1989;14:1234–1244. doi: 10.1097/00007632-198911000-00017. [DOI] [PubMed] [Google Scholar]
- 37.Peters R, Kubitscheck U. Scanning microphotolysis: three-dimensional diffusion measurement and optical single-transporter recording. Methods. 1999;18:508–517. doi: 10.1006/meth.1999.0819. [DOI] [PubMed] [Google Scholar]
- 38.Peters R, Peters J, Tews KH, Bahr W. A microfluorimetric study of translational diffusion in erythrocyte membranes. Biochim Biophys Acta. 1974;367:282–294. doi: 10.1016/0005-2736(74)90085-6. [DOI] [PubMed] [Google Scholar]
- 39.Pluen A, Netti PA, Jain RK, Berk DA. Diffusion of macromolecules in agarose gels: comparison of linear and globular configuration. Biophysical Journal. 1999;77:542–552. doi: 10.1016/S0006-3495(99)76911-0. [DOI] [PMC free article] [PubMed] [Google Scholar]
- 40.Selard E, Shirazi-Adl A, Urban J. Finite Element Study of Nutrient Diffusion in the Human Intervertebral Disc. Spine. 2003;28:1945–1953. doi: 10.1097/01.BRS.0000087210.93541.23. [DOI] [PubMed] [Google Scholar]
- 41.Smith BA, Clark WR, McConnell HM. Anisotropic molecular motion on cell surfaces. PNAS. 1979;76:5641–5644. doi: 10.1073/pnas.76.11.5641. [DOI] [PMC free article] [PubMed] [Google Scholar]
- 42.Soukane DM, Shirazi-Adl A, Urban J. Analysis of Nonlinear Coupled Diffusion of Oxygen and Lactic Acid in Intervertebral Discs. Journal of Biomechanical Engineering. 2005;127:1121–1126. doi: 10.1115/1.2073674. [DOI] [PubMed] [Google Scholar]
- 43.Sprague BL, Pego RL, Stavreva DA, McNally JG. Analysis of Binding Reactions by Fluorescence Recovery after Photobleaching. Biophys J. 2004;86:3473–3495. doi: 10.1529/biophysj.103.026765. [DOI] [PMC free article] [PubMed] [Google Scholar]
- 44.Stolpen AH, Pober JS, Brown CS, Golan DE. Class I major histocompatibility complex proteins diffuse isotropically on immune interferon-activated endothelial cells despite anisotropic cell shape and cytoskeletal organization: application of fluorescence photobleaching recovery with an elliptical beam. Proc Natl Acad Sci USA. 1988;85:1844–1848. doi: 10.1073/pnas.85.6.1844. [DOI] [PMC free article] [PubMed] [Google Scholar]
- 45.Taylor JR. Growth of human intervertebral discs and vertebral bodies. J Anat. 1975;120:49–68. [PMC free article] [PubMed] [Google Scholar]
- 46.Tsay TT, Jacobson K. Spatial Fourier analysis of video photobleaching measurements. Principles and optimization. Biophys J. 1991;60:360–368. doi: 10.1016/S0006-3495(91)82061-6. [DOI] [PMC free article] [PubMed] [Google Scholar]
- 47.Tseng KC, Turro NJ, Durning CJ. Molecular mobility in polymer thin films. Phys.Rev.E.Stat.Phys.Plasmas.Fluids Relat Interdiscip.Topics. 2000;61:1800–1811. doi: 10.1103/physreve.61.1800. [DOI] [PubMed] [Google Scholar]
- 48.Urban JP. The role of the physicochemical environment in determining disc cell behaviour. Biochem.Soc Trans. 2001;30:858–864. doi: 10.1042/bst0300858. [DOI] [PubMed] [Google Scholar]
- 49.Urban JP, Holm S, Maroudas A. Diffusion of small solutes into the intervertebral disc: as in vivo study. Biorheology. 1978;15:203–221. doi: 10.3233/bir-1978-153-409. [DOI] [PubMed] [Google Scholar]
- 50.Urban JP, Smith S, Fairbank JC. Nutrition of the Intervertebral disc. Spine. 2004;29:2700–2709. doi: 10.1097/01.brs.0000146499.97948.52. [DOI] [PubMed] [Google Scholar]
- 51.Urban JPG, Holms S, Maroudas A, Nachemson A. Nutrition of the intervertebral disc: An in vivo study of solute transport. Clin Orthop. 1977;129:101–114. [PubMed] [Google Scholar]
- 52.Yao H, Gu WY. Physical signals and solute transport in cartilage under dynamic unconfined compression: finite element analysis. Annals of Biomed Engng. 2004;32:380–390. doi: 10.1023/b:abme.0000017540.84764.6f. [DOI] [PubMed] [Google Scholar]
- 53.Yao H, Gu WY. Physical signals and solute transport in human intervertebral disc during compressive stress relaxation: 3D finite element analysis. Biorheology. 2006;43:323–335. [PubMed] [Google Scholar]
- 54.Yao H, Gu WY. Three-dimensional inhomogeneous triphasic finite-element analysis of physical signals and solute transport in human intervertebral disc under axial compression. Journal of Biomechanics. 2007 doi: 10.1016/j.jbiomech.2006.10.001. In Press. [DOI] [PMC free article] [PubMed] [Google Scholar]


