Abstract
OBJECTIVE
Insulin resistance develops in tandem with obesity. Ablating myostatin (Mstn) prevents obesity, so we investigated if Mstn deficiency could improve insulin sensitivity. A loss-of-function mutation (MstnLn) in either one or both alleles of the Mstn gene shows how Mstn deficiency protects whole-body insulin sensitivity.
RESEARCH DESIGN AND METHODS
MstnLn/Ln mice were weaned onto a high-fat diet (HFD) or standard diet. HFD-fed MstnLn/Ln mice exhibited high lean, low-fat body compositions compared with wild types. Wild-type and heterozygous and homozygous mutant mice were bled to determine basal levels of insulin, glucose, and homeostasis model assessment of insulin resistance. To evaluate postprandial insulin sensitivity between animals of a similar size, glucose and insulin tolerance tests and hyperinsulinemic-euglycemic clamp studies were performed with heterozygous and homozygous mutant mice. Quantitative RT-PCR quantified TNF∝, IL-6, IL-1β, F4/80, GPR43, and CD36 expression in muscle, fat, and liver. Histological analysis measured hepatosteatosis.
RESULTS
Homozygous mutants were glucose tolerant and protected against overall insulin resistance compared with heterozygous mice. Hyperinsulinemic-euglycemic clamp studies revealed a dramatically improved glucose infusion rate, glucose disposal rate, and hepatic glucose production in 11-month-old MstnLn/Ln mice on an HFD. Improvements to muscle and liver insulin sensitivity (∼200–400%) correlated with 50–75% decreased tumor necrosis factor (TNF)α production and coincided with severe Mstn deficiency. Hepatosteatosis appeared to be ameliorated. Short-term treatment of MstnLn/Ln mice with recombinant Mstn led to increased plasma TNFα and insulin resistance.
CONCLUSIONS
We find that severe Mstn deficiency caused by Ln (lean) mutations in HFD-fed mice protects muscle and liver against obesity-induced insulin resistance.
Myostatin (Mstn; also called Gdf-8) is a transforming growth factor-β family member that is predominantly expressed in skeletal muscle tissue (1,2). Mstn negatively regulates muscle mass (2,3) and is a potent regulator of adipogenesis (4,5). Knockout of the Mstn gene (Mstn) from agouti lethal yellow (Ay) and obese (Lepob/ob) mice improves glucose tolerance, increases muscle mass, and decreases adiposity (6). Obesity-prone Ay and Lepob/ob Mstn null mice have body sizes roughly equal to those of their littermate controls due to a diametrical change in muscle and fat characterized by fewer adipocytes that are reduced in size and hyperplasia and hypertrophy of individual muscle fibers. In addition, Mstn knockout mice exhibit an ability to fend off age-related expansion of adipose tissue mass by keeping their fat cells small, unlike wild types, which have enlarged adipocytes contributing to increasing adiposity with age. Evidently, knockout mice experience continued protection against obesity over the later part of their lifespan as they age compared with wild-type mice, yet they have similar total and resting metabolic rates.
Here, we describe a novel, loss-of-function allele of Mstn (MstnLn) identified from a forward genetic screen of N-ethyl-N-nitrosourea (ENU)-mutagenized mice challenged with a high-fat diet (HFD). HFD-fed mice with the Ln (lean) mutations displayed altered body compositions consistent with the in vivo effects on growth produced by Mstn deficiency. The loss-of-function Mstn mutation prevented obesity, decreased plasma insulin, and normalized the body weights of heterozygous and homozygous mice. Therefore, we studied relationships among partial Mstn deficiency, lipid utilization, and whole-body insulin sensitivity by comparing animals of a similar size to avoid the complicating factor of differences in body weight. Hyperinsuliemic-euglycemic clamp studies performed in aged HFD-fed MstnLn/Ln and Mstn+/Ln mice showed that there was a marked improvement to muscle and liver insulin sensitivity, and this was associated with reduced steatosis and decreased tumor necrosis factor (TNF)α and interleukin (IL)-6 gene expression in muscle and fat but not in liver.
RESEARCH DESIGN AND METHODS
Generation, housing, and diet.
ENU-mutagenized C57BL/6 (B6) mice were generated as described (7). Mice were maintained by backcrossing affected animals to B6. Animals were housed in the Genomics Institute of the Novartis Research Foundation specific pathogen–free animal facility. All procedures were approved by the institutional animal care and use committee at the Genomics Institute of the Novartis Research Foundation. Mice were provided with an HFD at weaning, deriving 58% of its calories from fat (D12331; Research Diets, New Brunswick, NJ). After 8 consecutive weeks on an HFD, mice were identified as affected or not after an evaluation of plasma hormones and whole-body composition. A loss-of-function Mstn mutation was found to be present in mice bred from randomly ENU-mutagenized B6 animals within a family we call Ln.
Mapping and genotyping.
Affected B6 mice were bred to A/J mice to generate hybrid F1 and F2 mice for mapping. Single nucleotide polymorphism (SNP) assays across the entire genome (n = 356) were performed using the Sequenom MassARRAY system, as previously described (8). All three exons and intron/exon junctions of Mstn were amplified by PCR and sequenced for mutation detection. Mice were genotyped by amplifying a 93-bp segment about the point of mutation with primers 5′-GAATGGCCATGATCTTGCTG-3′ and 5′-GTAACACGGTTGCTAGAATG-3′. An extension primer, 5′-aggagaagatgggctgg-3′, was annealed to the PCR product and extended in the presence of dTTP (deoxythymidinetriphosphate) and dCTP (deoxycytidinetriphosphate) to yield a 1-base extension of the primer when annealed to wild-type (dT) or mutant (dC) template. The different extension products were distinguished by mass spectrometry (Sequenom). One in four offspring from the F2 and subsequent heterozygote-by-heterozygote matings were confirmed to be affected and homozygous mutant.
Body composition assay.
Body fat and lean masses were determined in conscious mice by nuclear magnetic resonance at 4 months of age using the EchoMRI-100 from Echo Medical Systems (Houston, TX).
Plasma glucose, hormones, lipids, and cytokines.
Glucose was measured by a OneTouch Ultra glucometer (Lifescan, Milpitas, CA). Insulin and leptin were measured by enzyme-linked immunosorbent assays (ELISAs) with kits from CrystalChem (Chicago, IL). Total cholesterol, triglyceride, and free fatty acid (FFA) measurements were performed with an AU400e auto analyzer from Olympus America (Center Valley, PA). TNFα was measured using a TiterZyme Enzyme Immunometric Assay Kit obtained from Assay Designs (Ann Arbor, MI). Adiponectin and IL-6 were measured by specific ELISA using kits from Chemicon International (Temecula, CA) and R&D Systems (Minneapolis, MN), respectively.
Glucose tolerance test.
Glucose tolerance to was determined in 6-h–fasted mice. Glucose was administered to conscious mice by intraperitoneal injection (2 g/kg). Blood was pushed from nicked tails. Blood glucose was measured instantly using a OneTouch Ultra glucometer. Blood samples (20 μl) were collected at 0, 5, 15, and 30 min and spun (8,000 rpm/4°C). Extracted plasma was stored at −20°C. One week later, plasma samples were thawed once and insulin was measured in duplicate by ELISA (CrystalChem).
Insulin tolerance test.
Hand-held mice received insulin (Novolin R; Novo Nordisk, Copenhagen, Denmark) by intraperitoneal injection (0.5 units/kg). Glucose measurements were made at 0, 20, 40, 60, and 80 min as described for the glucose tolerance test.
Hyperinsulinemic-euglycemic clamp studies.
Animals were surgically implanted with dual jugular vein catheters constructed of micro-renathane (MRE 033; Braintree, MA). Afterward, mice were allowed to recover on a warm pad. Upon awaking, mice were provided with food and water for 4 days. Fully recovered catheterized mice were transferred to clean cages without food to fast for 6 h. Mice were placed in a restraining device. A priming radioactive dose (2.5 μCi) of d-[1-3H]glucose (American Radiolabeled Chemicals, St. Louis, MO) was given to secured mice. Thereafter, saline plus tritiated glucose (10 μCi/ml) infusions were started at t = −60 min. Once basal saline plus tritium infusions had been completed, one tail vein blood sample was drawn to obtain specific 3H activity. Two-hour hyperinsulinemic-euglycemic clamp studies were initiated by constant tracer infusion at a rate of 0.0167 μCi/min plus insulin (8 mU · kg−1 · min−1) that was started at t = 0 simultaneously with a variable glucose (50% wt/vol) infusion. Glucose infusion rates (GINFs) were adjusted by taking readings with droplets of blood and making necessary pump rate corrections until a steady-state blood glucose level of 150 mg/dl was reached. Final blood samples (25 μl) were drawn immediately upon completion of clamps and spun (8,000 rpm/4°C). Plasma samples (10 μl) were treated with 0.3 N zinc sulfate neutralized with barium hydroxide to remove unwanted protein. Deproteinated samples were dried for 12 h at 42°C. Fully dehydrated 3H samples were dissolved into high-efficiency liquid scintillation counting fluid and counted on an LS 6500 multipurpose scintillation counter (Beckman, Fullerton, CA).
RNA preparation and messenger RNA quantification.
Total RNA was prepared from 30 mg of liver or muscle and from 100 mg of white adipose tissue using an RNeasy Mini Kit (Qiagen, Valencia, CA). RNA expression for TNFα, IL-6, IL-1β, F4/80, Gpr43, and m36B4 was determined by quantitative real-time PCR (qPCR) in a 384-well format on the Applied Biosystems 7900HT Sequence Detection System. The following primers and probes were used: m36B4 (forward primer, 5′-AGATGCAGCAGATCCGCAT-3′; reverse primer, 5′-GTTCTTGCCCATCAGCACC-3′; and probe, 5′-CGCTCCGAGGGAAGGCCG), TNFα (forward primer, 5′-GGCTGCCCCGACTACGT-3′; reverse primer, 5′-GACTTTCTCCTGGTATGAGATAGCAA-3′; and probe, 5′-CCTCACCCACACCGTCAGCCG), IL-1β (forward primer, 5′-AATCTATACCTGTCCTGTGTAATGAAAGAC-3′; reverse primer, 5′-TGGGTATTGCTTGGGATCCA-3′; and probe, 5′-ACACCCACCCTGCAGCTGGAGAGT), F4/80 (forward primer, 5′-TTACGATGGAATTCTCCTTGTATATCA-3′; reverse primer, 5′-CACAGCAGGAAGGTGGCTATG-3′; and probe, 5′-CCATGTGGGTACAGTCATCTCCCTGGTATGT), IL-6 (forward primer, 5′-TCAATTCCAGAAACCGCTATGA-3′; reverse primer, 5′-CACCAGCATCAGTCCCAAGA-3′; and probe, 5′-CTCTCTGCAAGAGACTTCCATCCAGT), and Gpr43 (forward primer, 5′-GGGATCTGGGTCACATGCTTAT-3′; reverse primer, 5′-ATGTCAGACAGACGGGTACCAA-3′; and probe, 5′-CTCTGTGTCACCAGTCACTGGGTCTAGGAGAT). Taqman reactions took place in 9 μl of cocktail: 150 nmol/l m36B4 primer/probe, 150 nmol/l gene-specific primers, and 250 nmol/l gene probe plus 3 μl of RNA (10 ng/μl), using an Invitrogen SuperScript III qPCR kit in accordance with the manufacturer's instructions. Specific mRNA concentration was estimated from a linear standard curve generated with 100 ng/μl of freshly isolated wild-type RNA that had been serially diluted threefold. Quantities of specific mRNAs were normalized to m36B4 for each gene.
Detection of serine phosphorylated IRS-1/Akt by Western blotting.
Samples were prepared as described (9). Electrophoresis was performed using precast 4–12% BIS-TRIS NuPAGE gels (Invitrogen, Carlsbad, CA). Phospho-blots were generated with an anti-phospho insulin receptor substrate (IRS)-1 (serine 307) antibody (Upstate Biotechnology, Lake Placid, NY) for IRS-1 or an anti-phospho Akt (serine 473) antibody (Cell Signaling, Beverly, MA) for Akt. Primary antibodies were used at 1:1,000 dilution. Western blots were detected with a horseradish peroxidase–linked anti-rabbit secondary antibody (Santa Cruz, CA) diluted 1:10,000.
Liver histological analysis.
Paraffin-embedded or frozen livers were sliced into 5-μm sections and stained with hematoxylin and eosin or Oil Red O, respectively, and hepatosteatosis was determined as described (9).
Treatment with recombinant Mstn.
Mice received 0.4 μg/day of recombinant Mstn (R&D Systems, Minneapolis, MN) or placebo. Placebo was 100 μl of PBS. Recombinant GDF-8 was diluted in 100 μl of PBS and administered by subcutaneous injections. Injections were given twice daily at 8:00 a.m. and 3:00 p.m. each day for 5 days.
Calculations and statistical analysis.
Physical activity was calculated by counting beam breaks in X and Y directions. Glucose disposal rate (GDR) and hepatic glucose production (HGP) were calculated using Steele's equation (10). Oxygen utilization (Vo2) was determined from the equation Vo2 = Vio2i − VoO2o, and respiratory exchange ratio was calculated as VCO2/ Vo2. Heat (CV × Vo2) was calculated from an estimation of the ingested caloric value (CV) of food based on respiratory efficiency ratio (RER). Calculations for oxygen consumption, heat production, and substrate utilization were all performed automatically by OxyMaxWin software version 4.11. Total peak areas under the glucose curve (AUCg) and insulin curve (AUCi) were calculated by taking the sum of three to five individually fitted triangles that had been inserted under curves from baseline. Homeostasis model assessment of insulin resistance (HOMA-IR) was calculated by multiplying AUCg and AUCi. All data were statistically analyzed by ANOVA and t tests, as appropriate. Statistical differences were considered significant at P value < 0.05.
RESULTS
Mstn gene mutation caused leanness.
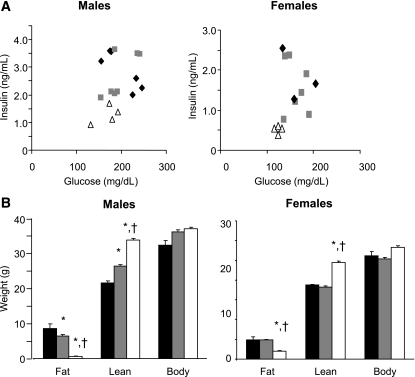
In a forward genetic screen using ENU as the mutagen we identified a family of mice that remained lean with low insulin despite high-fat feeding (Fig. 1A and B). A genome-wide scan using SNP markers in four affected and two unaffected mice identified a 30-Mb interval on chromosome 1 inherited with the low-fat phenotype and containing the Mstn gene. Sequencing the Mstn gene revealed a T→C transition in the second intron two base pairs downstream of exon 2, a position conserved in almost all vertebrate introns (11), which we refer to as the lean (Ln) allele of Mstn (MstnLn). Homozygous mutant males had lower basal insulin and homozygous mutant females had lower basal glucose and insulin than their heterozygous mutant or wild-type littermates (Fig. 1A). Both male and female 4-month-old MstnLn/Ln mice that had been weaned onto an HFD had significantly higher lean mass and lower fat mass than their Mstn+/Ln or MstntLn/Ln littermates (Fig. 1B). Mstn+/Ln males had a lean mass intermediate to MstnLn/Ln and Mstn+/Ln. Female HFD-fed mice that were homozygous for the ENU-induced mutation in Mstn had increased lean mass and decreased fat compared with heterozygotes. Heterozygous and wild-type female mice displayed similar whole-body compositions on the HFD. By 4 months of age, MstnLn/Ln males had a greater amount of lean mass and substantially less fat than females (Table 1). HFD-fed mutants had ∼40% more total body fat mass compared with those on the standard diet. Both male and female HFD-fed Mstn mutant mice were significantly (P < 0.05) increased in their total lean mass by ∼10 or 20% compared with mice maintained on the standard diet.
FIG. 1.
Basal plasma glucose and insulin (A) and body composition (means ± SE) (B) in MstnLn family mice weaned onto an HFD. Significantly different from wild-type (*) or heterozygous (†) littermates, P < 0.05. A and B: ▵, MstnLn/Ln; ▩, Mstn+/Ln; ♦, Mstn+/+. C and D: ■, Mstn+/+; ▩, Mstn+/Ln; □, MstnLn/Ln.
TABLE 1.
Body composition of 4-month-old mice after being weaned onto HFD or standard diet
| n | Weight (g) |
|||
|---|---|---|---|---|
| Fat | Lean | Body | ||
| Male | ||||
| Mstn+/+ genotype | ||||
| HFD | 10 | 8.2 ± 1.39*† | 21.9 ± 0.69* | 32.3 ± 1.37*† |
| Standard diet | 7 | 3.2 ± 0.53 | 21.7 ± 1.21 | 28.3 ± 1.45 |
| Mstn+/Ln genotype | ||||
| HFD | 34 | 6.4 ± 0.43*‡ | 26.5 ± 0.43*‡ | 36.3 ± 0.46*‡ |
| Standard diet | 5 | 3.1 ± 0.33 | 23.8 ± 0.47 | 30.3 ± 0.68 |
| MstnLn/Ln genotype | ||||
| HFD | 28 | 0.70 ± 0.11* | 33.6 ± 0.53*‡ | 36.9 ± 0.54*‡ |
| Standard diet | 8 | 0.45 ± 0.08 | 27.2 ± 0.68 | 29.5 ± 0.68 |
| Female | ||||
| Mstn+/+ genotype | ||||
| HFD | 6 | 5.0 ± 0.47† | 18.2 ± 0.28 | 25.7 ± 0.61† |
| Standard diet | 8 | 2.0 ± 0.07 | 17.7 ± 0.32 | 22.1 ± 0.42 |
| Mstn+/Ln genotype | ||||
| HFD | 15 | 4.9 ± 0.33† | 18.8 ± 0.28 | 26.2 ± 0.51† |
| Standard diet | 9 | 2.3 ± 0.14 | 19.1 ± 0.36 | 23.6 ± 0.47 |
| MstnLn/Ln genotype | ||||
| HFD | 8 | 1.99 ± 0.14† | 24.3 ± 0.44† | 28.2 ± 0.41‡ |
| Standard diet | 6 | 1.21 ± 0.06 | 22.1 ± 0.41 | 24.9 ± 0.46 |
Data are means ± SE.
*P < 0.05 vs. HFD female mice;
†P < 0.05;
‡P < 0.01 vs. mice of the same sex and genotype on standard diet.
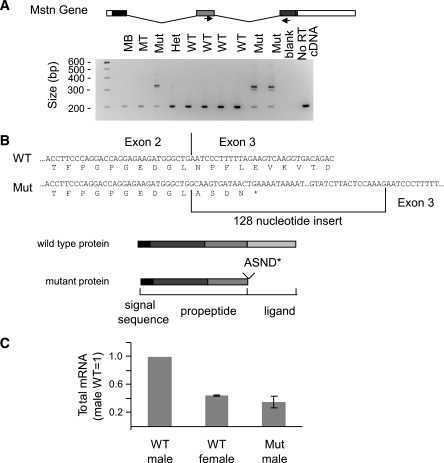
The presence of an ENU-induced mutation at a highly conserved position of a splice donor suggests that the mutation may be exerting its effects through abnormal splicing. We therefore examined the Mstn mRNA by reverse transcription and PCR amplification of the region surrounding the junction of exons 2 and 3. RT-PCR of mRNA from wild-type muscle yielded the expected product of 204 bp (Fig. 2A). The mRNA from mutant animals, however, gave rise to an additional, larger RT-PCR product. In heterozygotes, both products are present, though the smaller, wild-type product predominates. Sequencing of the larger RT-PCR product from mutant muscle revealed a 128-bp insert at what would normally be the junction between exons 2 and 3 (Fig. 2B). This insertion encodes an additional four amino acids before a premature stop codon (ASDNX). This mutant mRNA is predicted to encode a truncated protein containing the Mstn signal sequence and propeptide but lacking the ligand portion of the molecule. In addition to this abnormal splicing product, the mRNA is also reduced in abundance by ∼60% (Fig. 2C).
FIG. 2.
Molecular characterization of the MstnLn allele. A: RT-PCR of Mstn mRNA from skeletal muscle of wild-type and heterozygous and homozygous mutant animals. Top: Schematic representation of the Mstn gene. Exons are depicted as boxes and introns (not to scale) as lines. Arrows indicate positions of primers. Bottom: Agarose gel of the RT-PCR products of mRNA from C2C12 myoblasts (MB), C2C12 myotubes (MT), Mstn+/+ muscle (WT), Mstn+/Ln muscle (Het), and MstnLn/Ln muscle (Mut). B: Sequence of the Mstn mRNA from muscle of wild-type and MstnLn/Ln animals and the proteins predicted to be encoded by the respective mRNAs. C: Mstn mRNA abundance, as measured by quantitative PCR, in samples of wild-type and mutant muscle.
Reduced serum lipids in 6-h–fasted HFD-fed MstnLn/Ln mice.
Plasma cholesterol and triglyceride levels in male HFD-fed MstnLn/Ln mice were decreased from 15 to 20% (P < 0.05) compared with HFD-fed heterozygous and wild-type controls (Table 2). We detected no decreases in serum cholesterol or triglyceride levels for female HFD-fed MstnLn/Ln mice compared with female heterozygous or wild-type mice. An HFD raised plasma FFA levels in fasted male and female Mstn+/+, Mstn+/Ln, and MstnLn/Ln mice (Table 2). There were no detectable differences in basal plasma FFA among 6-h–fasted HFD-fed Mstn+/+ and Mstn+/Ln and MstnLn/Ln mice. Insulin levels were decreased by 3.5- and 2.5-fold (P < 0.05) in male and female HFD-fed MstnLn/Ln mice, respectively, compared with Mstn+/+ and Mstn+/Ln mice.
TABLE 2.
Plasma lipids and insulin in 4-month-old male and female Mstn+/+, Mstn+/Ln, and MstnLn/Ln mice weaned on HFD or standard diet
| Total cholesterol (mg/dl) | HDL cholesterol (mg/dl) | Triglycerides (mg/dl) | FFAs (mmol/l) | Insulin (ng/ml) | |
|---|---|---|---|---|---|
| Males | |||||
| Mstn+/+ HFD | 291.5 ± 27.6 | 124.6 ± 13.0 | 118.5 ± 12.8 | 1.44 ± 0.19 | 2.82 ± 0.32 |
| Mstn+/− HFD | 231.0 ± 15.0 | 99.5 ± 4.0* | 107.5 ± 5.2* | 1.42 ± 0.04* | 2.99 ± 0.21* |
| Mstn−/− HFD | 184.0 ± 13.9†‡§ | 86.9 ± 2.6†‡§ | 84.5 ± 3.0†‡ | 1.40 ± 0.07 | 0.83 ± 0.08†‡ |
| Mstn+/+ standard diet | 85.0 ± 6.2 | 44.0 ± 2.7 | 83.0 ± 6.0 | 0.88 ± 0.05 | 0.87 ± 0.44 |
| Mstn+/− standard diet | 100.7 ± 3.2 | 47.0 ± 1.7 | 84.4 ± 3.6 | 0.84 ± 0.05 | 1.05 ± 0.38 |
| Mstn−/− standard diet | 72.4 ± 4.7 | 49.3 ± 1.8 | 78.0 ± 4.4 | 1.23 ± 0.09 | 0.59 ± 0.07 |
| Females | |||||
| Mstn+/+ HFD | 237.8 ± 30.8 | 88.2 ± 10.3 | 99.0 ± 15.5 | 1.42 ± 0.12 | 1.43 ± 0.22 |
| Mstn+/− HFD | 207.0 ± 13.2 | 76.1 ± 2.4 | 81.3 ± 4.9 | 1.28 ± 0.03 | 1.61 ± 0.20 |
| Mstn−/− HFD | 173.6 ± 17.1§ | 79.9 ± 2.8§ | 83.1 ± 4.9 | 1.41 ± 0.04 | 0.62 ± 0.05†‡ |
| Mstn+/+ standard diet | 70.8 ± 4.5 | 29.3 ± 1.4 | 65.1 ± 2.0 | 0.72 ± 0.03 | 0.23 ± 0.06 |
| Mstn+/− standard diet | 69.8 ± 2.8 | 31.2 ± 0.9 | 69.1 ± 2.3 | 0.81 ± 0.04 | 0.19 ± 0.12 |
| Mstn−/− standard diet | 71.5 ± 7.3 | 39.4 ± 2.3 | 69.3 ± 3.4 | 1.16 ± 0.08 | 0.56 ± 0.02 |
Data are means ± SE.
*P < 0.05 vs. HFD Mstn+/Ln females;
†P < 0.05 vs. HFD Mstn+/+;
‡P < 0.05 vs. HFD Mstn+/Ln;
§P < 0.05 vs. standard diet MstnLn/Ln mice.
Reduced adipokines and TNFα in MstnLn/Ln mice.
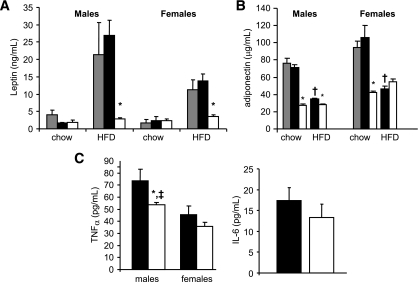
Compared with HFD-fed controls (Mstn+/+ and Mstn+/Ln), leptin levels were decreased by 3.4- and 9.7-fold (P < 0.05) in female and male HFD-fed MstnLn/Ln mice, respectively (Fig. 3A). Adiponectin levels in standard diet–fed MstnLn/Ln mice were significantly (P < 0.05) decreased by two- to threefold compared with Mstn+/+ or Mstn+/Ln mice (Fig. 3B). HFD-fed MstnLn/Ln males were decreased in plasma adiponectin, while there was a nonsignificant tendency for female HFD-fed MstnLn/Ln mice to exhibit an increase in adiponectin compared with HFD-fed Mstn+/Ln mice. Plasma TNFα levels were decreased ∼40% in male HFD-fed MstnLn/Ln mice compared with HFD-fed Mstn+/Ln mice. Males exhibited greater plasma TNFα levels than females. We detected no sex differences for plasma IL-6 levels.
FIG. 3.
Adipokines were decreased in homozygous Mstn mutant animals. A: Leptin. B: Adiponectin. C: Proinflammatory cytokines. Data are shown as means ± SE for males (n = 8–9 per genotypye) and females (n = 8–12 per genotype). *Significantly different from controls (Mstn+/+ and Mstn+/Ln) of the same sex (P < 0.05). †Significantly different from standard diet–fed mice of the same sex and genotype (P < 0.05). ‡Significantly different from females of the same genotype. ▩, Mstn+/+; ■, Mstn+/Ln; □, MstnLn/Ln.
Improved whole-body insulin sensitivity in male and female HFD-fed MstnLn/Ln mice.
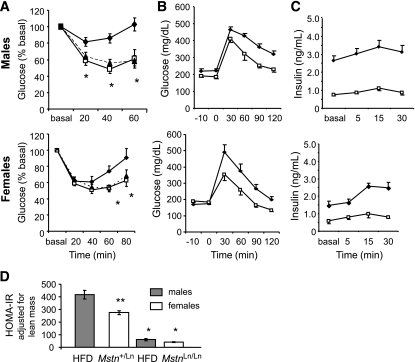
We saw an increase in basal insulin of standard diet–fed MstnLn/Ln females compared with Mstn+/+ controls, but this did not reach statistical significance (Table 2). However, basal insulin levels were statistically similar between Mstn+/+ and Mstn+/Ln for HFD-fed mice of both sexes. Furthermore, HFD-fed Mstn+/Ln animals had similar body weights to HFD-fed MstnLn/Ln animals (Fig. 1). We therefore compared Mstn+/Ln and MstnLn/Ln mice in our HOMA, glucose and insulin tolerance tests, and hyperinsulinemic-euglycemic clamp studies in order to avoid complications due to different body weights of the animals being compared. Basal insulin resistance predicted by HOMA (insulin × glucose) was improved for both HFD-fed male MstnLn/Ln mice (P < 0.05) (Mstn+/Ln = 725.4 ± 29.2; MstnLn/Ln = 134.9 ± 5.0) and HFD-fed female MstnLn/Ln mice (P < 0.05) (Mstn+/Ln = 207.9 ± 3.6; MstnLn/Ln = 86.6 ± 3.0). In response to a direct insulin challenge, HFD-fed Mstn+/Ln males showed elevated (P < 0.05) blood glucose levels at 20, 40, and 60 min compared with MstnLn/Ln mice (Fig. 4A). In HFD-fed Mstn+/Ln females, glucose was significantly elevated at 60 (P < 0.05) and 80 (P < 0.05) min compared with MstnLn/Ln females (Fig. 4A). Both male and female HFD-fed MstnLn/Ln mice showed similar insulin response curves compared with sex-appropriate, standard diet–fed MstnLn/Ln mice (Fig. 4A). Further, both sexes of HFD-fed MstnLn/Ln mice proved to be glucose tolerant (Fig. 4B) and were markedly reduced in plasma insulin after glucose loading compared with sex-matched HFD-fed Mstn+/Ln controls (Fig. 4C). Postprandial insulin resistance, when examined after adjustment for lean mass, proved to be consistent, with male HFD-fed Mstn+/Ln > female HFD-fed Mstn+/Ln > male HFD-fed MstnLn/Ln ≥ female HFD-fed MstnLn/Ln mice (Fig. 4D).
FIG. 4.
Insulin resistance was normalized in HFD-fed homozygous Mstn mutant animals to levels of standard diet–fed mice. A: Insulin tolerance test. B and C: Glucose tolerance test. ♦, HFD Mstn+/Ln; □, HFD MstnLn/Ln; ▴, standard diet MstnLn/Ln. HFD blood glucose was monitored during the glucose tolerance test (B) or insulin measured thereafter (C). Data are shown as means ± SE for males (n = 8) and females (n = 6). D: The HOMA-IR was calculated from the glucose tolerance data as described in research design and methods. Insulin resistance was adjusted for lean mass compared with male heterozygous mice. Level of insulin resistance was different at P < 0.01 compared with same sex Mstn+/Ln (*) or males Mstn+/Ln (**). Bars represent the means ± SE of insulin resistance calculated from AUCs.
Protected whole-body, muscle, and liver insulin sensitivity after a prolonged HFD in MstnLn/Ln mice.
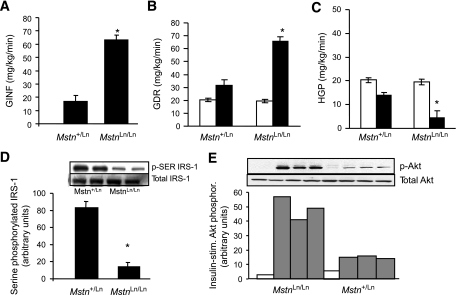
An HFD will continue to promote obesity and worsen insulin resistance over prolonged periods of time. To evaluate tissue insulin sensitivity after a prolonged HFD, we performed standardized hyperinsulinemic-euglycemic clamp studies in Mstn+/Ln and MstnLn/Ln mutant mice that had been maintained on an HFD until 10–11 months of age. At that time, body weights of mice differed between Mstn+/Ln and MstnLn/Ln mice as a result of further separating lean and fat masses by an HFD. Homozygous mutants (42.0 ± 1.3 g) were lower in weight (P < 0.05) than heterozygotes (51.5 ± 2.0 g). HFD-fed mutants had epididymal fat pads (0.87 ± 0.17 g) that weighed three- to fourfold less (P < 0.05) than HFD-fed heterozygotes (2.85 ± 0.18 g). Quadriceps from HFD-fed MstnLn/Ln mice (0.386 ± 0.02 g) weighed 1.4-fold more (P < 0.05) than those from Mstn+/Ln mice (0.289 ± 0.01 g). Gastrocnemius muscles from HFD-fed MstnLn/Ln mice (0.378 ± 0.03 g) weighed 1.4-fold more (P < 0.05) than those from Mstn+/Ln mice (0.278 ± 0.02 g). Whole-body changes in fat and lean mass were confirmed by nuclear magnetic resonance (data not shown). Whole-body insulin sensitivity was sustained in HFD-fed MstnLn/Ln mice, as demonstrated by markedly increased (P < 0.01) GINF for older HFD-fed MstnLn/Ln mice compared with age-matched Mstn+/Ln mice (Fig. 5A). GDR and HGP were calculated to ascertain effects on glucose homeostasis at the level of skeletal muscle and liver. Basal levels of GDR and HGP were similar between HFD-fed MstnLn/Ln and Mstn+/Ln mice. Insulin-stimulated levels were improved from 200 to 400% in HFD-fed MstnLn/Ln mice compared with HFD-fed Mstn+/Ln mice (Fig. 5B and C). Measurements with tissue extracts made by Western blotting showed that insulin action was improved for HFD-fed MstnLn/Ln mice by ∼400%. Serine-phosphorylated IRS-1 levels were decreased in liver of HFD-fed MstnLn/Ln mice (Fig. 5D), while insulin-stimulated Akt phosphorylation increased in HFD-fed MstnLn/Ln compared with HFD-fed Mstn+/Ln mice (Fig. 5E).
FIG. 5.
Whole-body, muscle, and liver insulin sensitivity of 11-month-old HFD-fed MstnLn/Ln mice was improved as determined by the hyperinsulinemic-euglycemic clamp method. A: Rate of glucose infusion needed to stabilize glycemia at 150 mg/dl over the final 30 min of a 2-h clamp (GINF). B: GDR. C: HGP. *P < 0.05 vs. HFD-fed Mstn+/Ln mice (n = 7–11). Data are means ± SE. □, basal; ■, insulin. D: Serine-phosphorylated IRS-1 in liver of homozygous and heterozygous mutant mice. The graphed data are means ± SE (n = 4 per genotype). E: Insulin-stimulated Akt phosphorylation in liver of homozygous and heterozygous mutant mice. □, basal; ▩, insulin.
Reduced inflammation in older, lean HFD-fed MstnLn/Ln mice.
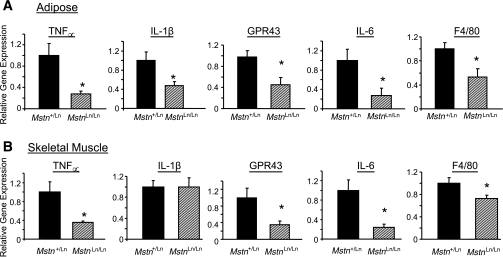
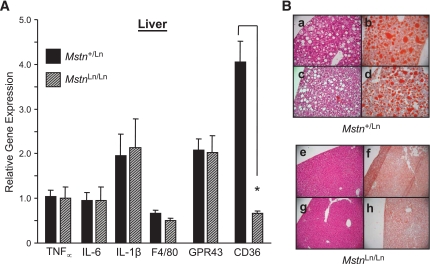
Tissue levels of select cytokines known to be upregulated by the endotoxemic effects of an HFD (12) and found to be increased directly in cultured macrophages upon stimulation with lipopolysaccharide (J.J.W. and A. Gerken, unpublished observations) were quantified. Quantitative PCR analysis revealed Tnf∝, Il6, Il1b, F4/80, and Gpr43 gene expression to be reduced (P < 0.05) from 50 to 75% in abdominal fat of lean male HFD-fed MstnLn/Ln mice compared with obese HFD-fed Mstn+/Ln males (Fig. 6A). Also, Tnf∝, Il6, F4/80, and Gpr43, but not Il1b, were reduced (P < 0.05) from 50 to 75% in skeletal muscles of lean male HFD-fed MstnLn/Ln mice compared with obese HFD-fed Mstn+/Ln males (Fig. 6B). Figure 7 shows that the relative gene expression levels of proinflammatory cytokines between Mstn+/Ln and MstnLn/Ln mice were similar in liver. CD36, an abundantly expressed fatty acid transporter, was decreased in liver from 70 to 90% in HFD-fed, lean MstnLn/Ln mice compared with Mstn+/Ln controls.
FIG. 6.
Proinflammatory cytokine production in fat and muscle of HFD-fed male MstnLn/Ln and Mstn+/Ln mice. The mRNA levels for Tnfα, Il6, IL1β, F4/80, and Gpr43 genes in abdominal fat (A) or quadriceps muscle (B) of male mice maintained long term on an HFD were measured by quantitative PCR (n = 6 per genotype). Values were normalized to the amount of mRNA found in control (Mstn+/Ln) tissue. *Significantly different from Mstn+/Ln (P < 0.05).
FIG. 7.
Hepatic Tnfα, Il6, Il1β, F4/80, and Gpr43 gene expression, lipid accumulation, and pathology. A: mRNA for cellular markers of inflammation was measured by qPCR in liver samples from MstnLn/Ln and Mstn+/Ln mice (n = 6 per genotype). B: Hemotoxylin and eosin (a, c, e, and g) or Oil Red O (b, d, f, and h) staining of liver sections dissected from Mstn+/Ln and MstnLn/Ln animals. (A high-quality representation of this figure is available in the online issue.)
Reduced hepatic lipid accumulation in HFD-fed MstnLn/Ln mice.
Dysregulation of HGP could have arisen in Mstn+/Ln mice from abnormal lipid accumulation in hepatocytes. To identify liver pathology, we examined samples from heterozygous and mutant mice obtained over periods of up to 11 months. Visual inspections of liver sections permitted by staining with hematoxylin and eosin or Oil Red O showed that there were numerous large vacuoles and lipid droplets present in the tissues of prolonged HFD-fed Mstn+/Ln mice. Livers of 10- to 11-month-old MstnLn/Ln mice showed no evidence of hepatosteatosis after an HFD (Fig. 7B).
Insulin resistance upon short-term Mstn treatment.
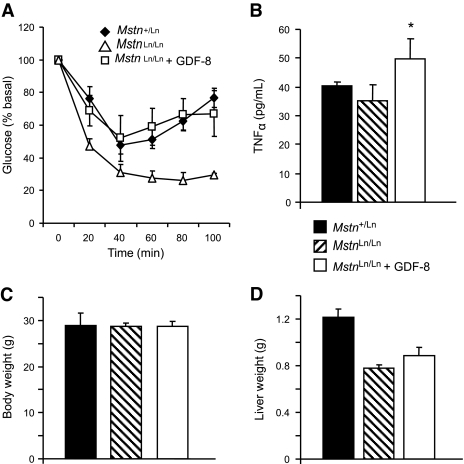
To determine whether Mstn could induce insulin resistance, we studied females of similar body size that were treated with Mstn or placebo. Mstn-treated mice became insulin resistant relative to placebo-treated females (Fig. 8A) and had increased plasma TNFα levels (Fig. 8B). Treatment did not measurably affect body weights (Fig. 8C) or body composition. Unlike obesity, short-term Mstn treatment did not increase liver weights of mice (Fig. 8D).
FIG. 8.
GDF-8 treatment studies. A: Insulin resistance in HFD-fed Mstn-treated (□) or untreated (▵) female MstnLn/Ln mice. Placebo-treated HFD-fed Mstn+/Ln females are shown for comparison (♦). B: Plasma TNFα levels in HFD-fed Mstn-treated (□) or untreated ( ) MstnLn/Ln female mice. Placebo-treated HFD-fed Mstn+/Ln females are shown for comparison (■). *P < 0.05 vs. untreated. C: Body weight. D: Liver weights. All data are shown as means ± SE with n = 5–6 per group.
DISCUSSION
Our studies in ENU-mutagenized animals demonstrate that a near-complete loss of Mstn signaling will protect male and female mice against obesity-induced insulin resistance. An antiobesity effect was not explained by heat production, food intake, oxygen utilization, RER, or physical activity in Mstn knockouts (6), and these parameters were all similar between HFD-fed MstnLn/Ln and Mstn+/Ln mice during 12-h light/dark cycles (online appendix Table [available at http://diabetes.diabetesjournals.org/cgi/content/full/db08-0245/DC1]). The results of our studies in HFD-fed Mstn+/Ln and MstnLn/Ln mice show that benefits afforded to muscle and liver persist well beyond their initial development, as demonstrated by 400% improvements in insulin-stimulated GDR and HGP in 11-month-old animals. Long-term protection of HFD-fed MstnLn/Ln mice against obesity-induced insulin resistance is associated with markedly lower levels of total and abdominal body fatness. Our insulin sensitivity measurements in MstnLn/+ and MstnLn/Ln mice by hyperinsulinemic-euglycemic clamp studies revealed that both muscle and liver insulin resistance is improved in HFD-fed MstnLn/Ln compared with Mstn+/Ln mice. Also, hepatic steatosis consequential of being weaned and sustained on an HFD is prevented over the long term in MstnLn/Ln mice. Proinflammatory cytokine production is also decreased, as demonstrated by a 50–75% decrease in Tnfα expression in adipose and muscle but not liver. Additionally, there is a 30–50% reduction in circulating TNFα levels in male animals, which are highly affected by the Mstn mutation, with greater quantities of muscle and fat compared with females. Furthermore, chronic treatment of HFD-fed female MstnLn/Ln mice with recombinant Mstn increases circulating TNFα levels and insulin resistance without eliciting a change in body or liver weights.
The Ln mutation disrupts the normal splice donor site in Mstn downstream of exon 2, and the mutant allele gives rise to both a normally spliced transcript and an abnormally spliced transcript, which includes another 128 bp downstream of exon 2 (MstnLn) mRNA. In wild-type mice, multiple processing steps generate active Mstn ligand, which binds activin type 2 receptors (ActRIIa and ActRIIb) (13), from its precursor (14). MstnLn mRNA encodes a truncated protein that contains signal sequence and propeptide but lacks the ligand portion of the molecule. Thus, the point mutation leads to production of an incomplete peptide that may inhibit the mature Mstn ligand. Furthermore, mutant Mstn mRNA is decreased, presumably by nonsense-mediated decay. Heterozygotes produce both wild-type and mutant inhibitory protein, so Mstn signaling is expected to be reduced as a consequence of the mutation by >50% compared with wild type, while homozygotes are expected to have no Mstn signaling. The concept of systemically regulated latent Mstn peptides by circulating polypeptide antagonists has recently been discussed (15). Interestingly, the 50–75% reduction to Mstn signaling predicted for heterozygotes can lead to increased lean mass and reduced fat without decreased hyperinsulinemia. In contrast, complete Mstn deficiency leads to a normalized plasma insulin levels, indicating that improvements to obesity-induced insulin resistance displayed by HFD-fed Mstn-deficient mice come from either growth independent or synergistic effects. Thus, the well-documented effect of Mstn on lean and fat mass development linked to obesity appears to be dissociated in HFD-fed heterozygous and homozygous mice at some level from effects on whole-body insulin resistance. To further exemplify this, females homozygous for MstnLn also experienced an alleviation of hyperinsulinemia. Thus, Mstn deficiency led to a more dramatic effect on lean and fat mass accumulation in males than it did in females, but HOMA-IR levels in basal and challenged states were normalized for both male and female HFD-fed MstnLn/Ln mice. To explore more directly whether Mstn is linked to insulin sensitivity independent of its effects on body composition, we tested MstnLn/Ln mice that had been chronically administered Mstn. Mature MstnLn/Ln animals treated with exogenous Mstn for up to 5 days show signs of whole-body insulin resistance.
Circulating adiponectin levels decrease with diet-induced obesity in Mstn+/Ln mice, consistent with numerous studies showing an inverse relationship between obesity and circulating adiponectin in mice, monkeys, and humans (16). We further show that a near-complete loss of Mstn function (MstnLn/Ln) leads to a reduction in circulating adiponectin in standard diet–fed animals that is not affected by high-fat feeding. Consistent with our results, Zhao et al. (17) showed that transgenic overexpression of the inhibitory Mstn propeptide led to a decrease in circulating adiponectin in mice fed a normal-fat diet, but they also showed that circulating adiponectin went up in transgenic animals fed a high-fat diet compared with either wild-type mice on an HFD or transgenic mice on a normal-fat diet. In a subsequent report, Suzuki et al. (18) showed that the increase in circulating adiponectin in transgenic, high-fat–fed mice is due to increased expression in epididymal fat pads. In addition to upregulating adiponectin expression, Mstn propeptide transgenic mice also upregulated Ppara and Pparg expression in white adipose tissue (18). Thus, it would appear that Mstn activity inhibits adipogenesis. The literature, however, is unclear on this point, with one group (5) reporting promotion of adipogeneis by Mstn in the mesenchymal multipotent stem cell line 10T1/2 and other groups (19,20) reporting inhibition of adipocyte differentiation of 3T3-L1 cells. The effect of Mstn on fat deposition in adult mice is also unclear, with one group (20) reporting a decrease and another (21) reporting no effect. In Fstl3 knockout mice, a decrease in visceral fat was attributed to increased Mstn activity (22). The controversy about the role of Mstn in adipogenesis and fat deposition notwithstanding, MstnLn/Ln mice represent a unique model in that the insulin sensitivity despite high-fat feeding does not seem to depend on adiponectin.
Noteworthy, the protection of whole-body insulin sensitivity persists during a prolonged HFD and coincides with improved liver insulin resistance and decreased hepatic lipid accumulation and steatosis. There is also a differential effect on gene expression, as inflammatory genes were selectively decreased in muscle and fat but not liver. Western blotting liver extracts revealed hepatic insulin action to be markedly improved. Thus, we found insulin-stimulated Akt-1 phosphorylation is enhanced, while IRS-1 serine phosphorylation is diminished. These findings are consistent with improvements to hepatic insulin sensitivity in HFD-fed MstnLn/Ln mice.
We found that homozygous Mstn mutation led to robustly decreased Cd36 gene expression in liver, decreased Tnfα, Il6, F4/80, and Gpr43 gene expression in fat and muscle, and decreased Il1b gene expression in fat compared with the heterozygous MstnLn mutation. F4/80 is expressed in macrophages and serves as a surrogate for macrophage infiltration of tissue. Gpr43 is also expressed in macrophages, but, unlike F4/80, it is upregulated when macrophages are stimulated with lipopolysaccharide in vitro (data not shown). Thus, Gpr43 serves as a marker of macrophage activation. While a reduction in Tnfα, Il6, or Gpr43 in muscle alone could have improved insulin sensitivity in lean MstnLn/Ln mice, the tissue-selective reductions in proinflammatory genes may indicate that cross-talk mediated through cytokines is turned down and perhaps suggest reduced TNFα production in muscle and fat protects liver against obesity-induced insulin resistance. Since obesity is associated with increases to resident macrophage cells in insulin-sensitive tissues, muscle and fat could contribute to expanding pools of inflammatory cytokines that may be elevated and thereby subsequently affect liver, once immune cell markers of inflammation increase. Along with plasma TNFα levels, Tnfα, F4/80, and Gpr43 expression all markedly decrease by 50–75% in both muscle and fat of MstnLn/Ln mice compared with Mstn+/Ln mice. Further, we see that chronic Mstn peptide treatment of naïve mice markedly elevates TNFα. The increases in lean animals receiving Mstn compared with placebo suggest that TNFα production is directly influenced by Mstn treatments. While it is possible that several mediators of insulin resistance may be affected by Mstn, TNFα is increased directly by Mstn treatments that do not alter body or tissue weights, supporting our hypothesized connection of Mstn to proinflammatory cytokines. It also seems possible that by increasing TNFα production, hepatic insulin resistance might develop along with ectopic fat storage, possibly through select effects on FFA uptake in hepatocytes. Ruan et al. (23) showed that continuous administration of TNFα for 1 day leads to insulin resistance and that there are tissue-selective increases in CD36 gene expression in liver, but not fat, of mature lean rats. Koonen et al. (24) found that adenovirus-mediated overexpression of liver CD36 gene expression is sufficient to induce lipid accumulation in hepatocytes of standard diet–fed mice and suggested that postnatal development of dyslipidemia associated with DIO could be a consequence of liver CD36 upregulation. Hence, Mstn production could lead to increases in inflammatory signals, such as TNFα, that promote lipid storage in liver and induce insulin resistance.
Our results support the idea that obesity-induced insulin resistance indirectly develops from adiposity and muscle mass. A recently published study by Izumiya et al. (25) reported that when mice are exhibiting a high lean/low–body fat phenotype, due to constitutively active Akt-1 leading to modestly elevated amounts of muscle, increased metabolic rates, and strikingly greater numbers of glycolytic type 2 muscle fibers, then fat oxidation occurs in liver. Izumiya et al. speculate that type 2 muscle fibers release myokines that oppose detrimental actions of adipocytokines on liver. Like animals of this study, Mstn gene knockout mice are reported to have greater numbers of type 2 muscle fibers (26). Yet, Mstn-deficient mice have normal metabolic rates but are still protected against liver insulin insensitivity. Also, because type 2 fibers would be expected to affect glucose uptake, Mstn-deficient mice could be affected by glucose utilization, too, due to mass action, which attenuates hyperglycemia. Muscle glucose uptake may be affecting to MstnLn/Ln mice, since there are differences in glucose tolerance between HFD-fed wild-type mice and HFD-fed Mstn+/Ln mice (online appendix). Interestingly, there are no overt differences in plasma insulin levels, suggesting glucose tolerance has secondary importance.
In conclusion, these results support an inflammatory role for Mstn expression and show how this could occur. Knowing that muscle is an abundant tissue, susceptible to chronic inflammation and of great importance to whole-body insulin sensitivity, even modest amounts of chronic Mstn signaling may lead to inflammatory cytokine production, insulin resistance, and liver steatosis. Therefore, we conclude that severe Mstn deficiency decreases inflammation in muscle and this protects against obesity-induced insulin resistance.
Supplementary Material
ACKNOWLEDGMENTS
No potential conflicts of interest relevant to this article were reported aside from those listed in the affiliations footnote.
We thank Lacey Kischassey for breeding and care of all mice, Sandy Bohan and Andrea Gerken for technical assistance, and Brian Steffy and Tim Wiltshire for mapping, sequencing, and genotyping.
Footnotes
The costs of publication of this article were defrayed in part by the payment of page charges. This article must therefore be hereby marked “advertisement” in accordance with 18 U.S.C. Section 1734 solely to indicate this fact.
REFERENCES
- 1.Ji S, Losinski RL, Cornelius SG, Frank GR, Willis GM, Gerrard DE, Depreux FF, Spurlock ME: Myostatin expression in porcine tissues: tissue specificity and developmental and postnatal regulation. Am J Physiol 1998; 275: R1265– R1273 [DOI] [PubMed] [Google Scholar]
- 2.McPherron AC, Lawler AM, Lee SJ: Regulation of skeletal muscle mass in mice by a new TGF-beta superfamily member. Nature 1997; 387: 83– 90 [DOI] [PubMed] [Google Scholar]
- 3.Lee SJ, McPherron AC: Myostatin and the control of skeletal muscle mass. Curr Opin Genet Dev 1999; 9: 604– 607 [DOI] [PubMed] [Google Scholar]
- 4.Rebbapragada A, Benchabane H, Wrana JL, Celeste AJ, Attisano L: Myostatin signals through a transforming growth factor beta-like signaling pathway to block adipogenesis. Mol Cell Biol 2003; 23: 7230– 7242 [DOI] [PMC free article] [PubMed] [Google Scholar]
- 5.Artaza JN, Bhasin S, Magee TR, Reisz-Porszasz S, Shen R, Groome NP, Meerasahib MF, Gonzalez-Cadavid NF: Myostatin inhibits myogenesis and promotes adipogenesis in C3H 10T(1/2) mesenchymal multipotent cells. Endocrinology 2005; 146: 3547– 3557 [DOI] [PubMed] [Google Scholar]
- 6.McPherron AC, Lee SJ: Suppression of body fat accumulation in myostatin-deficient mice. J Clin Invest 2002; 109: 595– 601 [DOI] [PMC free article] [PubMed] [Google Scholar]
- 7.Lloyd DJ, Bohan S, Gekakis N: Obesity, hyperphagia and increased metabolic efficiency in Pc1 mutant mice. Hum Mol Genet 2006; 15: 1884– 1893 [DOI] [PubMed] [Google Scholar]
- 8.Wiltshire T, Pletcher MT, Batalov S, Barnes SW, Tarantino LM, Cooke MP, Wu H, Smylie K, Santrosyan A, Copeland NG, Jenkins NA, Kalush F, Mural RJ, Glynne RJ, Kay SA, Adams MD, Fletcher CF: Genome-wide single-nucleotide polymorphism analysis defines haplotype patterns in mouse. Proc Natl Acad Sci U S A 2003; 100: 3380– 3385 [DOI] [PMC free article] [PubMed] [Google Scholar]
- 9.Fiorini RN, Kirtz J, Periyasamy B, Evans Z, Haines JK, Cheng G, Polito C, Rodwell D, Shafizadeh SF, Zhou X, Campbell C, Birsner J, Schmidt M, Lewin D, Chavin KD: Development of an unbiased method for the estimation of liver steatosis. Clin Transplant 2004; 18: 700– 706 [DOI] [PubMed] [Google Scholar]
- 10.Steele R: Influences of glucose loading and of injected insulin on hepatic glucose output. Ann N Y Acad Sci 1959; 82: 420– 430 [DOI] [PubMed] [Google Scholar]
- 11.Breathnach R, Chambon P: Organization and expression of eucaryotic split genes coding for proteins. Annu Rev Biochem 1981; 50: 349– 383 [DOI] [PubMed] [Google Scholar]
- 12.Cani PD, Amar J, Iglesias MA, Poggi M, Knauf C, Bastelica D, Neyrinck AM, Fava F, Tuohy KM, Chabo C, Waget A, Delmee E, Cousin B, Sulpice T, Chamontin B, Ferrieres J, Tanti JF, Gibson GR, Casteilla L, Delzenne NM, Alessi MC, Burcelin R: Metabolic endotoxemia initiates obesity and insulin resistance. Diabetes 2007; 56: 1761– 1772 [DOI] [PubMed] [Google Scholar]
- 13.Tsuchida K: Activins, myostatin and related TGF-beta family members as novel therapeutic targets for endocrine, metabolic and immune disorders. Curr Drug Targets Immune Endocr Metabol Disord 2004; 4: 157– 166 [DOI] [PubMed] [Google Scholar]
- 14.Thomas M, Langley B, Berry C, Sharma M, Kirk S, Bass J, Kambadur R: Myostatin, a negative regulator of muscle growth, functions by inhibiting myoblast proliferation. J Biol Chem 2000; 275: 40235– 40243 [DOI] [PubMed] [Google Scholar]
- 15.Lee SJ: Quadrupling muscle mass in mice by targeting TGF-beta signaling pathways. PLoS ONE 2007; 2: e789. [DOI] [PMC free article] [PubMed] [Google Scholar]
- 16.Berg AH, Combs TP, Scherer PE: ACRP30/adiponectin: an adipokine regulating glucose and lipid metabolism. Trends Endocrinol Metab 2002; 13: 84– 89 [DOI] [PubMed] [Google Scholar]
- 17.Zhao B, Wall RJ, Yang J: Transgenic expression of myostatin propeptide prevents diet-induced obesity and insulin resistance. Biochem Biophys Res Commun 2005; 337: 248– 255 [DOI] [PubMed] [Google Scholar]
- 18.Suzuki ST, Zhao B, Yang J: Enhanced muscle by myostatin propeptide increases adipose tissue adiponectin, PPAR-alpha, and PPAR-gamma expressions. Biochem Biophys Res Commun 2008; 369: 767– 773 [DOI] [PubMed] [Google Scholar]
- 19.Guo W, Flanagan J, Jasuja R, Kirkland J, Jiang L, Bhasin S: The effects of myostatin on adipogenic differentiation of human bone marrow-derived mesenchymal stem cells are mediated through cross-communication between Smad3 and Wnt/beta-catenin signaling pathways. J Biol Chem 2008; 283: 9136– 9145 [DOI] [PMC free article] [PubMed] [Google Scholar]
- 20.Zimmers TA, Davies MV, Koniaris LG, Haynes P, Esquela AF, Tomkinson KN, McPherron AC, Wolfman NM, Lee SJ: Induction of cachexia in mice by systemically administered myostatin. Science 2002; 296: 1486– 1488 [DOI] [PubMed] [Google Scholar]
- 21.Stolz LE, Li D, Qadri A, Jalenak M, Klaman LD, Tobin JF: Administration of myostatin does not alter fat mass in adult mice. Diabetes Obes Metab 2008; 10: 135– 142 [DOI] [PubMed] [Google Scholar]
- 22.Mukherjee A, Sidis Y, Mahan A, Raher MJ, Xia Y, Rosen ED, Bloch KD, Thomas MK, Schneyer AL: FSTL3 deletion reveals roles for TGF-beta family ligands in glucose and fat homeostasis in adults. Proc Natl Acad Sci U S A 2007; 104: 1348– 1353 [DOI] [PMC free article] [PubMed] [Google Scholar]
- 23.Ruan H, Miles PD, Ladd CM, Ross K, Golub TR, Olefsky JM, Lodish HF: Profiling gene transcription in vivo reveals adipose tissue as an immediate target of tumor necrosis factor-α: implications for insulin resistance. Diabetes 2002; 51: 3176– 3188 [DOI] [PubMed] [Google Scholar]
- 24.Koonen DP, Jacobs RL, Febbraio M, Young ME, Soltys CL, Ong H, Vance DE, Dyck JR: Increased hepatic CD36 expression contributes to dyslipidemia associated with diet-induced obesity. Diabetes 2007; 56: 2863– 2871 [DOI] [PubMed] [Google Scholar]
- 25.Izumiya Y, Hopkins T, Morris C, Sato K, Zeng L, Viereck J, Hamilton JA, Ouchi N, LeBrasseur NK, Walsh K: Fast/glycolytic muscle fiber growth reduces fat mass and improves metabolic parameters in obese mice. Cell Metab 2008; 7: 159– 172 [DOI] [PMC free article] [PubMed] [Google Scholar]
- 26.Girgenrath S, Song K, Whittemore LA: Loss of myostatin expression alters fiber-type distribution and expression of myosin heavy chain isoforms in slow- and fast-type skeletal muscle. Muscle Nerve 2005; 31: 34– 40 [DOI] [PubMed] [Google Scholar]
Associated Data
This section collects any data citations, data availability statements, or supplementary materials included in this article.


