

Abstract
Carboxylesterases hydrolyze chemicals containing such functional groups as a carboxylic acid ester, amide and thioester. The liver contains the highest carboxylesterase activity and expresses two major carboxylesterases: HCE1 and HCE2. In this study, we analyzed 104 individual liver samples for the expression patterns of both carboxylesterases. These samples were divided into three age groups: adults (≥ 18 years of age), children (0 days-10 years) and fetuses (82-224 gestation days). In general, the adult group expressed significantly higher HCE1 and HCE2 than the child group, which expressed significantly higher than the fetal group. The age-related expression was confirmed by RT-qPCR and Western immunoblotting. To determine whether the expression patterns reflected the hydrolytic activity, liver microsomes were pooled from each group and tested for the hydrolysis of drugs such as oseltamivir and insecticides such as deltamethrin. Consistent with the expression patterns, adult microsomes were ∼4 times as active as child microsomes and 10 times as active as fetal microsomes in hydrolyzing these chemicals. Within the same age group, particularly in the fetal and child groups, a large inter-individual variability was detected in mRNA (430 fold), protein (100 fold) and hydrolytic activity (127 fold). Carboxylesterases are recognized to play critical roles in drug metabolism and insecticide detoxication. The findings on the large variability among different age groups or even within the same age group have important pharmacological and toxicological implications, particularly in relation to pharmacokinetic alterations of ester drugs in children and vulnerability of fetuses and children to pyrethroid insecticides.
1. Introduction
Carboxylesterases constitute a class of enzymes that hydrolyze chemicals containing such functional groups as a carboxylic acid ester, amide and thioester [1]. These enzymes are known to play important roles in drug metabolism and insecticide detoxication. Two major human carboxylesterases (HCE1 and HCE2) are abundantly expressed in the liver, whereas HCE2 is predominately expressed in the gastrointestinal tract [1, 2]. In addition to the difference in tissue distribution, these two enzymes differ markedly in the hydrolysis of certain drugs. For example, HCE1, but not HCE2, rapidly hydrolyzes the anti-influenza viral agent oseltamivir [3, 4]. In contrast, HCE2, but not HCE1, rapidly hydrolyzes the anticancer agent irinotecan [5]. In addition to hydrolyzing numerous compounds, carboxylesterases catalyze transesterification. In the presence of ethyl alcohol, HCE1 effectively converts the anti-platelet agent clopidogrel (a methyl ester) into ethyl clopidogrel [4].
The expression of carboxylesterase is altered by xenobiotics and pathological conditions. In human primary hepatocytes, therapeutic agents such as dexamethasone and phenobarbital cause a slight or moderate induction of HCE1 and HCE2 [6]. Dexamethasone and phenobarbital also alter the expression of rat carboxylesterases [7]. However, the pattern of the alteration is different. Phenobarbital moderately induces rat carboxylesterases (hydrolase A and hydrolase B), whereas dexamethasone profoundly suppresses the expression of these enzymes [7]. Suppression also occurs in human primary hepatocytes treated with the pro-inflammatory cytokine interleukin-6 (IL-6), and the suppression is achieved by transcriptional repression [8]. More importantly, the IL-6 mediated suppression strongly alters cellular responsiveness to therapeutic agents such as clopidogrel, irinotecan, and oseltamivir [8]. Hydrolysis of clopidogrel represents inactivation. In contrast, hydrolysis of irinotecan and oseltamivir leads to the formation of therapeutically active metabolites thus represents activation [5, 9].
The expression of carboxylesterases is regulated in a developmental manner, and it seems likely that these enzymes are developmentally regulated in humans as well. One to two week old rats express no hydrolase A or B based on immunoblotting analysis [7]. Consistent with the low level expression of carboxylesterases, the intrinsic clearance of the pyrethroid deltamethrin through hydrolysis in 10-day old rats is only ∼3% of adult rats [10]. Even in 4-week old rats, the intrinsic clearance is less than half of that of adult rats [10]. In addition, young animals are generally much more sensitive to pesticides such as organophosphates and pyrethroids [11-13]. Carboxylesterases are known to protect against these chemicals by hydrolysis in the case of pyrethroids or scavenging mechanism in the case of organophoaphates. The developmental regulation of human carboxylesterases remains to be established. A previous report by Pope et. al. [14] observed that infants differ from adults in the expression and hydrolytic activity of carboxylesterases, but the difference was statistically insignificant [14]. The Pope's study, however, used a small number of samples and had only five samples for each group.
In the current study, we analyzed a total of 104 individual liver samples for the expression patterns of HCE1 and HCE2. These samples were grouped according to age: adults (>18 years old), children (0-10) and fetuses. Multiple experimental approaches were used including RT-qPCR, Western analysis and enzymatic assays. The fetuses expressed lower carboxylesterases than the children, and the children expressed lower carboxylesterases than the adults. Overall, the expression of both HCE1 and HCE2 showed a large inter-individual variability with the largest variability in the fetal group.
2. Materials and Methods
2.1. Chemicals and supplies
Acetaminophen, aspirin, naproxen, and salicylic acid were purchased from Sigma (St. Louis, MO). Clopidogrel and clopidogrel carboxylate were from ChemPacific (Baltimore, MD). Oseltamivir and osel-tamivir carboxylate were from Toronto Research Chemicals (Canada). Deltamethrin and permethrin were purchased from ChemService (West Chester, PA). Deltamethrin had a purity of 99%, and permethrin was from a batch that contained a mixture of cis- and trans-isomers at a ratio of 46 and 52%, respectively. TaqMan probes were from Applied Biosystems (Foster City, CA). The antibody against glyceradehyde-3-phosphate dehydrogenase (GAPDH) was from Abcam (Cambridge, MA). Unless otherwise specified, all other reagents were purchased from Fisher Scientific (Pittsburgh, PA).
2.2. Liver RNA and microsomal samples
A total of 104 RNA samples were used in this study and some of the RNA samples were matched with microsomes. Pure RNA samples were purchased from (ADMET Technologies (Durham, NC). Liver tissues were acquired from the National Disease Research Interchange (Philadelphia, PA), the Midwest Transplant Network (Westwood, KS), the University of Maryland Brain and Tissue Bank for Developmental Disorders (Baltimore, MD), and the University of Washington Central Laboratory for Human Embryology (Seattle, WA). Isolation of total RNA from the liver tissues was described previously [15, 16], and the quality was determined on an Experion RNA StdSens micro fluidic chip (Bio-Rad, Hercules, CA) or by electrophoresis. Microsomes of child and fetal livers were prepared by differential centrifugation as described previously [17]. Adult liver microsomes (individual samples) were from CellzDirect (Pittsboro, NC) and described previously [4]. The demographics of the RNA samples in each group are summarized in Table I. The use of the human samples was approved by the Institutional Review Board.
Table I. Demographic data for RNA samples.
| Group | n | M/F | CA | AA | H | Others | Unk |
|---|---|---|---|---|---|---|---|
| Fetus | 48 | 26/22 | 19 | 17 | 1 | 5 | 6 |
| Child | 34 | 15/19 | 21 | 8 | 3 | 2 | |
| Adult | 22 | 14/8 | 19 | 2 |
Abbreviations: M/F, Male/Female; CA, Caucasian-American; AA, African American; H, Hispanic; Unk, unknown.
2.3. Reverse transcription-quantitative polymerase chain reaction (RT-qPCR)
Total RNA (0.1 μg) was subjected to the synthesis of the first strand cDNA in a total volume of 25 μl with random primers and M-MLV reverse transcriptase. The reactions were conducted at 25°C for 10 min, 42°C for 50 min and 70°C for 10 min. The cDNAs were then diluted 6 fold and quantitative PCR was performed with TaqMan Gene Expression Assay (Applied Biosystems, Foster City, CA). The TaqMan assay identification numbers were: HCE1, Hs00275607_m1 (NM_001266); HCE2, Hs00187279_m1 (NM_198061); and polymerase (RNA) II, Hs01108291_m1 (NM_000937). It should be noted that the HCE1 probe could detect both HCE1A1 and HCE1A2 transcripts. The PCR amplification was conducted in a total volume of 20 μl containing universal PCR master mixture (10 μl), gene-specific TaqMan assay mixture (1 μl), and cDNA template (3 μl). The cycling profile was 50°C for 2 min, 95°C for 10 min, followed by 40 cycles of 15 s at 95°C and 1 min at 60 °C, as recommended by the manufacturer. Amplification and quantification were done with the Applied Biosystems 7900HT Real-Time PCR System. All samples were analyzed in triplicate and the signals were normalized to polymerase (RNA) II [18] and then expressed as relative levels of mRNA among all samples.
2.4. Western analysis
Microsomal proteins (1.5 μg) were resolved by 7.5% SDS-PAGE in a mini-gel apparatus and transferred electrophoretically to nitrocellulose membranes. After non-specific binding sites were blocked with 5 % non-fat milk, the blots were incubated with an antibody against HCE1, HCE2 and GAPDH, respectively. The preparation of the antibodies against HCE1 and HCE2 was described elsewhere [6]. The primary antibodies were subsequently localized with goat anti-rabbit IgG conjugated with horseradish peroxidase, and horseradish peroxidase activity was detected with a chemiluminescent kit (SuperSignal West Pico). The chemiluminescent signals were captured by a KODAK Image Station 2000 and the relative intensities were quantified by the KODAK 1D Image Analysis Software.
2.5. Enzymatic assays
All enzymatic assays were carried out at 37°C in a total volume of 100 μl. Pilot studies were performed to determine conditions (e.g., protein concentrations) to maintain the metabolism in the linear range. Generally, microsomes (20-80 μg protein) were prepared in 50 μl incubation buffer (phosphate buffer, 100 mM, pH 7.4; or Tris-HCl, 50 mM, pH 7.4) and then mixed with an equal volume of substrate solution (the same buffer). Hydrolysis of aspirin was performed in phosphate buffer, whereas hydrolysis of oseltamivir, deltamethrin and permethrin was carried out in Tris-HCl buffer. Aspirin was assayed at 1 mM, oseltamivir at 200 μM, both deltamethrin and permethrin at 100 μM. The incubations lasted for 10-60 min depending on a substrate, and the reactions were terminated with 150 μl of acetonitrile containing an internal standard (IS): acetaminophen (750 ng/ml) for aspirin, clopidogrel carboxylate (50 ng/ml) for oseltamivir, napronex (4 μg/ml) for deltamethrin and clopidogrel (33 μg/ml) for permethrin. The reaction mixtures were subjected to centrifugation for 15 min at 4°C (15,000 g). Hydrolysis of aspirin and oseltamivir was previously reported [3, 4]. It should be noted that various controls were performed such as 0-min incubation and incubation without microsomes.
2.6. Monitoring of hydrolysis by HPLC or LC-MS/MS
The hydrolysis of aspirin or pyrethroids was separated by High-performance liquid chromatography (HPLC) (Hitachi LaChrom Elite-300) with a Chromolith SpeedROD column RP-18e (Merck, Germany). The supernatants (10-30 μl) of the reaction mixtures were injected and separated by an isocratic for aspirin or gradient mobile phase for deltamethrin and permethrin. The isocratic mobile phase consisted of 12 % methanol and 0.25 % acetate acid at pH 3.9 [4]. The gradient mobile phase consisted of acetonitrile and 0.01% formic acid. The gradient was run at 20-50% acetonitrile (v/v) for 6 min, 50-80% for 3 min followed by 80-20% for 6 min. Both mobile phases were run at a flow rate of 2 ml/min. For aspirin, the formation of hydrolytic metabolite was monitored, whereas for deltamethrin and permethrin the disappearance of parent compounds was monitored by a diode array detector at 230 nm. All quantifications were performed using peak area ratios and calibration curves generated from the internal control. The calibration curve ranged from 2 to 300 μg/mL with good linearity for salicylic acid, 0.8 to 160 μg/mL for deltamethrin, and 0.6 to 120 μg/mL for permethrin.
The hydrolysis of oseltamivir was monitored by LC-MS/MS system (API 3200) as described previously [3]. Briefly, the supernatants of the incubation mixtures were separated isocratically using a mobile phase composition of 70:30% v/v acetonitrile : 0.05% v/v formic acid in deionized water maintained at a flow rate of 0.25 ml/min with a total run time of 6.0 min. Detection of the analytes was performed in positive ion mode using the mass transitions of m/z: 313.3 → 166.1 for oseltamivir, m/z: 285.2→138.0 for oseltamivir carboxylate and m/z: 308.2 → 152.0 for IS. Flow injection analysis was performed at a flow rate of 20 μl/min to obtain optimum source parameters. The following compound parameters were used for oseltamivir, oseltamivir carboxylate and IS, respectively. Declustering potential: +5, +5 and +30 V, Focusing potential: +360 V each, Entrance potential: +8 V each, Collision cell entrance potential: +20 V each, Collision energy: +25, +25 and +30 V and Collision cell exit potential: +7 V each. The optimum source parameters that gave the highest oseltamivir intensity were Curtain gas: 10 psi, Collision gas: 4 psi, Ion spray voltage: +5500 V, Temperature: 450°C, Ion source gas1: 25 psi and ion source gas2: 85 psi. Integration of the peaks was performed by manual baseline adjustment using the ANALYST SP version 1.2 software (Applied Biosystems). All quantifications were performed using peak area ratios and calibration curves consisted of oseltamivir or oseltamivir carboxylate to clopidogrel carboxylic acid concentration ratios plotted against the oseltamivir or oseltamivir carboxylate to clopidogrel carboxylic acid peak area ratios. The calibration curve ranged from 1 to 250 ng/mL with good linearity for oseltamivir and 4 to 1000 ng/mL for oseltamivir carboxylate. The calibration curves were constructed with 1/x2 weighting and the regression coefficients were greater than 0.99.
2.7. Other analyses
Protein concentrations were determined with BCA assay (Pierce) based on bovine serum albumin standard. Data are presented as mean ± SD. All enzymatic assays were repeated three times with the same microsomal preparation. Statistical tests were performed to compare means (Student's t test) or correlations (Spearman). In all cases, significant differences were assumed when p values were less than 0.05.
3. Results
3.1. Ontogenic expression of human carboxylesterases HCE1 and HCE2 by RT-qPCR
In this study, we first evaluated the expression patterns of human carboxylesterases HCE1 and HCE2 in various age groups. A total of 104 RNA samples were analyzed including 48 samples from fetuses (82-224 gestation days), 34 from children (0 days-10 years of age) and 22 from adults (≥18). The levels of HCE1 and HCE2 mRNA were determined with RT-qPCR, and the results are summarized in Fig. 1 and Table II. Overall, the adult group had the highest levels of HCE1 and HCE2 mRNA, and the fetal group had the lowest levels for both enzymes. Based on the values of the means, the adult group expressed HCE1 at levels 319-fold higher than the fetal group, and ∼50% higher than the child group (Fig. 1 and Table II). Likewise, the adult group expressed HCE2 at levels 55-fold higher than the fetal group and ∼40% higher than the child group. In all cases, the differences among various age groups were statistically significant (Fig. 1). It should be noted that two different sets of Y axial values were used in Fig. 1 to accommodate the large difference in the mRNA levels between the fetal and the other two groups.
Fig. 1. Levels of HCE1 and HCE 2 mRNA in the adult, child and fetal groups.

Total RNAs were subjected to RT-qPCR analysis for the level of HCE1 mRNA (A) and HCE2 mRNA (B) by Taqman probes as described in the section of Materials and Methods. The adult group contained 22 samples, the child group contained 34 samples and the fetal group contained 48 samples. The signals from each target were normalized based on the signal from PolII and expressed as relative levels among all samples. The data are presented as mean ± SD *Statistical significance at p < 0.05, **Statistical significance at p < 0.001.
Table II. Relative mRNA levels of carboxylesterases HCE1 and HCE2 in fetuses, children (0-10 years old) and adults (≥18).
| Group | n | Minimum | Maximum | Variability | Mean | S.D. | CV(%) |
|---|---|---|---|---|---|---|---|
| Fetus-HCE1 | 48 | 0.07 | 30.15 | 431 (fold) | 3.32 | 5.70 | 172 |
| Child-HCE1 | 34 | 12.18 | 2657.77 | 218 | 711.47 | 638.51 | 90 |
| Adult-HCE1 | 22 | 225.50 | 2659.61 | 12 | 1059.59 | 644.92 | 61 |
| Fetus-HCE2 | 48 | 0.20 | 4.28 | 21 | 1.63 | 1.36 | 91 |
| Child-HCE2 | 34 | 7.00 | 148.78 | 21 | 65.82 | 34.90 | 53 |
| Adult-HCE2 | 22 | 39.89 | 168.66 | 4 | 89.87 | 34.83 | 39 |
Abbreviations: S.D., standard deviation; CV, coefficient of variation.
In addition to the large difference among various age groups (inter-group), a large inter-individual variability was detected within a group. The fetal group, for example, showed a 431-fold difference (ratio between the maximum and the minimum) in HCE1 mRNA with a coefficient of variation (CV) of as high as 172% (Table II). The child and adult groups, on the other hand, varied less in HCE1 mRNA with a 218- and 12-fold difference, respectively (Table II). Similarly, the levels of HCE2 mRNA varied in all age groups, however, the overall variability was much less than HCE1 mRNA. The variation in HCE2 mRNA was the same in the fetal and child groups and higher than that in the adult group (21 versus 4 fold) (Table II).
We next examined whether the expression of carboxylesterases is age-related within a group. The levels of mRNA were plotted against age or gestation days, and the correlation coefficients were computed. The adult group showed no clear correlation for either HCE1 or HCE2 (data not shown). In the fetal samples, the level of HCE2 but not HCE1 mRNA was significantly correlated with age (Figs. 2A and B). In contrast, the child group showed better correlation with age on HCE1 than HCE2 mRNA, although neither correlation reached the level of statistical significance (Figs. 2C and D). To gain additional information on age-related expression, correlation analysis was performed on the samples from donors under one year old (0-1 year). In this sub-group, much improved correlation was observed on both HCE1 and HCE2 with a p value of 0.004 and 0.111, respectively (Figs. 2E and F).
Fig. 2. Age-related expression of HCE1 and HCE2.

The data from Fig. 1 were plotted against age with SPSS version 16. (A) Correlation of HCE1 mRNA with gestation days. (B) Correlation of HCE2 mRNA with gestation days. (C) Correlation of HCE1 mRNA with age in the child group (0-10 years old). (D) Correlation of HCE2 mRNA with age in the child group (0-10 years old). (E) Correlation of HCE1 mRNA with age in the sub-child group (0-1 year old). (F) Correlation of HCE2 mRNA with age in the sub-child group (0-1 year old) *Statistical significance (p < 0.05).
3.2. Inter-individual variability in carboxylesterase proteins and oseltamivir hydrolysis in the child group
We next examined whether the levels of carboxylesterase mRNA reflected the levels of corresponding proteins. RNA-microsome matched samples from 11 available pediatric-aged subjects were evaluated. Fetal matched samples were not tested because of low mRNA expression and low activities towards marker substrates (described below). No RNA-microsome matched samples were available for the adult group. The microsomal samples were first analyzed by Western immunoblotting with antibody against HCE1 or HCE2, and the immunostaining intensities were quantified by the KODAK 1D Image Analysis Software. As shown in Fig. 3A, all samples contained HCE1 and HCE2 proteins, but the relative abundance varied markedly. In particular, one donor (lane 6) showed extremely low levels of both carboxylesterases (Fig. 3A). Based on the immunostaining intensities, HCE1 protein varied by ∼100 fold, and HCE2 protein varied by ∼20 fold. The inter-individual variability, however, was decreased to ∼8 fold for both carboxylesterases when the data-point (lane 6) was eliminated. For both HCE1 and HCE2, the mRNA levels were correlated significantly with the levels of respective proteins (p < 0.001) (Fig. 3B). The HCE1 matched samples had a correlation coefficient of 0.9047, and the HCE2 matched samples had a slightly lower correlation coefficient (0.8471) (Fig. 3B).
Fig. 3. Individual variation of HCE1 and HCE2 proteins and oseltamivir hydrolysis in the child group.
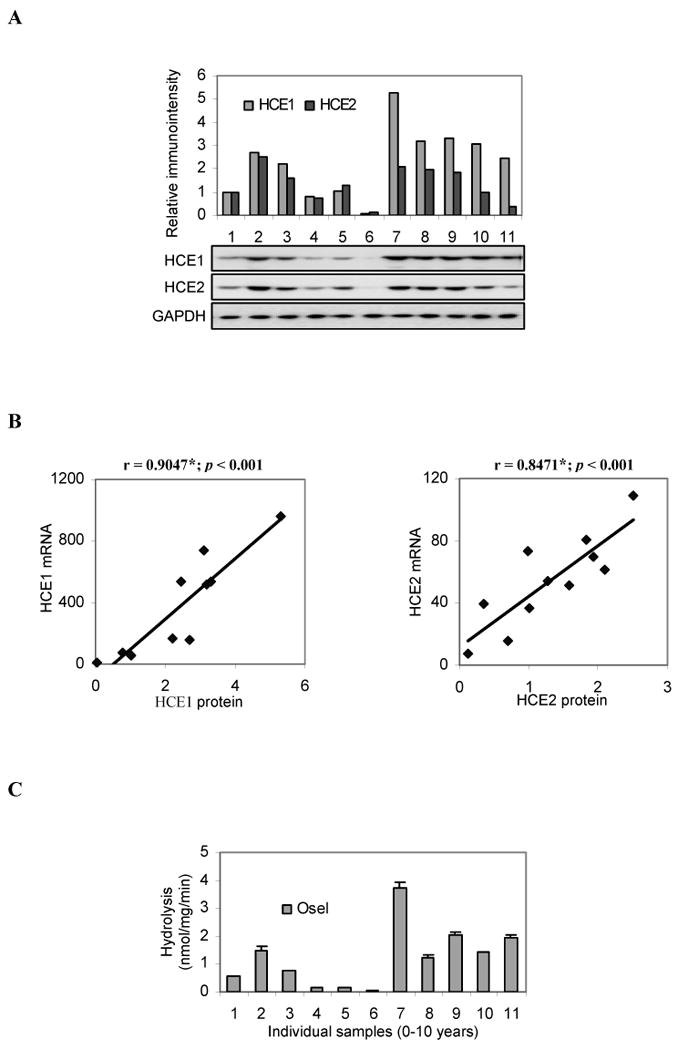
(A) Western analyses Microsomes (1.5 μg) were resolved by 7.5% SDS-PAGE and transferred electrophoretically to nitrocellulose membranes. The blots were incubated with an antibody against HCE1, HCE2 or GAPDH and chemiluminescent substrate. The signal was captured by a KODAK Image Station 2000 and the relative intensities were quantified by the KODAK 1D Image Analysis Software. (B) Correlation analyses The immunointensities of HCE1 and HCE2 were plotted against the levels of respective mRNA. The correlation coefficients and evaluations on statistical significance were performed with SPSS version 16. * Statistical significant (p < 0.001). (C) Oseltamivir hydrolysis by individual liver samples of the child group Microsomes (20 μg) were incubated with oseltamivir (200 μM) at 37°C for 10 min, and the formation of oseltamivir carboxylate was detected by LC-MS/MS. Data were assembled from three independent experiments with two injections of each experiment.
The large individual variability in carboxylesterase protein pointed to the possibility of marked differences in the metabolism of therapeutic agents and other xenobiotics. To directly test this possibility, the anti-influenza viral agent oseltamivir (an ester prodrug) was incubated with individual donor samples (Fig. 3A), and the hydrolysis was monitored. As shown in Fig. 3C, all samples hydrolyzed this anti-viral agent, and the overall hydrolysis varied by 127-fold. Such a large inter-individual variability was in agreement with the variation in the abundance of HCE1 (Fig. 3A), which has been shown to catalyze the hydrolysis of oseltamivir (3). As expected, sample 6 (lane 6) contained the lowest HCE1 protein and showed the lowest hydrolytic activity toward oseltamivir. Conversely, sample 7 (lane 7) contained the highest level of HCE1 protein and was the most active toward this anti-viral agent (Figs. 3A and C). The hydrolysis of oseltamivir among these individual samples was highly correlated with the protein level of HCE1 with a correlation coefficient of 0.9373, although samples 8 and 10 exhibited relatively lower hydrolysis compared with their relatively HCE1 contents (Figs. 3A and C).
3.3. Hydrolysis of drugs and insecticides by liver microsomes of fetuses, children and adults
We next extended the metabolism study to include the anti-inflammatory agent aspirin, and insecticides permethrin (cis- and trans-) and deltamethrin. In addition to their pharmacological and toxicological implication, these chemicals were chosen because they are hydrolyzed in an isoform-specific manner. Oseltamivir and deltamethrin are predominately hydrolyzed by HCE1 [3, 19-21], whereas aspirin is predominately hydrolyzed by HCE2 [4]. The cis-form of permethrin is favorably hydrolyzed by HCE2, whereas the trans-form is comparably hydrolyzed by both forms [19]. The extended metabolism study was performed with microsomes pooled from various age groups, and the microsomes were so pooled by mixing equal amount from all individuals in an age group. The pooled samples enabled comparison to be made on the overall hydrolysis of these chemicals among different age groups.
We first determined the levels of HCE1 and HCE2 in the pooled samples by Western immunoblotting. Based on the immunostaining intensities, the child group expressed ∼25% of carboxylesterases (both HCE1 and HCE2) of the adult group and the fetal group expressed less than 10% of the adult group (Fig. 4A). Overall, the magnitude of hydrolysis of these chemicals was correlated well with the relative levels of carboxylesterases in these samples (Figs. 4B-F). The adult pooled sample showed the highest activity toward all chemicals and the fetal pooled samples showed the lowest activity. Hydrolysis of aspirin and trans-permethrin (Per-1) by the samples pooled from the fetuses and children was slightly higher than that predicted according to their relative abundance of carboxylesterases. For example, the fetal sample contained less than 10% of carboxylesterases of the adult sample but showed 25% of aspirin hydrolysis (Figs. 4A and C). Conversely, the hydrolysis of oseltamivir, cis-permethrin and deltamethrin by the fetal group was less than 10% of the adult group. The precise mechanism on these discrepancies remains to be determined. On the other hand, the higher-than predicted hydrolysis, in the case of aspirin, was likely due to hydrolysis by other enzymes (highly expressed in the fetal liver) or due to polymorphic variants. In support of these possibilities, butyrylcholinesterase has been shown to hydrolyze aspirin [22], and certain polymorphic variants of HCE2 were found to differ from the wild-type enzyme in hydrolyzing this anti-platelet agent [4]. In addition, the liver expresses a third carboxylesterase [23], but it remains to be determined whether this carboxylesterase hydrolyzes these compounds (i.e., aspirin and trans-permethrin) and whether the expression of this carboxylesterase is developmentally regulated.
Fig. 4. Hydrolysis of oseltamivir, aspirin, deltamethrin and permethrin.
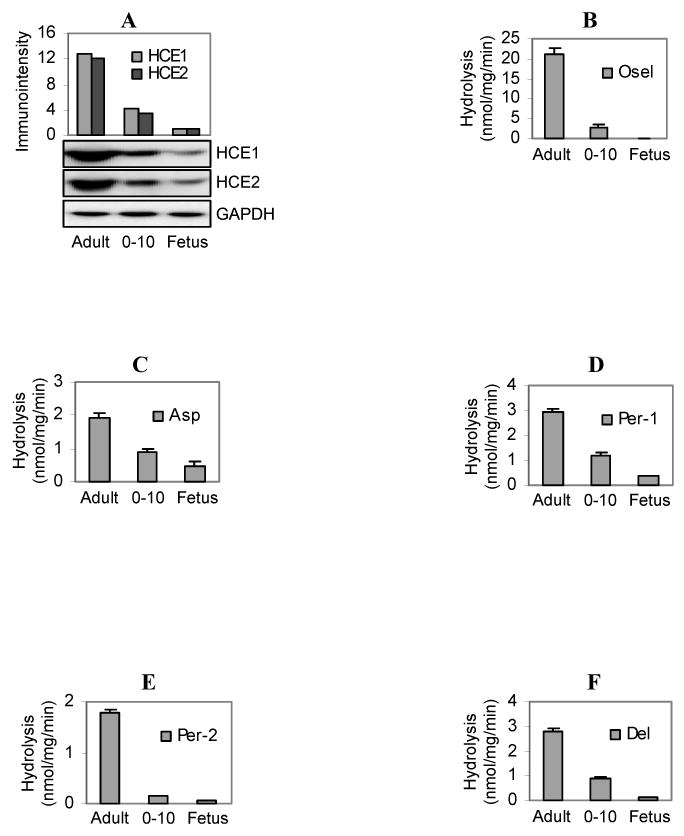
(A) Western analysis of pooled samples for various groups Microsomes (1.5 μg) pooled from the adult, child and fetal group were analyzed by Western blotting and the immunostaining intensities were quantified by the KODAK 1D Image Analysis Software. (B) Hydrolysis of oseltamivir by pooled microsomes. Microsomes (20 μg) from various age groups were incubated with oseltamivir (200 μM) at 37°C for 10 min, and the formation of oseltamivir carboxylate was detected by LC-MS/MS. (C) Hydrolysis of aspirin by pooled microsomes Microsomes (80 μg) from various age groups were incubated with aspirin (1 mM) at 37°C for 60 min, and the formation of salicylic acid was detected by HPLC. (D and E) Hydrolysis of permethrin by pooled microsomes Microsomes (50 μg) from various age groups were incubated with permethrin (100 μM) at 37°C for 60 min, and the disappearance of the parent compounds was detected by HPLC. Permethrin contained a mixture of cis- and trans-isomers at a ratio of 46 and 52%, respectively with the cis-form having a retention time of 10.41 and the trans-form of 10.18. (F) Hydrolysis of deltamethrin by pooled microsomes Microsomes (50 μg) from various age groups were incubated with deltamethrin (100 μM) at 37°C for 60 min, and the disappearance of the parent compound was detected by HPLC. Data were assembled from three independent experiments with each experiment having two injections.
4. Discussion
Carboxylesterases constitute a class of hydrolytic enzymes that play important roles in the metabolism of therapeutic agents and detoxication of insecticides [1]. In this study, we analyzed a large number of individual liver samples for the expression patterns of HCE1 and HCE2, two human carboxylesterases predominately expressed in the liver. Overall, the adult group expressed significantly higher HCE1 and HCE2 than the child group or the fetal group. The age-related expression was confirmed on the levels of both mRNA and protein. In agreement with the expression patterns, the adult microsomes were approximately 4 times as active as the child microsomes and more than 10 times as active as the fetal microsomes in hydrolyzing a group of therapeutic agents and insecticides. Even within the same age group, a large inter-individual variability was detected in mRNA and protein levels as well as hydrolytic activity.
Although both HCE1 and HCE2 exhibited a similar expression pattern among the various age groups, there were several major differences. First, HCE1 exhibited much greater inter-group and inter-individual variability than HCE2. For example, based on the values of the means, the adult group displayed a 319-fold higher level in HCE1 mRNA compared with the fetal group. In contrast, these two groups showed only a 55-fold difference in the level of HCE2 mRNA (Fig. 1 and Table II). Likewise, the adult group showed a 430-fold inter-individual variability in HCE1 mRNA (ratio between maximum over minimum), in contrast, only a 21-fold difference in HCE2 mRNA was detected in the same group (Table II). Second, HCE1 displayed better age-related expression than HCE2 in the child group with correlation coefficients of 0.3138 and 0.1058, respectively (Figs. 2C and D). In contrast, HCE2 displayed better correlation in the fetal group with correlation coefficients of 0.4362 and 0.1136, respectively (Figs. 2A and B).
The large inter-individual variability, particularly in the fetal and children groups, was likely an outcome coordinated by multiple mechanisms. In this study, we have shown that the adult group expressed the highest levels of HCE1 and HCE2 followed by the child group, and the fetal group expressed the lowest levels of both enzymes (Fig. 1 and Table II). Such age-related expression patterns were confirmed by RT-qPCR and Western analyses (Figs. 1, 3 and 4) and established that developmental regulation is involved in the expression of HCE1 and HCE2. However, the correlation with age in many cases was only moderate at the most and did not reach the levels of statistical significance (Figs. 2C and F). Although the precise mechanisms remain to be determined, the lack of strong correlation with age in these groups was likely due to complicated factors such as the administration of therapeutic agents and disease conditions. We have previously reported that pathological condition and therapeutic agents markedly altered the expression of HCE1 and HCE2 [6, 8]. Interleukin-6, a cytokine usually elevated during inflammation, profoundly suppressed the expression of both HCE1 and HCE2 (8). Consistent with the suppression of carboxylesterases by cytokines, patients with elevated cytokine conditions such as liver cirrhosis had much lower capacity of hydrolyzing ester drugs such as perindopril, a non-sulphydryl angiotensin converting enzyme inhibitor [24, 25].
The significantly lower level of HCE1 in the child group, compared with the adult group, provides a molecular explanation to the large pharmacokinetic difference in oseltamivir between these two groups. In this study, the sample pooled from the children was only ∼15% as active as the sample pooled from the adults in hydrolyzing oseltamivir (Fig. 4C). Consistent with the in vitro metabolism, children under 12 years old reportedly produced only approximately half of the hydrolytic metabolite produced by adults [26]. Apparently the low level production of oseltamivir carboxylate in children was likely due to ineffective hydrolysis of the parent drug and higher clearance of the metabolite. Furthermore, we have shown that individual samples in the child group varied by as many as 127-fold in oseltamivir hydrolysis (Fig. 4A). Pharmacokinetic studies in children, however, did not detect such a large inter-individual variation in the production of hydrolytic metabolite of oseltamivir [26, 27]. One explanation is that the frequency with an extremely low expression level of HCE1 is rare in the general population, and the pharmacokinetic studies were performed in 24 or fewer children [26, 27]. Indeed, there was a reported rare case that an adult patient with diabetes mellitus had only 1-2% capacity of normal people in hydrolyzing clopidogrel based on the values of the means and standard deviations [28]. Like oseltamivir, clopidogrel is a substrate of HCE1 [3]. Ineffective hydrolysis of oseltamivir, on the other hand, likely leads to increased concentration in the brain. Some patients taking oseltamivir reportedly developed neurobehavioral changes [29], although a direct link remains to be established between the developed neurotoxiciy and the use of oseltamivir.
In contrast to oseltamivir, pyrethroids have long been recognized to exert neurotoxicity [30]. As a class of the most used insecticides in the world, both the general population and workers have a high risk to be exposed to these insecticides. Epidemiological studies have shown that the exposure level, in some cases, can be high [31, 32]. Pyrethroid insecticides are generally considered safe to mammals, because they are rapidly eliminated by carboxylesterases. In this study, we have shown that the fetuses and children hydrolyzed pyrethroids at a rate of only ∼20% or lower of the adults (Figs. 4D-F), suggesting their vulnerability to pyrethroids-induced toxicity. In support of this notion, neonatal rats were reportedly 17 times as sensitive as adult rats to cypermethrin [12]. Neurotoxicity induced by pyrethroids appears to cause irreversible damage. Prenatal exposure to deltamethrin, for example, led to a deficit in locomotor activity of offspring post-natally at 9 weeks [33]. In humans, micromolar concentrations were reported in the meconium [34]. This is particularly of relevance as fetuses have only limited capacity of hydrolytic detoxication as described in this report.
In summary, our work points to several important conclusions. First, the expression of both HCE1 and HCE2 increases with age, establishing that their expression is developmentally regulated and that fetuses and children generally have lower capacity of hydrolytic metabolism than adults. Second, there is a large inter-individual variability in the expression of these enzymes, particularly in the fetal and child groups. It is likely that the expression of HCE1 and HCE2 in these age groups is subjected to non-developmental regulation with high sensitivity (e.g., xenobiotic regulation). Carboxylesterases are recognized to play important roles in drug metabolism and insecticide detoxication. The findings on the large variability among different age groups or even within the same age group have important pharmacological and toxicological implications, particularly in relation to altered pharmacokinetics of ester drugs in children and vulnerability of fetuses and children to insecticides such as pyrethroids.
Abbreviation
- GAPDH
glyceradehyde-3-phosphate dehydrogenase
- HCE
human carboxylesterase
- HPLC
High-performance liquid chromatography
- PBS
phosphate buffered saline
- RT-qPCR
reverse transcription-quantitative polymerase chain reaction
Footnotes
This work was supported by NIH grants R01ES07965 and R01GM61988 (BY) and R01CA053596 (YJW).
The authors thank Dr. Robert Rodgers of the University of Rhode Island for critical reading of the manuscript.
References
- 1.Satoh T, Hosokawa M. Structure, function and regulation of carboxylesterases. Chem Biol Interact. 2006;162:195–211. doi: 10.1016/j.cbi.2006.07.001. [DOI] [PubMed] [Google Scholar]
- 2.Schwer H, Langmann T, Daig R, Becker A, Aslanidis C, Schmitz G. Molecular cloning and characterization of a novel putative carboxylesterase, present in human intestine and liver. Biochem Biophys Res Commun. 1997;233:117–120. doi: 10.1006/bbrc.1997.6413. [DOI] [PubMed] [Google Scholar]
- 3.Shi D, Yang J, Yang D, LeCluyse EL, Black C, You L, et al. Anti-influenza prodrug oseltamivir is activated by carboxylesterase human carboxylesterase 1, and the activation is inhibited by antiplatelet agent clopidogrel. J Pharmacol Exp Ther. 2006;319:1477–1484. doi: 10.1124/jpet.106.111807. [DOI] [PubMed] [Google Scholar]
- 4.Tang M, Mukundan M, Yang J, Charpentier N, LeCluyse EL, Black C, et al. Antiplatelet agents aspirin and clopidogrel are hydrolyzed by distinct carboxylesterases, and clopidogrel is transesterificated in the presence of ethyl alcohol. J Pharmacol Exp Ther. 2006;319:1467–1476. doi: 10.1124/jpet.106.110577. [DOI] [PubMed] [Google Scholar]
- 5.Wu MH, Yan B, Humerickhouse R, Dolan ME. Irinotecan activation by human carboxylesterases in colorectal adenocarcinoma cells. Clin Cancer Res. 2002;8:2696–2700. [PubMed] [Google Scholar]
- 6.Zhu W, Song L, Zhang H, Matoney L, LeCluyse E, Yan B. Dexamethasone differentially regulates expression of carboxylesterase genes in humans and rats. Drug Metab Dispos. 2000;28:186–191. [PubMed] [Google Scholar]
- 7.Morgan EW, Yan B, Greenway D, Parkinson A. Regulation of two rat liver microsomal carboxylesterase isozymes: species differences, tissue distribution and the effects of age, sex and xenobiotic treatment of rats. Arch Biochem Biophys. 1994;315:514–26. doi: 10.1006/abbi.1994.1532. [DOI] [PubMed] [Google Scholar]
- 8.Yang J, Shi D, Yang D, Song X, Yan B. Interleukin-6 suppresses the expression of carboxylesterases HCE1 and HCE2 through transcriptional repression. Mol Pharmacol. 2007;72:686–94. doi: 10.1124/mol.107.036889. [DOI] [PubMed] [Google Scholar]
- 9.Oxford JS, Mann A, Lambkin R. A designer drug against influenza: the NA inhibitor oseltamivir (Tamiflu) Expert Rev Anti Infect Ther. 2003;1:337–342. [PubMed] [Google Scholar]
- 10.Anand SS, Kim KB, Padilla S, Muralidhara S, Kim HJ, Fisher JW, et al. Ontogeny of hepatic and plasma metabolism of deltamethrin in vitro: role in age-dependent acute neurotoxicity. Drug Metab Dispos. 2006;34:389–97. doi: 10.1124/dmd.105.007807. [DOI] [PubMed] [Google Scholar]
- 11.Pope CN, Chakraborti TK, Chapman ML, Farrar JD, Arthun D. Comparison of in vivo cholinesterase inhibition in neonatal and adult rats by three organophosphorothioate insecticides. Toxicology. 1991;68:51–61. doi: 10.1016/0300-483x(91)90061-5. [DOI] [PubMed] [Google Scholar]
- 12.Cantalamessa F. Acute toxicity of two pyrethroids, permethrin, and cypermethrin in neonatal and adult rats. Arch Toxicol. 1993;67:510–3. doi: 10.1007/BF01969923. [DOI] [PubMed] [Google Scholar]
- 13.Sheets LP, Doherty JD, Law MW, Reiter LW, Crofton KM. Age-dependent differences in the susceptibility of rats to deltamethrin. Toxicol Appl Pharmacol. 1994;126:186–90. doi: 10.1006/taap.1994.1106. [DOI] [PubMed] [Google Scholar]
- 14.Pope CN, Karanth S, Liu J, Yan B. Comparative carboxylesterase activities in infant and adult liver and their in vitro sensitivity to chlorpyrifos oxon. Regul Toxicol Pharm. 2005;42:62–9. doi: 10.1016/j.yrtph.2005.01.004. [DOI] [PubMed] [Google Scholar]
- 15.Vyhlidal CA, Gaedigk R, Leeder JS. Nuclear receptor expression in fetal and pediatric liver: correlation with CYP3A expression. Drug Metab Dispos. 2006;34:131–7. doi: 10.1124/dmd.105.005967. [DOI] [PubMed] [Google Scholar]
- 16.Wortham M, Czerwinski M, He L, Parkinson A, Wan YJ. Expression of constitutive androstane receptor, hepatic nuclear factor 4 alpha, and P450 oxidoreductase genes determines interindividual variability in basal expression and activity of a broad scope of xenobiotic metabolism genes in the human liver. Drug Metab Dispos. 2007;35:1700–10. doi: 10.1124/dmd.107.016436. [DOI] [PubMed] [Google Scholar]
- 17.Leeder JS, Gaedigk R, Marcucci KA, Gaedigk A, Vyhlidal CA, Schindel BP, et al. Variability of CYP3A7 expression in human fetal liver. J Pharmacol Exp Ther. 2005;314:626–35. doi: 10.1124/jpet.105.086504. [DOI] [PubMed] [Google Scholar]
- 18.Radonić A, Thulke S, Mackay IM, Landt O, Siegert W, Nitsche A. Guideline to reference gene selection for quantitative real-time PCR. Biochem Biophys Res Commun. 2004;313:856–62. doi: 10.1016/j.bbrc.2003.11.177. [DOI] [PubMed] [Google Scholar]
- 19.Wang X, Yang D, Yan B. Pyrethroid insecticides: isoform-dependent hydrolysis, induction of cytochrome P450 3A4, and evidence on the involvement of the pregnane X receptor. Toxicol Appl Pharmacol. 2008 doi: 10.1016/j.taap.2009.02.012. In revision. [DOI] [PMC free article] [PubMed] [Google Scholar]
- 20.Godin SJ, Scollon EJ, Hughes MF, Potter PM, DeVito MJ, Ross MK. Species differences in the in vitro metabolism of deltamethrin and esfenvalerate: differential oxidative and hydrolytic metabolism by humans and rats. Drug Metab Dispos. 2006;34:1764–71. doi: 10.1124/dmd.106.010058. [DOI] [PubMed] [Google Scholar]
- 21.Nishi K, Huang H, Kamita SG, Kim IH, Morisseau C, Hammock DB. Characterization of pyrethroid hydrolysis by the human liver carboxylesterases hCE-1 and hCE-2. Arch Biochem Biophys. 2006;445:115–23. doi: 10.1016/j.abb.2005.11.005. [DOI] [PMC free article] [PubMed] [Google Scholar]
- 22.Kolarich D, Weber A, Pabst M, Stadlmann J, Teschner W, Ehrlich H, et al. Glycoproteomic characterization of butyrylcholinesterase from human plasma. Proteomics. 2008;8:254–63. doi: 10.1002/pmic.200700720. [DOI] [PubMed] [Google Scholar]
- 23.Sanghani SP, Quinney SK, Fredenburg TB, Davis WI, Murry DJ, Bosron WF. Hydrolysis of irinotecan and its oxidative metabolites, 7-ethyl-10-[4-N-(5-aminopentanoic acid)-1-piperidino] carbonyloxycamptothecin and 7-ethyl-10-[4-(1-piperidino)-1-amino]-carbonyloxycamptothecin, by human carboxylesterases CES1A1, CES2, and a newly expressed carboxylesterase isoenzyme, CES3. Drug Metab Dispos. 2004;32:505–11. doi: 10.1124/dmd.32.5.505. [DOI] [PubMed] [Google Scholar]
- 24.Thiollet M, Funck-Brentano C, Grange JD, Midavaine M, Resplandy G, Jaillon P. The pharmacokinetics of perindopril in patients with liver cirrhosis. Br J Clin Pharmacol. 1992;33:326–8. doi: 10.1111/j.1365-2125.1992.tb04045.x. [DOI] [PMC free article] [PubMed] [Google Scholar]
- 25.Eriksson AS, Gretzer C, Wallerstedt S. Elevation of cytokines in peritoneal fluid and blood in patients with liver cirrhosis. Hepatogastroenterology. 2004;51:505–509. [PubMed] [Google Scholar]
- 26.Oo C, Barrett J, Hill G, Mann J, Dorr A, Dutkowski R, et al. Pharmacokinetics and dosage recommendations for an oseltamivir oral suspension for the treatment of influenza in children. Paediatr Drugs. 2001;3:229–36. doi: 10.2165/00128072-200103030-00005. [DOI] [PubMed] [Google Scholar]
- 27.Oo C, Hill G, Dorr A, Liu B, Boellner S, Ward P. Pharmacokinetics of anti-influenza prodrug oseltamivir in children aged 1-5 years. Eur J Clin Pharmacol. 2003;59:411–5. doi: 10.1007/s00228-003-0639-6. [DOI] [PubMed] [Google Scholar]
- 28.Heestermans AA, van Werkum JW, Schömig E, ten Berg JM, Taubert D. Clopidogrel resistance caused by a failure to metabolize clopidogrel into its metabolites. J Thromb Haemost. 2006;4:1143–5. doi: 10.1111/j.1538-7836.2006.01891.x. [DOI] [PubMed] [Google Scholar]
- 29.FDA Patient Safety News. Caution on Neuropsychiatric Events with Tamiflu. 2007 Show #59: http://www.accessdata.fda.gov/psn/printer.cfm?id=486.
- 30.Ray DE, Fry JR. A reassessment of the neurotoxicity of pyrethroid insecticides. Pharmacol Ther. 2006;111:174–93. doi: 10.1016/j.pharmthera.2005.10.003. [DOI] [PubMed] [Google Scholar]
- 31.Leng G, Kühn KH, Idel H. Biological monitoring of pyrethroids in blood and pyrethroid metabolites in urine: applications and limitations. Sci Total Environ. 1997;199:173–81. doi: 10.1016/s0048-9697(97)05493-4. [DOI] [PubMed] [Google Scholar]
- 32.Heudorf U, Angerer J. Metabolites of pyrethroid insecticides in urine specimens: current exposure in an urban population in Germany. Environ Health Perspect. 2001;109:213–7. doi: 10.1289/ehp.01109213. [DOI] [PMC free article] [PubMed] [Google Scholar]
- 33.Johri A, Yadav S, Singh RL, Dhawan A, Ali M, Parmar D. Long lasting effects of prenatal exposure to deltamethrin on cerebral and hepatic cytochrome P450s and behavioral activity in rat offspring. Eur J Pharmacol. 2006;544:58–68. doi: 10.1016/j.ejphar.2006.06.042. [DOI] [PubMed] [Google Scholar]
- 34.Ostrea EM, Jr, Bielawski DM, Posecion NC, Jr, Corrion M, Villanueva-Uy E, Jin Y, et al. A comparison of infant hair, cord blood and meconium analysis to detect fetal exposure to environmental pesticides. Environ Res. 2008;106:277–83. doi: 10.1016/j.envres.2007.08.014. [DOI] [PMC free article] [PubMed] [Google Scholar]