Abstract
Aggrecan, a large biological polyelectrolyte molecule with a bottlebrush shape, forms complexes with hyaluronic acid (HA) that provide compressive resistance in cartilage. In solutions of aggrecan alone, the concentration dependence of the osmotic pressure Π is marked by self-assembly of the molecules into aggregates. When HA is added to the solution at low aggrecan concentration c, the osmotic pressure is reduced, but in the physiological concentration range this trend is reversed. The osmotic modulus c∂Π∕∂c, which determines load bearing resistance, is enhanced in the HA-containing solutions. Dynamic light scattering (DLS) measurements show that the aggregates behave like microgels and that they become denser as the aggrecan concentration increases. The degree of densification is greatest at large distance scales in the microgels, but decreases at short distance scales. Measurements at higher resolution, involving small angle neutron scattering and small angle x-ray scattering (SAXS), confirm that at length scales shorter than 1000 Å, the density is independent of the concentration and that the individual bottlebrushes in the microgels retain their identity. The absence of collective diffusion modes in the relaxation spectrum, measured by DLS and neutron spin echo, corroborates the lack of interpenetration among the aggrecan subunits in the microgel. Complexation with HA modifies the long-range spatial organization of the microgels. Comparison of the scattering pattern of the individual aggrecan molecules obtained from SAXS measurements with that of the complexes measured by DLS shows that the aggrecan-HA structure is denser and is more uniform than the random microgels. This enhanced space-filling property allows higher packing densities to be attained, thus, optimizing resistance to osmotic compression.
INTRODUCTION
Aggrecan is a proteoglycan of high molecular weight (1×10⁶<M<3×10⁶) that occurs naturally in bone articulations, both in collagen and in extracellular matrix. It exhibits a bottlebrush structure, in which glycosaminoglycan (GAG) (negatively charged linear polysaccharides such as chondroitin sulfate and keratan sulfate) side chains are attached to an extended protein core. In the presence of hyaluronic acid (HA) and a link protein, aggrecan molecules self-organize into a secondary bottlebrush superstructure with as many as 100 aggrecan monomers attached as side chains (or bristles) on the hyaluronan core (aggrecan-HA complex).1 The strong electrostatic repulsive forces arising from the high charge density on the bottlebrush bristles favor chain extension, thus generating gel-like structures that are highly swollen in three dimensions. In cartilage, the aggrecan-HA complexes occupy the pores of the collagen matrix of bone articulation and provide osmotic resistance to deswelling under compressive load with minimum deformation, even for prolonged periods.2 The high compression modulus of these complexes satisfies the latter requirement. With its structural stability, it also contributes to the nearly frictionless lubrication of joints.
The biochemistry and morphology of the aggrecan molecule are well established.1, 2, 3, 4 It contains three globular domains, two of which bind the GAG chains. The N-terminal domain interacts noncovalently with HA to form the large aggrecan-HA complexes present in the extracellular matrix. These noncovalent complexes are stabilized by a link protein.1, 2
Imaging techniques (electron microscopy, atomic force microscopy, etc.) reveal that the length of the aggrecan bottlebrushes is roughly 4000 Å with a radius of 200–600 Å, while the length of the aggrecan-HA complexes is several microns, with approximately the same aspect ratio.5, 6, 7 As is common with other biological molecules, however, the morphology of aggrecan is subject to strong variability, depending on origin, age, state of health, etc.
In spite of the abundance of information from high-resolution imaging and force measurements on single molecules as well as other techniques, little is known of the structural and osmotic properties of aggrecan and its complexes with HA in physiological conditions.
To study the thermodynamic properties of aggrecan in solution, an array of techniques is required that probe not only a wide range of length scales but also statistically representative volumes of the sample. This paper accordingly reports results from osmotic, structural, and dynamic investigations into aggrecan solutions in near physiological conditions, with and without HA. Static properties are studied by osmotic pressure measurements, static light scattering (SLS), small angle neutron scattering (SANS), and small angle x-ray scattering (SAXS), while the dynamics are probed by dynamic light scattering (DLS) and neutron spin echo (NSE). Such solution-based measurements are complementary to the published structural and morphological investigations of the role of electrostatic forces in the nanomechanics of aggrecan molecules.8, 9, 10, 11
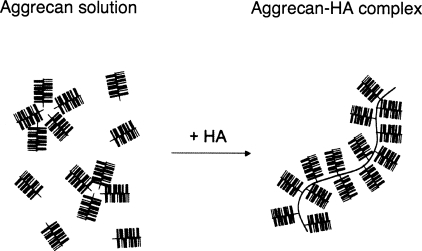
The influence of HA on association in aggrecan solutions is illustrated schematically in Fig. 1. In cartilage, the physiological concentration range of aggrecan is between 4% and 8%, where the bottlebrushes are strongly crowded.8, 9, 10, 11 In the absence of HA, the assemblies are random, while the degree of order increases in the presence of HA. Our aim in this investigation is to identify the differences in the osmotic properties of the two systems and relate them to the structural changes imposed by the HA at different levels of the hierarchy. It is also important to verify whether the changes due to HA modify the local dynamics in response to external perturbations.
Figure 1.
Schematic representation of structure formation in aggrecan solutions without and with HA.
EXPERIMENTAL SECTION
Sample preparation
Aggrecan (bovine articular cartilage, Sigma) solutions were prepared in 100 mM NaCl. The concentration of the aggrecan was varied in the range of 0.0002–0.03 g∕cm3. Aggrecan-HA solutions were also prepared in which the ratio of aggrecan to HA (Sigma, Mw=1.2×10⁶) was set equal to 100. To avoid the complexities of ternary polymer solutions, link protein, the role of which is that of a stabilizer of the aggrecan-HA complex,12 was not included. The ionic strength and pH (=7) were identical in all samples. We note that for the SANS measurements D2O with 100 mM NaCl was used as a solvent. SAXS detected no significant difference between solutions made with H2O or with D2O. All measurements were performed at 25 °C.
Osmotic measurements
The osmotic pressure of the aggrecan solutions was measured as a function of concentration by bringing them to equilibrium with polyvinyl alcohol gels of known swelling pressure.13, 14 The size of the gel filaments was measured by optical microscopy after equilibration in the solution (∼24 h). The large size of the aggrecan molecule prevented its penetration into the swollen gel.
Small angle neutron and x-ray scattering
SANS measurements were performed on the NG3 instrument at NIST, Gaithersburg MD, using an incident wavelength of 8 Å. The aggrecan solutions were held in 2 mm thick quartz sample cells. After azimuthal averaging, corrections for solvent background, detector response, and cell window scattering were applied.
The SAXS measurements were made at beamline BM2 at the ESRF, Grenoble, with an incident energy of 16 keV. Samples were placed in 1.5 mm capillaries and correction was made for solvent background. The data from the two-dimensional charge coupled device (CCD) camera were azimuthally averaged and corrected for dark current.
Light scattering
SLS and DLS measurements were made with an ALV DLS∕SLS 5022F goniometer equipped with fiber optic coupling and an avalanche diode, working with a 22 mW HeNe laser and an ALV 5000E multitau correlator. The angular range from 20° to 150° was explored with accumulation times of 200 s. Measurements were also made with a small angle dynamic light scattering (SADLS) apparatus.15 This instrument collected CCD image sequences of the scattering pattern that were analyzed using a multipixel multitau correlation algorithm.
Neutron spin echo
NSE measurements were made on the IN15 instrument at the Institut Laue Langevin, Grenoble. The neutron wavelength was 8 Å. These measurements explored time delays extending from 0 to 170 ns in the range of 0.03 Å−1⩽q⩽0.05 Å−1.
RESULTS AND DISCUSSION
Osmotic pressure measurements
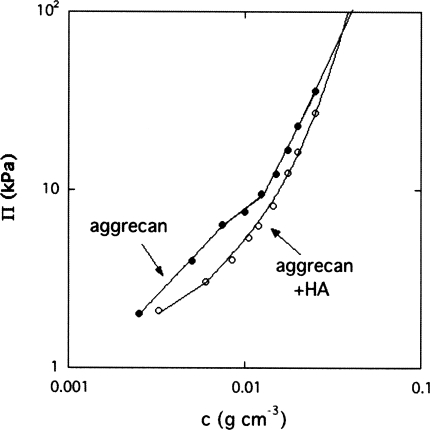
The concentration dependence of the osmotic pressure Π is displayed in Fig. 2 both for the pure aggrecan solution and for that containing aggrecan-HA complexes, measured in 100 mM NaCl solution. In the latter case, the HA-aggrecan ratio was set at 1:100. At low concentration, Π increases linearly for both systems, typical of dilute solution behavior, but is smaller by roughly 30% when HA is present. This difference progressively disappears as the concentration approaches the physiological range of 0.04 g∕cm3⩽c⩽0.08 g∕cm3. The reduction in Π is a direct evidence for the formation of complexes between aggrecan bottlebrushes and HA molecules, a process that removes free aggrecan subunits from the solution. It is noteworthy, however, that the decrease in Π is smaller than the two orders of magnitude expected for complete complexation of the aggrecan by HA (i.e., assuming that each HA molecule forms a complex with 100 aggrecan molecules). In the aggrecan-HA system, Π(c) varies smoothly with a continuously increasing slope. In contrast, in the vicinity of 0.01 g∕cm3, the pure aggrecan system reveals a characteristic “kink,” resembling micelle formation.16, 17 This feature, indicating self-assembly among the aggrecan bottlebrushes, was found to be entirely reproducible.18 The self-assembly can probably be attributed to the anisotropy of the aggrecan molecular interactions and, in particular, to the difference in water affinity between the N-terminal domain of the protein core in the aggrecan bottlebrush and the highly charged hydrophilic polysaccharide side chains. The osmotic pressure data in Fig. 2 suggest that self-assembly begins at around 0.008 g∕cm3. In such associating solutions, individual bottlebrush subunits coexist with microgel-like assemblies. At higher concentration, above 0.012 g∕cm3, the osmotic pressure rises more steeply owing to the densification of the overlapping aggrecan assemblies.
Figure 2.
Variation of the osmotic pressure Π with the polymer concentration c.
At low concentration, the two systems exhibit linear behavior, indicating that the osmotic pressure is governed by the individual aggrecan molecules. At higher concentrations, the higher slope of Π(c) in the aggrecan-HA solution implies that the osmotic modulus K=c∂Π∕∂c increases faster than for the aggrecan solution. In gels, such as the aggrecan-HA assemblies in the collagen network of cartilage, this quantity defines the compressive resistance to external load. A conservative estimate, based on power law fits to the high concentration data of Fig. 2, yields the values K=520 kPa (pure aggrecan) and K=575 kPa (aggrecan-HA system) at c=0.07 g∕cm3. These values are close to those reported by Treppo et al.19
Scattering measurements
Scattering techniques probe the structural features of the system by measuring the scattered intensity I(q) as a function of the wave vector q. This quantity defines the characteristic resolution of the observation [q=4πn0∕λ sin(θ∕2), λ being the wavelength of the incident radiation, θ the angle of observation, and n0 the refractive index of the scattering medium]. In the limit of q→0, I(q) is related to the osmotic compressibility K by
| (1) |
where Δρ2 is the contrast factor between the polymer and the solvent, d is the density of the dry material, kB is Boltzmann’s constant, and T the absolute temperature. For solutions in which individual subunits coexist with large assemblies, an important consequence of the inverse relationship in Eq. 1 between the osmotic pressure and the intensity is that the former is essentially sensitive to the small species in the solution, while the latter preferentially detects large objects. It follows that scattering observations provide information on the aggrecan assemblies that is complementary to the osmotic measurements.
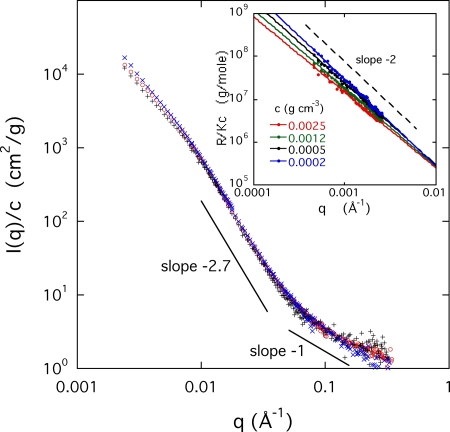
Figure 3 shows the SANS results for aggrecan solutions at three concentrations of 0.0025, 0.005, and 0.01 g∕cm3 in 100 mM NaCl. As these measurements did not detect significant differences between the solutions with and without HA, this figure displays only the pure aggrecan results. To discriminate between structural components that behave as distinct units from those that interpenetrate, the intensity data are normalized by the concentration c. In the former case, the intensity scattered by the rigid units is proportional to their concentration, while in the latter the concentration variation becomes weaker.
Figure 3.
Variation of the reduced SANS intensity I(q)∕c of aggrecan solutions at different concentrations. Inset: Reduced light scattering intensity I(q)∕c for different concentrations, with corresponding power law fits.
The inset of Fig. 3 contains the light scattering data at four different concentrations. In this low-q region, I(q)∕c decreases according to a power law, the exponent of which is close to −2 for the lowest concentration, and which decreases monotonically with increasing aggrecan concentration. For the most dilute sample, the power law dependence I(q)∕c∝q−2 indicates the presence of large, fractal clusters (microgel particles), the size of which exceeds the resolution of the light scattering measurement (2π∕q≈1.5 μm). The exponent −2 is consistent with swollen branched polymers or “lattice animals.”20 The decrease in amplitude of I(q)∕c with increasing concentration is the signature of densification of the microgels as they approach each other. The degree of densification depends on q and can be estimated from the inset of Fig. 3. The ratio of I(q)∕c between the highest and lowest concentrations at q=0.001 Å−1, yields approximately one order of magnitude for the densification. The straight lines through the data points converge at q≈0.01 Å−1. At values of q greater than this, I(q)∕c becomes concentration independent.
It can be seen from Fig. 3 (main) that above q≈0.01 Å−1, i.e., in the length scale range from about 500 to 100 Å, a stronger power law behavior prevails. The value of the characteristic slope, about −2.7, as expected for branched clusters with screened excluded volume interactions.20 This spatial scale, which is of the order of the length of the bristles, is unaffected by changes in the concentration. In this region, the scattering response is governed by the bottlebrush structure of the aggrecan subunit. The normalized scattering curves superimpose, indicating that the degree of interpenetration between bottlebrushes within the same cluster does not vary.
In the highest q range of Fig. 3, the intensity of the SANS response decreases approximately as q−1, as expected for structures that are locally fiberlike.21
Analysis of the scattering spectra
As outlined above, in the SANS region, I(q)∕c is dominated by the scattering from the rigid aggrecan subunits. In this region, where no difference between the HA-free and HA-containing system is detectable, the size of the individual bottlebrushes can be estimated from the shape of the scattering spectrum. In the light scattering region, the response of the pure aggrecan solution is compared with that of the HA-containing solutions before and after complexation.
Analysis of the scattering spectrum requires an estimate of the structure factor of bottlebrush shaped scatterers. This architecture is found both in the solutions of pure aggrecan and in the aggrecan-HA complexes. In the model of Dozier et al.,22 the structure factor of the bottlebrush can be formally described as a sum of two terms23, 24
| (2) |
where the first term represents the cross section of a cylinder composed of rigid bristles of length R and the second the contribution from the bristles themselves. For the case of linear polysaccharide bristles as in the aggrecan bottlebrush, the mass density of the cylinder cross section varies with distance r from the central core as 1∕r. For a cylinder of length L in the large wave vector range qL>1, the total scattering intensity then becomes
| (3) |
where J0(x) is the cylindrical Bessel function of order zero. The constants a and b are defined by the electron density of the bristles and of the central core. The shape of the scattering pattern and the numerical values obtained from this model, however, depend on the actual radial distribution of the side chain density in the bottlebrush.
For the secondary bottlebrush (aggrecan-HA complex), however, the scattering form factor may be expected to be different from that of the primary bottlebrush (aggrecan subunit) discussed in the previous paragraph. In the secondary structure, the rigid aggrecan subunits, which act as higher order bristles, are closely packed along the hyaluronan core, and the system might therefore resemble more closely a uniformly filled cylinder. For this model, the second term in Eq. 3 vanishes and the intensity scattered by the cylinder becomes
| (4) |
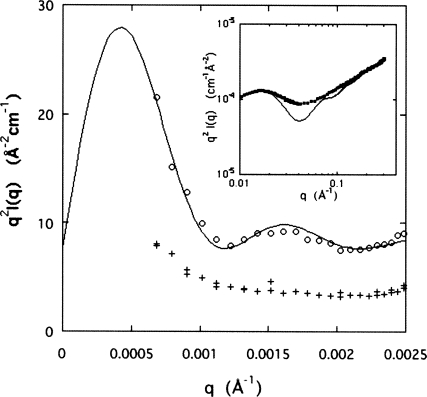
Fitting the above form factors to the scattering data in the appropriate q range allows the radius of the bottlebrush to be estimated. The inset in Fig. 4 shows the fit of Eq. 3 to the data in the high-q range accessible to the SAXS measurements. To enhance the visibility of the cylindrical features, the data in this figure are displayed in the Kratky representation q2I(q) versus q. The radius for the aggrecan bottlebrush deduced from this fit is R=120 Å. In this figure, the linear region at the high-q end is in agreement with the local rigid rod configuration of the charged polysaccharide bristles. The exaggerated depth of the minimum of the model curve is a consequence of the neglect of polydispersity. Although the value found for R is shorter than that reported from measurements by atomic force microscopy on aggrecan from nasal cartilage (260±70 Å),8 comparisons between numerical results obtained by surface and volume techniques require great prudence. It should also be recalled that the aggrecan geometry exhibits strong sample-to-sample variability and depends on the source tissue.
Figure 4.
Kratky representation of the light scattering data for an aggrecan-HA complex. Lower data set is from freshly prepared aggrecan-HA mixture. The inset shows similar representation for aggrecan bottlebrush in the SAXS region.
While the aggrecan bottlebrushes are detectable by SANS or SAXS, the large size of the aggrecan-HA complexes (>1 μm) makes their observation more convenient by light scattering. It is important to note that completion of complex formation takes many hours, during which the light scattering intensity gradually evolves, and which is accompanied by the reduction in the osmotic pressure (see Fig. 2).
Light scattering measurements from mixtures of aggrecan with HA (aggrecan-HA ratio=100) were performed before and after complex formation. Initially, these solutions contain free bottlebrushes and HA chains, as well as aggrecan microgels. As complex formation progresses, aggrecan-HA aggregates appear, which coexist with the other components and the scattering from all the components contributes to the total measured signal. In Fig. 4, the results from the initial (crosses, lower data set) and the final mixtures (open circles, upper data set) are indicated. In this representation, the data from the initial mixture are almost independent of q, corresponding to the swollen microgel particles with a branched internal structure, i.e., Imicrogel(q)∝q−2. When the large aggrecan-HA complexes develop, the intensity in the low-q region is enhanced with respect to the corresponding initial solution. The continuous curve through the upper data set in the figure is the fit to the cylindrical form factor described by Eq. 4, augmented by the flat baseline due to the contribution from the random assemblies. The radius of the aggrecan-HA secondary bottlebrush determined from this fit is R=3250 Å, in agreement with observations made by electron microscopy.5, 6 We note that Eq. 3 does not fit these light scattering data even qualitatively. This finding implies that aggrecan-HA complexes exhibit enhanced space-filling properties compared to the bottlebrush subunit. The ensuing higher brush density gives biomechanical properties to this complex that are superior to those of the random assemblies of aggrecan, both in terms of stability and compressive resistance. It is noteworthy that the high polymer (i.e., charge) density prevailing inside the secondary structures is likely to generate significant tension at the aggrecan-HA junction, which may explain why reinforcement by the link protein is necessary.
Dynamic properties of aggrecan assemblies
The osmotic and scattering measurements reveal the coexistence of aggrecan molecules with assemblies of different sizes, both in the absence and in the presence of HA, as illustrated schematically in Fig. 1. In addition to the primary function of aggrecan assemblies in compressive resistance, these molecules are known to contribute to the lubrication of cartilage. In what follows, we attempt to determine the dynamic properties of the aggrecan assemblies and the way they differ from solutions of linear polyelectrolytes.25, 26, 27 Since the scattering results indicate that HA-induced structural modifications occur in the length scale range between 1000 Å and several microns, it is reasonable to assume that the associated viscoelastic response may also be found in this length range. In this region, the relaxation rates detected by dynamic light scattering span from a few microseconds to several seconds.
DLS measures the relaxation rate Γ of concentration fluctuations. At large length scales, i.e., at small q, Γ is governed by diffusion processes and can be expressed as28
| (5) |
where η is the viscosity of the solvent and RH is the characteristic size of the fluctuating unit. The intensity correlation function g(2)(t)−1 of the light scattered by such fluctuations is then29
| (6) |
where t is the time delay and the optical coherence factor β≈1 is defined by the light collection geometry.
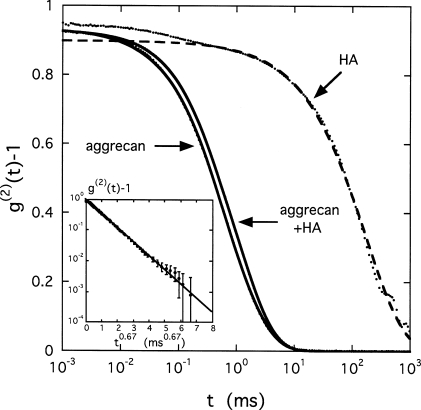
Figure 5 shows the correlation functions obtained by DLS at 90° scattering angle for an aggrecan solution without HA and for one containing aggrecan-HA complexes, at identical concentration, c=0.002 g∕cm3. Although the mean relaxation rate in the aggrecan-HA sample is slightly greater, the difference between these curves is small, indicating that the dynamics of the HA complex is hardly affected by its connectivity. For comparison, the correlation function measured in an aqueous HA solution at c=0.01 g∕cm3 is also shown in this figure. In the latter system, the correlation function is shifted to longer relaxation times by more than two orders of magnitude. Except for short time scales, the shape of the HA signal is identical to that of the aggrecan solutions.
Figure 5.
DLS correlation functions at 90° scattering angle for solutions of aggrecan and aggrecan with HA, as well as of pure HA at 1% (T=25 °C). Aggrecan concentration of 0.2%, aggrecan∕HA ratio of 100. The inset shows fit to g(2)(t)−1 vs t2∕3 for the aggrecan solution.
The curves in Fig. 5 cannot be described by the simple exponential relationship of Eq. 6, as the correlation function of aggrecan exhibits a wide range of relaxation times, extending from about 10−2 to 10 ms. The relaxation behavior of these systems can instead be more satisfactorily expressed in terms of the stretched exponential form30
| (7) |
in which the exponent takes the value of μ≈2∕3. The inset of Fig. 5 illustrates the linearity of this fit for the aggrecan solution in the representation g(2)(t)−1 versus t2∕3. For the HA solution, on the other hand, an additional fast decay is distinguishable in the relaxation that appears in Fig. 5 as a difference between the main relaxation curve (dashed line) and the data points at short times. This fast relaxation component does indeed obey Eq. 6 and is the signature of collective diffusion of the HA chains in the solution. The fast mode is associated with a well-defined diffusion coefficient that, in a good solvent, increases as a function of polymer concentration c. This is a well-known property of semidilute or concentrated solutions and gels composed of overlapping flexible polymer chains.28, 31 For the aggrecan systems, however, the relative rigidity of the bottlebrush, arising from the polysaccharide bristles, prevents mutual interpenetration and chain overlap, thereby inhibiting the collective concentration fluctuation modes.
The characteristic size of the fluctuating units can generally be estimated by analyzing the correlation functions in terms of the first cumulant32
| (8) |
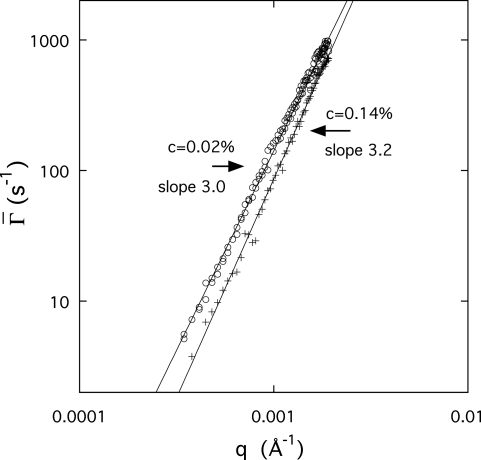
Figure 6 shows the q dependence of at two aggrecan concentrations (0.0002 and 0.0014 g∕cm3). obeys a power law of the form
| (9) |
where m≈3. In systems where no length scale smaller than 1∕q intrinsic to the specimen can be identified, the only characteristic length that can define the dynamics is the resolution of the observation, i.e., 1∕q. When combined with Eq. 5, this yields the q3 dependence of Eq. 9. Dependence of the relaxation rate on q3 is a characteristic of microgels,33 where internal motions dominate the dynamic response.28 The presence of such large microgels here confirms the conclusions drawn from osmotic and static scattering observations of the first part of this study. For the higher concentration sample in Fig. 6, the relaxation rate is slower, showing that the molecular mobility decreases with increasing concentration. The value of the exponent slightly in excess of 3 found for this sample is a sign of partially screened hydrodynamic interactions.34 No significant difference is detected in the relaxation behavior between the HA-free and HA-containing aggrecan solutions (not shown).
Figure 6.
Relaxation rate for aggrecan solutions at 0.0002 and 0.0014 g∕cm3, measured by DLS.
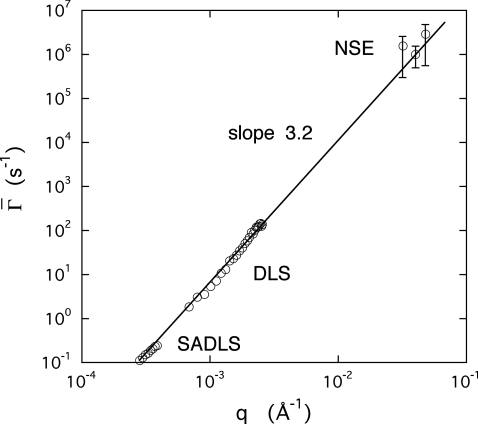
Further support for these findings is found in Fig. 7, which displays the combined results of measurements on a HA-free aggrecan solution by small angle dynamic light scattering, DLS and NSE. Over the two decades of transfer wave vector q range explored the relaxation rates vary as q3.2. The absence of collective diffusion modes, i.e., , in the relaxation spectrum confirms the lack of interpenetration among the aggrecan subunits in the microgel.
Figure 7.
Relaxation rate of a 0.6% aggrecan solution measured by SADLS, DLS, and NSE. The slope of the power law fit through the data points is 3.2.
CONCLUSIONS
The osmotic pressure measurements on aggrecan solutions reported here bring evidence of self-assembly of the bottlebrush subunits into microgel-like assemblies, similar to micelle formation. Random, loosely packed, microgels of several microns in size coexist in these systems with smaller associations, as well as individual aggrecan molecules. Self-assembly of aggrecan below 0.01 g∕cm3 results in a shoulder in the concentration dependence of the osmotic pressure, above which it exhibits power law behavior with a constant exponent close to 2. In the presence of hyaluronic acid, the formation of the aggrecan-HA complex at low aggrecan concentrations further reduces the osmotic pressure. In the latter solutions, the osmotic pressure and the compression modulus derived from it increase smoothly over the whole concentration range without any singular feature. In the physiological concentration range, the osmotic modulus of the aggrecan-HA solution is enhanced with respect to that of the random assemblies of aggrecan bottlebrushes. These findings are supported by light scattering measurements, which show that the aggrecan molecules in the aggrecan-HA complex are densely packed around the central HA filament. To ensure the integrity of such structures and overcome the repulsive electrostatic forces, high affinity between HA and aggrecan is required. The reinforcement by a link protein is therefore important for stabilizing the complex within the extracellular matrix. In cartilage, the immobilized aggrecan-HA assemblies are instrumental in providing the unique mechanical properties of this material, including its high resistance to different loading conditions.
Structural differences between the pure aggrecan solutions and those containing aggrecan-HA complexes are essentially confined to the light scattering region. Here, self-aggregation is observed in the pure aggrecan system, where loose and randomly packed microgels coexist with free bottlebrushes. With increasing concentration the packing density increases. The results from small angle neutron or x-ray scattering, however, are sensitive neither to changes in the concentration nor to the presence of HA, thus demonstrating the absence of significant interpenetration among neighboring molecules and that the aggrecan molecules maintain their individuality.
The relaxation rates of the concentration fluctuations, measured by dynamic light scattering and neutron spin echo, are proportional to q3, which is an indication that internal modes are probed, and is typical of microgels. This behavior, which prevails over distance scales extending from 3 μm⩾2π∕q⩾100 Å, provides independent confirmation of the microgel character of the aggrecan assemblies.
ACKNOWLEDGMENTS
This research was supported by the Intramural Research Program of the NICHD, NIH. We acknowledge NIST, U.S. Department of Commerce, and ILL, Grenoble, for access to the SANS instrument NG3 and the NSE instrument IN15, respectively, as well as the ESRF, Grenoble, France, for access to the CRG SAXS beamline BM2. This work utilized facilities supported, in part, by the National Science Foundation under Agreement No. DMR-0454672. The authors are grateful to Dr. Jack Douglas (NIST) for helpful comments.
References
- Biology of Proteoglycans (Biology of Extracellular Matrix), edited by Wight T. and Mecham R. (Academic, New York, 1987). [Google Scholar]
- Hascall V. C., IS1 Atlas of Science: Biochemistry 1, 189 (1988). [Google Scholar]
- Dean D., Han L., Ortiz C., and Grodzinsky A. J., Macromolecules 10.1021/ma047626k 38, 4047 (2005). [DOI] [Google Scholar]
- Dean D., Han L., Grodzinsky A. J., and Ortiz C., J. Biomech. 10.1016/j.jbiomech.2005.09.007 39, 2555 (2006). [DOI] [PubMed] [Google Scholar]
- Rosenberg I., Hellmann W., and Kleinschmidt A. K., J. Biol. Chem. 245, 4123 (1970). [PubMed] [Google Scholar]
- Rosenberg I., Hellmann W., and Kleinschmidt A. K., J. Biol. Chem. 250, 1877 (1975). [PubMed] [Google Scholar]
- Hascall V. C., J. Supramol Struct. 7, 101 (1977). [DOI] [PubMed] [Google Scholar]
- Ng L., Grodzinsky A. J., Sandy J. D., Plaas A. H. K., and Ortiz C., J. Struct. Biol. 10.1016/j.jsb.2003.08.006 143, 242 (2003). [DOI] [PubMed] [Google Scholar]
- Hardingham T. E. and Fosang A. J., FASEB J. 6, 861 (1992). [PubMed] [Google Scholar]
- Kisiday J., Jin M., Kurz B., Hung H. H., Semino C., Zhang S., and Grodzinsky A. J., Proc. Natl. Acad. Sci. U.S.A. 10.1073/pnas.142309999 99, 9996 (2002). [DOI] [PMC free article] [PubMed] [Google Scholar]
- Han L., Dean D., Ortiz C., and Grodzinsky A. J., Biophys. J. 10.1529/biophysj.106.091397 92, 1384 (2007). [DOI] [PMC free article] [PubMed] [Google Scholar]
- Perkins S. J., Nealis A. S., Dunham D. G., Hardingham T. E., and Muir I. H., Biochem. J. 285, 263 (1992). [DOI] [PMC free article] [PubMed] [Google Scholar]
- Horkay F. and Zrinyi M., Macromolecules 10.1021/ma00233a018 15, 815 (1982). [DOI] [Google Scholar]
- Horkay F., Burchard W., Geissler E., and Hecht A. M., Macromolecules 10.1021/ma00058a017 26, 1296 (1993). [DOI] [Google Scholar]
- Geissler E., Hecht A.-M., Rochas C., Bley F., Livet F., and Sutton M., Phys. Rev. E 10.1103/PhysRevE.62.8308 62, 8308 (2000). [DOI] [PubMed] [Google Scholar]
- Dudowicz J., Freed K. F., and Douglas J. F., J. Chem. Phys. 10.1063/1.481808 113, 434 (2000). [DOI] [Google Scholar]
- Douglas J. F., Dudowicz J., and Freed K. F., J. Chem. Phys. 10.1063/1.2785187 127, 224901 (2007). [DOI] [PubMed] [Google Scholar]
- Horkay F., Basser P. J., Hecht A. M., and Geissler E., (unpublished).
- Treppo S., Koepp H., Quan E. C., Cole A. A., Kuettner K. E., and Grodzinsky A. J., J. Orthop. Res. 10.1002/jor.1100180510 18, 739 (2000). [DOI] [PubMed] [Google Scholar]
- Stauffer D., Coniglio A., and Adam M., Adv. Polym. Sci. 44, 103 Berlin (1982). [Google Scholar]
- Small Angle X-ray Scattering, edited by Glatter O. and Kratky O. (Academic, London, 1982). [Google Scholar]
- Dozier W. D., Huang J. S., and Fetters L. J., Macromolecules 10.1021/ma00010a026 24, 2810 (1991). [DOI] [Google Scholar]
- Rathgeber S., Pakula T., Wilk A., Matyjaszewski K., and Beers K. L., J. Chem. Phys. 10.1063/1.1860531 122, 124904 (2005). [DOI] [PubMed] [Google Scholar]
- Rathgeber S., Pakula T., Wilk A., Matyjaszewski K., Lee H., and Beers K. L., Polymer 10.1016/j.polymer.2006.06.010 47, 7318 (2006). [DOI] [Google Scholar]
- Meechai N., Jamieson A. M., Blackwell J., Carrino D. A., and Bansal R., Biomacromolecules 10.1021/bm015520g 2, 780 (2001). [DOI] [PubMed] [Google Scholar]
- Meechai N., Jamieson A. M., Blackwell J., Carrino D. A., and Bansal R., J. Rheol. 10.1122/1.1463419 46, 685 (2002). [DOI] [Google Scholar]
- Papagiannopoulos A., Waigh T. A., Hardingham T., and Heinrich M., Biomacromolecules 10.1021/bm060287d 7, 2162 (2006). [DOI] [PubMed] [Google Scholar]
- de Gennes P. G., Scaling Concepts in Polymer Physics (Cornell, Ithaca, NY, 1979). [Google Scholar]
- Berne R. and Pecora R., Dynamic Light Scattering (Academic, London, 1976). [Google Scholar]
- Dubois-Violette M. and de Gennes P. G., Physics (N.Y.) 3, 37 (1967). [Google Scholar]
- Tanaka T., Hocker L. O., and Benedek G. B., J. Chem. Phys. 10.1063/1.1680734 59, 5151 (1973). [DOI] [Google Scholar]
- Koppel D. E., J. Chem. Phys. 10.1063/1.1678153 57, 4814 (1972). [DOI] [Google Scholar]
- Wu C. and Zhou S., Macromolecules 10.1021/ma950677k 29, 1574 (1996). [DOI] [Google Scholar]
- Doi M. and Edwards S. F., The Theory of Polymer Dynamics (Clarendon, Oxford, 1986). [Google Scholar]


