Abstract
NMR spin relaxation experiments provide a powerful tool for the measurement of global and local biomolecular rotational dynamics at subnanosecond time scales. Technical limitations restrict most spin relaxation studies to biomolecules weighing less than 10 kDa, considerably smaller than the average protein molecular weight of 30 kDa. In particular, experiments measuring ηz, the longitudinal 1HN–15N dipole-dipole (DD)∕15N chemical shift anisotropy (CSA) cross-correlated relaxation rate, are among those least suitable for use with larger biosystems. This is unfortunate because these experiments yield valuable insight into the variability of the 15N CSA tensor over the polypeptide backbone, and this knowledge is critical to the correct interpretation of most 15N-NMR backbone relaxation experiments, including R2 and R1. In order to remedy this situation, we present a new 1HN–15N transverse relaxation optimized spectroscopy experiment measuring ηz suitable for applications with larger proteins (up to at least 30 kDa). The presented experiment also yields κ, the site-specific rate of longitudinal 1HN–1H′ DD cross relaxation. We describe the ηz∕κ experiment’s performance in protonated human ubiquitin at 30.0 °C and in protonated calcium-saturated calmodulin∕peptide complex at 20.0 °C, and demonstrate preliminary experimental results for a deuterated E. coli DnaK ATPase domain construct at 34 °C.
INTRODUCTION
Numerous reports suggest that many proteins and nucleic acids are best described as dynamic ensembles of structures and that an understanding of these dynamics is important to understand the basis of molecular function.1, 2, 3, 4, 5, 6, 7 NMR spin relaxation has contributed significantly to our understanding of biomolecular dynamics.8, 9, 10, 11, 12, 13, 14, 15 At the picosecond-nanosecond time scale, numerous nuclear magnetic relaxation processes exist, each conveying different information regarding underlying dynamic processes. Classical examples of these rates include 15N R1 and R2 relaxations, which describe the rate of return to equilibrium following inversion of 15N z-magnetization and preparation of single-quantum coherence, respectively. However, many more nonequilibrium spin states can be prepared, each of which has a different relaxation rate back to equilibrium. Each of these rates depends on different spectral densities, and therefore all report on (slightly) different dynamical properties.16
One rate of modern interest17, 18, 19, 20, 21 is ηz, the rate constant for longitudinal 1HN–15N dipole-dipole (DD)∕15N chemical shift anisotropy (CSA) cross-correlated relaxation. The information contained in this rate helps separate the effects of CSA, chemical exchange broadening, and anisotropic tumbling on the classical relaxation rates.17 However, ηz is difficult to measure accurately because an interfering effect of 1H–1H dipolar cross relaxation renders the rate equations strongly multiexponential.17, 18, 19 At least five previous attempts have been made to resolve these issues.17, 18, 19, 20, 21 The first three approaches, although groundbreaking, suffer from various technical difficulties that prevent them from providing reliable rate determinations for small proteins. The most recent experiment21 yields reliable rates for small proteins, but cannot be used for larger protein systems due to lack of transverse relaxation optimized spectroscopy (TROSY) detection and insufficient sensitivity due to periods of fast-relaxing 15N transverse magnetization.
In this paper, we present a 1HN–15N TROSY (Ref. 22) experiment measuring ηz. This experiment is suitable for proteins with correlation times up to 20 ns, corresponding to the correlation time of at least 30 kDa proteins in aqueous solution. This experiment also measures quantitative site-specific rate constants for the 1HN spin flip rate κ, a process driven by longitudinal 1HN–1H′ DD cross relaxation. κ is also being recognized as an important dynamical parameter in recent work within the field.23, 24
THEORY
For an isolated amide 1HN–15N two-spin system, the longitudinal 15N relaxation is commonly expressed17 as
| (1) |
where represents the autorelaxation rate of Nz magnetization, represents the autorelaxation rate of 2NzHz longitudinal order, and ηz represents the rate of longitudinal 1HN–15N DD∕15N-CSA cross-correlated relaxation.
With a change of basis,20 the system may alternatively be expressed in terms of “proton-up” and “proton-down” states of longitudinal two-spin order:
| (2) |
where λα represents the autorelaxation rate of the proton-up state √2NzHα, λβ represents the autorelaxation rate of the proton-down state √2NzHβ, and ζ represents the 1HN spin flip rate in isolation.
From the master equation of relaxation25 with a Hamiltonian containing 15N–1H dipolar and 15N CSA terms (assuming axial symmetry), one derives
| (3) |
| (4) |
| (5) |
where cX=B0γXΔX, dXY=(μ0∕4π)γXγY(h∕2π)rXY−3, B0 is the spectrometer static magnetic field, γX is the gyromagnetic moment of nucleus X, ΔX is the magnitude of the axial CSA of nucleus X, μ0 is the permeability of free space, rXY is the distance between nuclei X and Y, ωX is the Larmor frequency for nucleus X, J(ωX) is the autocorrelation spectral density function for rotational motion of a particular vector at Larmor frequency X, and JXXY∕X(ω) is the cross-correlation spectral density function for relative motion between the internuclear vector between nuclei X and Y and the CSA principal axis of nucleus X at Larmor frequency ω.
In this notation, the spectral density for a rigid isotropic rotor with autocorrelation time τC is given by
| (6) |
We may rewrite Eq. 2 as
| (7) |
with
| (8) |
and
| (9) |
Truly isolated 1HN–15N spin systems, which would give rise to the above equations of relaxation, are very uncommon. Even at the high deuteration levels normally used in NMR spectroscopy of larger proteins, most 1HN–15N systems are still in significant dipolar contact with at least one other proton. This is particularly prevalent in alpha helices, where 1HN–1HN distances for neighboring residues are about 2.8 Å. We refer to these neighbor protons as 1H′ protons. The presence of these neighbor protons in close proximity to the amide proton allows the possibility of fast zero-quantum spin flips driven by large low-frequency spectral density terms. This causes √2NzHα states to exchange much more rapidly with √2NzHβ states than predicted by the mechanism described in Eq. 5. As we will see below, the zero-quantum spin flip rates actually dominate the √2NzHα∕√2NzHβ interchange process for larger proteins.
At first sight, it seems feasible to predict the √2NzHα∕√2NzHβ interchange process from the protein’s three-dimensional (3D) structure. This is indeed theoretically possible if one has access to the angular and distance dynamics of all of the interproton vectors, or if one may assume a rigid molecule. However, if either knowledge were available, it would not be necessary to conduct the experiment we want to describe here. In addition, the analysis is complicated by the fact that not all spin states are equally flip prone: For instance, a √2NzHα state with a H′β neighbor can execute fast transitions to a √2NzHβ–H′α state through a zero-quantum spin-flip process, while a √2NzHα state with a H′α neighbor can only flip to √2NzHβ–H′α or √2NzHβ–H′β states by slow single- and double-quantum relaxation processes, respectively. The combinatorics of this process become quite imposing when considering proton-rich areas; in addition, the differences between the rates of the zero-, single-, and double-quantum (as well as higher order) processes are dependent on the composite interproton vector dynamics. In the Appendix, we describe an approach to enumerate these different states, depending on the local structure. However, since exact prediction of the states and the relaxation dynamics is not possible, we will merely parametrize the different environments as a mixture of flip-prone and flip-immune systems, here labeled as (F) and (NF), respectively. We note that the above complications are intrinsic to the physics of the spin sytem and also affect other experiments in which ηz is measured directly. In particular, the complications caused by the proton flips enter into measured differences between the rates and [see Eq. 1]. Please also note that the distinction between (F) and (NF) protons enters the formalism because of the (artificial) separation of 15N Z magnetization in √2NzHα and √2NzHβ the distinction does not enter in Nuclear Overhauser Effect Spectroscopy (NOESY) spectra.
In our formulation, the longitudinal relaxation of 1HN–15N spin systems in mixed contact with other protons can be conveniently expressed as
| (10) |
defining the proton-proton flip rate κ.
κ may be expressed to good approximation by
| (11) |
with components dominated by the J(0) spectral density term. The neighbor-proton-catalyzed κ proton flip rate is consequently up to two orders of magnitude larger than the uncatalyzed λ proton flip rate in isolated NH spin systems.
The translation of this theory into experiment extends the formulation of symmetric reconversion for two states26 to the situation of the ηz∕κ experiment, which is that of two preparable and observable states (√2NzHα and √2NzHβ), each composed of a mixture of (F) and (NF) substates.
Equation 10 is solved analytically using MATLAB and yields
| (12) |
| (13) |
| (14) |
| (15) |
where
| (16) |
The four variations (denoted I, II, III, and IV) of the ηz∕κ experiment measure the evolution of linear combinations of these substates.
| (17) |
| (18) |
| (19) |
| (20) |
EXPERIMENTAL SECTION
Sample conditions
Experiments were carried out using three samples. The first sample consisted of 2.0 mM 15N-labeled protonated human ubiquitin in 90∕10% H2O∕D2O at pH 4.8 and 30.0 °C. The second sample consisted of 1.2 mM 15N, 13C-labeled protonated smMLCKp-complexed calcium-saturated chicken calmodulin (referred to hereafter as CaM∕smMLCKp) in 90∕10% H2O∕D2O at pH 6.5 and 20.0 °C (Ref. 10, 35). The third sample consisted of 0.6 mM 15N, 13C, 85%-2H-labeled E. coli DnaK 2-388 ATPase domain construct in 90∕10% H2O∕D2O and 5 mM ADP⋅Pi at pH 7.2 and 34.0 °C.
NMR spectroscopy
800 MHz ηz∕κ experiments were run on a Varian INOVA 800 spectrometer equipped with a triple-resonance cold probe, while 500 MHz ηz∕κ experiments were run on a Bruker Avance 500 spectrometer equipped with a triple-resonance room-temperature probe. Each ηz∕κ experiment consisted of acquiring sets of four two-dimensional 1HN–15N TROSY-type spectra at several different time points.
The ηz∕κ experimental pulse sequence has four variations corresponding to the four symmetric reconversion subexperiments. These subexperiments correspond to I, II, III, and IV from Eqs. 17, 18, 19, 20. Details of the ηz∕κ pulse sequence are given in Fig. 1. The sequence is essentially an S3E-filtered clean TROSY sequence with relaxation decays included.27 At point A, 2NzHz magnetization exists. The S3E filter between points A and B sacrifices half the magnetization, allowing either √2NzHα or √2NzHβ to pass through the relaxation period τ. Relaxation takes place between B and C with the initial pure state of √2NzHα or √2NzHβ diffusing into a mixture of √2NzHα and √2NzHβ magnetizations. The filter between C and D does nothing if √2NzHα is the component to be observed, or issues a 180° pulse on protons to convert √2NzHβ magnetization to √2NzHα magnetization if √2NzHβ is the component to be observed. The TROSY readout immediately following E then converts the √2NzHα component of magnetization into the narrow component of the TROSY multiplet structure.
Figure 1.
The ηz∕κ pulse sequence. Delays are Δ=1∕4JNH, δ≈1∕8JNH [S3E filter (Ref. 29)], and τ=the relaxation time for a given experiment. δ is adjusted to minimize cross-relaxation experiment intensity for τ≈0. For Bruker instruments, φ1={π∕8,π∕8,5π∕8,5π∕8} for I- and II-type experiments and ={3π∕8,3π∕8,7π∕8,7π∕8} for III- and IV-type experiments. ψ1, ψ2, ψ3, and receiver phase are phase alternated so as to accomplish axial peak suppression and Rance–Kay coherence selection (Refs. 32, 33). For Varian instruments, phase cycling will need to be altered per Roerhl et al. (Ref. 34).
Ubiquitin NMR spectroscopy
All ηz∕κ spectra acquired on the ubiquitin sample at 500 MHz contained 2k×80 complex points, with spectral widths of 7508 and 1774 Hz, for 1H and 15N dimensions, respectively. The 1H carrier was set to 4.699 ppm and the 15N carrier was set to 117.09 ppm. The interscan delay was set to 1.5 s. ηz∕κ experiments on ubiquitin at 500 MHz were run with 16 scans per spectrum at ten time points (τ=20, 40, 80, 120, 160, 200, 250, 300, 350, and 400 ms).
For purposes of comparison with the ηz∕κ experiment, ηz rates for the 0% glycerol ubiquitin sample were also measured at 500 MHz using the recently published protocol of Pelupessy et al. We refer to experiments using this pulse sequence as Pelupessy–Ferrage–Bodenhausen (PFB) experiments. PFB spectra contained 2k×100 complex points, with spectral widths of 7508 and 1774 Hz for 1H and 15N dimensions, respectively. The 1H carrier was set to 4.699 ppm and the 15N carrier was set to 117.09 ppm. The interscan delay was set to 1.5 s. PFB experiments were run with 128 scans per spectrum at three time points (150, 200, and 250 ms).
Calmodulin NMR spectroscopy
All ηz∕κ spectra acquired on the calmodulin sample at 800 MHz contained 2k×100 complex points, with spectral widths of 12 001 and 2500 Hz for 1H and 15N dimensions, respectively. The 1H carrier was set to 4.916 ppm and the 15N carrier was set to 118.9 ppm. The interscan delay was set to 0.8 s. ηz∕κ experiments on calmodulin at 800 MHz were conducted with 36 scans at 12 time points (τ=2, 10, 20, 30, 40, 50, 75, 100, 125, 150, 175, and 200 ms).
All ηz∕κ spectra acquired on the calmodulin sample at 500 MHz contained 2k×100 complex points, with spectral widths of 7508 and 1774 Hz, for 1H and 15N dimensions, respectively. The 1H carrier was set to 4.699 ppm and the 15N carrier was set to 117.09 ppm. The interscan delay was set to 0.8 s. ηz∕κ experiments at 500 MHz were run with 40 scans per spectrum at 11 time points (4, 20, 40, 60, 80, 100, 120, 160, 200, 250, and 300 ms).
DnaK NMR spectroscopy
All ηz∕κ spectra acquired on the DnaK sample at 800 MHz contained 4k×128 complex points, with spectral widths of 12 001 and 2500 Hz for 1H and 15N dimensions, respectively. The 1H carrier was set to 4.916 ppm and the 15N carrier was set to 118.9 ppm. The interscan delay was set to 0.8 s. ηz∕κ experiments on DnaK at 800 MHz were conducted with 16 scans.
Data fitting
After acquisition, processing of I-, II-, III-, and IV-type relaxation series, and extraction of peak heights in NMRPIPE,28 peak heights from each spectra are combined into the functions X(t) and Y(t).
| (21) |
| (22) |
The theoretically derived functions XT(t) and YT(t) are then fitted to X(t) and Y(t) by nonlinear least squares with 200 Monte Carlo trials for each residue.
| (23) |
| (24) |
where XT(t) and YT(t) are constructed from Eqs. 12, 13, 14, 15, 16, 17, 18, 19, 20. Five parameters are involved in the fit. These are the two rate parameters, κ and ηz, and three initial substate population parameters.
The three initial substate population parameters are as follows: PNF is the ratio of the amount of initial magnetization that is prepared in (NF) states [√2NzHα(NF)] to the amount that is prepared in (F) states [√2NzHα(F)]. It is assumed that PNF is equal for α and β states of HN. Pstray is the ratio of the amount of initial magnetization that is prepared in the undesired initial state (√2NzHβ being prepared when √2NzHα is intended, and vice versa) to the amount that is prepared in the desired initial state. Pstray is caused by pulse imperfections and cross-relaxation processes during the preparative phase of the pulse sequence. It is assumed that Pstray is equal for (F) and (NF) states. C is the efficiency of preparing √2NzHβ magnetization as opposed to preparing √2NzHα magnetization; it is very close to unity as described in the supplementary material. These three parameters set the initial substate populations as follows.
For √2NzHα starting conditions (I- and II-type experiments),
| (25) |
| (26) |
| (27) |
| (28) |
For √2NzHβ starting conditions (III- and IV-type experiments),
| (29) |
| (30) |
| (31) |
| (32) |
Inclusion of the first two time points (4 and 20 ms) in calmodulin fits at 500 MHz leads to values of κ that diverge sharply from values of κ resulting from fits excluding the first two time points. This phenomenon is not experienced in calmodulin fits at 800 MHz. We attribute this divergence to transient relaxation phenomena existing at short relaxation times. In order to correct for this divergence, we do not include the first two data points in the fitting procedure for 500 or 800 MHz calmodulin data. 500 MHz calmodulin rates therefore result from fitting to data at nine time points (40, 60, 80, 100, 120, 160, 200, 250, and 300 ms) while 800 MHz calmodulin rates result from fitting to data at ten time points (20, 30, 40, 50, 75, 100, 125, 150, 175, and 200 ms).
RESULTS
Comparison with existing experiments
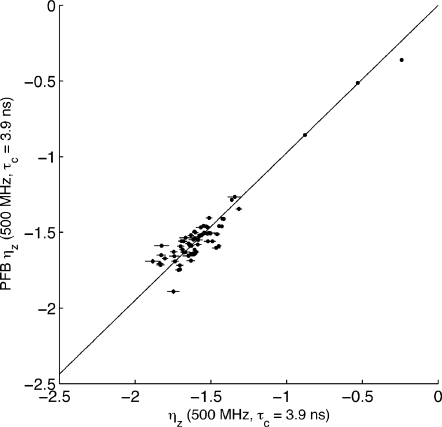
In Fig. 2, we compare the results of the proposed ηz∕κ experiment with the ηz experiment proposed by Pelupessy et al.,21 which we will refer to as the PFB experiment. The ubiquitin sample is used in the comparison. The PFB experiment takes a similar approach to the ηz experiment proposed by Kroenke et al.17 measuring ηz via interconversion between Nz and 2NzHz magnetizations and relying on Heteronuclear Single Quantum Correlation (HSQC) detection.
Figure 2.
Comparison of ηz rates determined from the ηz∕κ experiment described here and the PFB experiment described by Pelupessy et al. (Ref. 21). Sample consists of 2.0 mM 15N-labeled protonated human ubiquitin in 90∕10% H2O∕D2O at pH 4.8 and 30.0 °C. Instrument: Bruker AMX 500, no cryo probe.
Given the differences in spin physics and experimental methodology between the ηz∕κ and PFB experiments, the correlation in Fig. 2 is quite satisfying indeed.
The elegant PFB approach is unsuitable for measurement of ηz in larger systems. First, the PFB experiment cannot easily be rewritten as a TROSY experiment, since it involves the separation of Nz and 2NzHz components of magnetization, a task which is not straightforward under the quadruplet selection scheme of TROSY. Second, the experiment contains a Nz↔2NzHz interconversion block which requires a 5.55 ms period during which 15N magnetization is transferred into fast-relaxing transverse states, affecting sensitivity for larger systems.
Increasing the rotational correlation time: Prospects for use with larger proteins
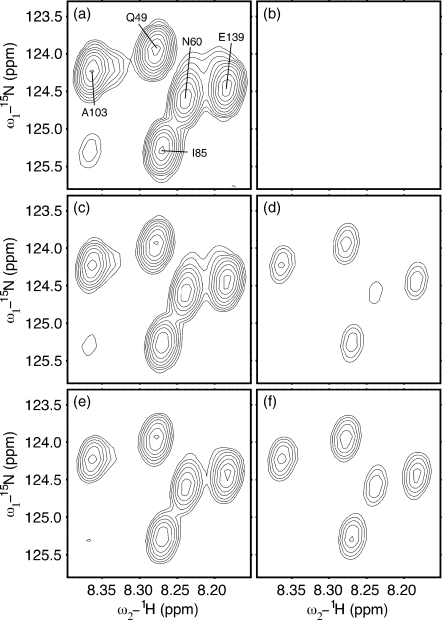
Figure 3 shows several spectra from an ηz∕κ experiment conducted on CaM∕smMLCKp at 20 °C and 800 MHz. All six spectra display the same region, which contains five 15N–1H TROSY peaks corresponding to residues Q49, N60, I85, A103, and E139. Spectra (a), (c), and (e) are from I-type autorelaxation experiments with relaxation times τ=20, 75, and 150 ms, respectively. Spectra (b), (d), and (f) are from II-type cross-relaxation experiments with relaxation times τ=20, 75, and 150 ms, respectively. Strong signal intensities in I-type experiments at τ=20 ms are visibly reduced by τ=150 ms, while signal intensities below the contour limit in II-type experiments at τ=20 ms have greatly strengthened by τ=150 ms. III-type experiments display similar behavior to II-type experiments, while IV-type experiments display similar behavior to I-type experiments.
Figure 3.
Evolution of I-type [(a), (c), and (e)] and II-type [(b), (d), and (f)] peaks in a subregion of ηz∕κ TROSY spectra of CaM∕smMLCKp at 20.0 °C. Three different relaxation times τ are shown: τ=20 ms [(a) and (b)], τ=75 ms [(c) and (d)], and τ=150 ms [(e) and (f)]. From left to right, the five residues shown are A103, Q49, I85, N60, and E139. Each spectrum was acquired in 1.5 h. All spectral plots were generated in SPARKY (Ref. 29).
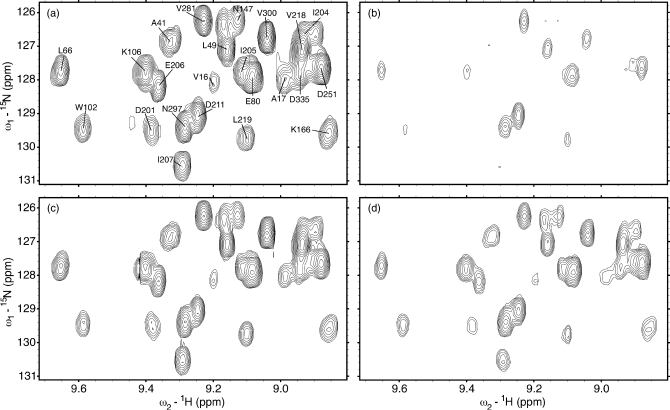
In order to demonstrate that the experimental protocol is applicable to proteins significantly larger than calmodulin, Fig. 4 shows several spectra from an ηz∕κ experiment conducted on a 44 kDa deuterated sample of E. coliDnaK ATPase domain 2-388 construct at 34 °C and 800 MHz. All four spectra display the same region. Spectra (a) and (c) are from I-type autorelaxation experiments with relaxation times τ=30 and 270 ms, while spectra (b) and (d) are from II-type cross-relaxation experiments with relaxation times τ=30 and 270 ms. Cross-peak intensities increase greatly from 30 to 270 ms, indicating that the experimental plan remains valid for larger proteins. The rate of increase is comparatively slow despite the larger protein size thanks to the retarding effects of deuteration on proton flip rates.
Figure 4.
Evolution of I-type [(a) and (c)] and II-type [(b) and (d)] peaks in a subregion of ηz∕κ TROSY spectra of an E. coli DnaK ATPase domain 2-388 construct at 34.0 °C. Two different relaxation times τ are shown: τ=30 ms [(a) and (b)] and τ=270 ms [(c) and (d)]. Each spectrum was acquired in 1.3 h. All spectral plots were generated in SPARKY (Ref. 29).
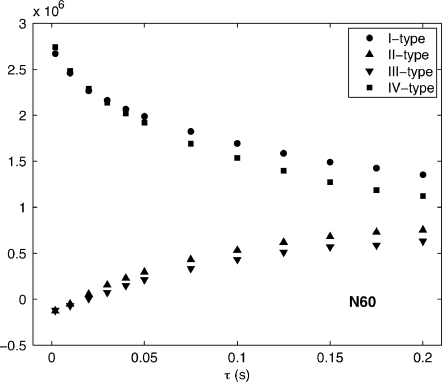
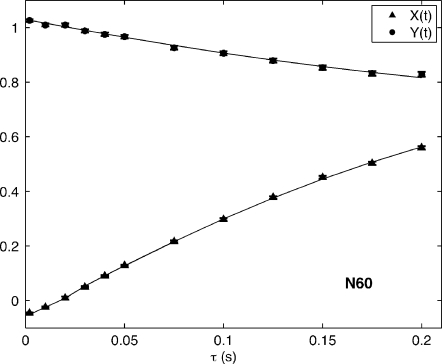
The time evolution of all four ηz∕κ variations is detailed for CaM∕smMLCKp residue N60 in Fig. 5. Peak volumes are extracted according to the methods described in Sec. 3C. Cross experiment volumes do not reach equilibrium with autoexperiment volumes as a consequence of the existence of (NF) magnetization described in Sec. 2 and the Appendix.
Figure 5.
Evolution of I-, II-, III-, and IV-type peak heights for N60 in ηz∕κ TROSY spectra of CaM∕smMLCKp at 20.0 °C using the 800 MHz spectrometer. All peak volumes are extracted with the NLINLS package within the NMRPIPE suite (Ref. 29).
Peak volume data of the type illustrated in Fig. 5 are combined according to Eqs. 20, 21 and fit according to the methods described in Sec. 3C. Figure 6 illustrates the results of these fits for residue N60. An important observation of note is that X(t) reaches an equilibrium value <1 for long relaxation times τ. This is a consequence of the existence of (NF) magnetization, as outlined in Sec. 2 and the Appendix.
Figure 6.
Curve fits of Eqs. 20, 21 to the data of Fig. 4, where and Y(t)=IV(t)∕I(t).
Only the (F) portion of the magnetization prepared as √2NzHα is available for rapid transfer to √2NzHβ in the II experiment, and vice versa in the III experiment. This leads to the II and III experiments never reaching the same intensity as the IV and I autoexperiments, even after equilibrium between (F) populations has been reached. This is because the I- and IV-type autoexperiments have access to both (F) and (NF) magnetization states. II- and III-type cross experiments, on the other hand, only report on the (F) population of the initial magnetization state. Further illustration of this phenomenon can be found in the Appendix.
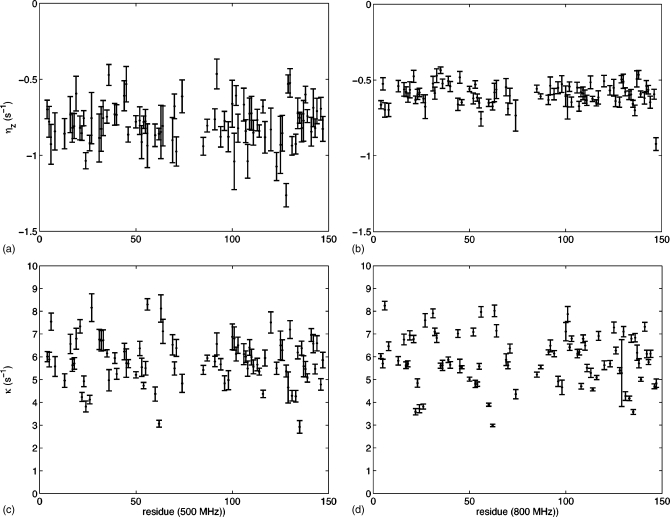
500 and 800 MHz ηz∕κ experiments on CaM∕smMLCKp yielded 81 residues which could be unambiguously assigned and successfully fitted in both 500 and 800 MHz datasets. CaM∕smMLCKp ηz and κ rates for these residues are displayed in Fig. 7. Figures 7a, 7b display ηz rates from 500 and 800 MHz spectra, respectively, while Figs. 7c, 7d display κ rates from 500 and 800 MHz spectra, respectively.
Figure 7.
ηz [(a) and (c)] and κ [(b) and (d)] rates for CaM∕smMLCKp derived from curve fits, as illustrated in Fig. 5. Rates are given for two different sample conditions: T=20.0 °C and B0=500 MHz [(a) and (b)] and T=20.0 °C and B0=800 MHz [(c) and (d)]. Error bars are obtained from 200 Monte Carlo fits to the data. The rates are also listed in the EPAPS material (Ref. 30).
All derived rates of ηz, κ and population estimates PNF, Pstray, and C data and errors for ubiquitin, and for smMLCKp-complexed calcium-saturated chicken calmodulin, are available as EPAPS documents.30
DISCUSSION
Internal consistency
ηz and κ rates are dependent on the spectral density functions and the static spectrometer field B0 according to Eqs. 8, 10. For this discussion, we will cast the spectral density functions in terms of a Lipari–Szabo model31
| (33) |
where the angle between the principal axes of the relaxation active Hamiltonians Ha and Hb is denoted θab with P2(cos θab)=(3 cos2 θab−1)∕2. When Ha and Hb are the same, the quantity Sab is the familiar order parameter S2. Otherwise, it is a cross-correlation order parameter (0<∣Sab∣<∣P2 cos θab∣).
As usual we define
| (34) |
where τc is the global rotational correlation time and where τloc is the correlation time of the local orientational fluctuations of (both) relaxation vector(s).
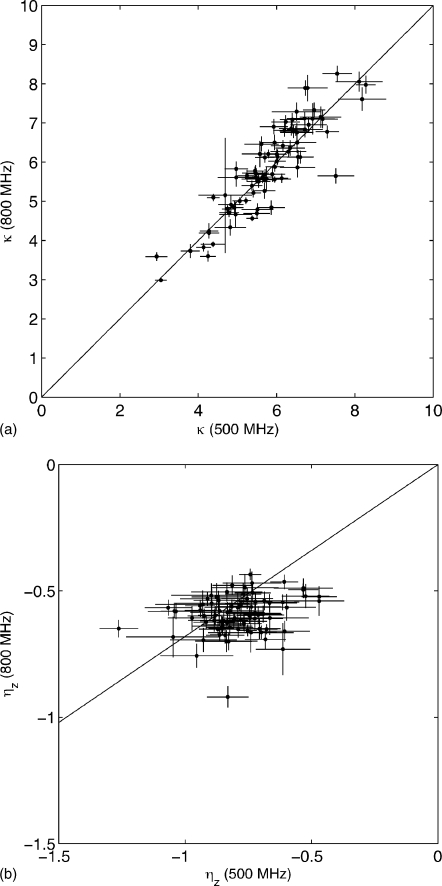
In Fig. 8a we compare 1H–1H spin-flip rates κ for calmodulin at B0=800 MHz and B0=500 MHz, both at 20.0 °C. Theoretically, the relationships between the experimental points should be, in terms of the spectral density function in Eq. 33,
| (35) |
whether local motion is present or not. We see that the points in Fig. 8a do indeed cluster around a line with slope 1. The correlation is very good, given the fact that these experiments were recorded at 500 MHz on a Bruker instrument and at 800 MHz on a Varian instrument. Deviations from the line with slope 1 are also theoretically possible when the approximation used in Eq 11 for κ is not valid; for instance, when higher-frequency components are present in the flip rates.
Figure 8.
Correlation plot of CaM∕smMLCKp κ (a) and ηz (b) rates at T=20.0 °C and B0=500 MHz (x-axis) against rates for T=20.0 °C and B0=800 MHz (y-axis). Solid lines indicate predicted slope of correlation.
In Fig. 8b we compare the ηz rates for calmodulin at B0=800 MHz and B0=500 MHz, both at 20.0 °C. Without local motion, the relationships between the experimental points are given by
| (36) |
The plot shows a weak correlation between the ηz rates at different frequencies. Since the correlation of Fig. 8a is strong, weak correlation cannot be ascribed entirely to experimental error. Indeed, since the cross-correlation spectral functions are very sensitive to local motions [see Eq. 33] we should not expect much correlation to begin with. Significantly, the rates at 500 MHz are systematically larger than expected on the basis of Eq. 36 as compared to the rates at 800 MHz. This indicates that the local motions may have dominant components at the low-nanosecond time scale.
Summarizing this section, we conclude from the good correlations in the κ plot that our experiment is sufficiently robust to measure these rates for proteins with larger correlation times. We emphasize (likely superfluously) that the ηz rates themselves are not interpretable in terms of local motions without detailed knowledge of the 15N CSA parameters [see Eq. 9]. The lack of correlations in the ηz rates between different fields and temperatures should be expected on the basis of the large effect of local motions on theoretical ηz rates. This is proof that these rates are very good sensors of such motions and that comparisons of these rates between different fields should yield very valuable information on the time scale of these motions. Note that the CSA variations drop out from the ratios such as in Eq. 36.
The κ rates report on both the structural and the dynamical proton environment of the amide protons. The discussion of their interpretation is beyond the scope of the current paper, and will be presented elsewhere.
Comparison with other approaches
Several groups have recognized the complications of measuring ηz experiments and have presented different solutions or approaches. Kroenke et al.17 were the first to realize the problems caused by the differences in Nz and 2NzHz relaxation rates, which render Eq. 1 difficult to solve. Their solution to the problem—periodically interchanging Nz and 2NzHz states and thereby averaging the different rates—is in theory a correct solution to the problem. However, for larger molecules the averaging elements, which are 5.55 ms periods of J-coupled transverse coherence, are a major drain on the sensitivity of the experiment. Additionally, the differences between Nz and 2NzHz relaxation rates become very large for large molecules. This means that more averaging elements are needed to maintain the averaging requirements of the experiment, leading to unacceptable losses in sensitivity. The recently presented symmetric reconversion form of the Kroenke experiment by Pelupessy et al.21 retains the same drawback since it contains an interchange block. Finally, these experiments cannot easily be cast in TROSY form because they must separate Nz and 2NzHz components of magnetization, a difficult task under the requirements of TROSY mixing and acquisition.
Felli et al.19 attempted broadband decoupling of proton-proton dipolar interaction through an off-resonance 1H spin lock during 2NzHz relaxation at the NOESY∕ROESY (Rotating Frame Nuclear Overhauser Effect Spectroscopy Magic) angle. However, this elegant approach can only work accurately if there is no internal motion, rendering the experiment unsuitable for dynamics measurements.
Wang et al.18 opted to measure proton flip rates indirectly by measuring selective 1H R1 values from the decay of amide proton diagonals in 3D NOESY experiments. Unfortunately, the NOE approach is not suitable for large molecules either because of spectral congestion of the NOESY diagonal. The current experiment is similar in spirit to this attempt, in the sense that we opt to measure the proton flip rates, albeit with an approach more suitable for use with larger proteins.
The ηz experiment proposed by Bouguet-Bonnet et al.20 begins with preparation of pure √2NzHα and √2NzHβ states, an idea that helped inspire our experiment. Our experiment differs in that we directly observe the behavior of √2NzHα and √2NzHβ magnetizations and treat the system in terms of √2NzHα and √2NzHβ throughout, rather than using a description in terms of Nz and 2NzHz. This streamlines the description of the system, allows the use of TROSY methods, and removes the difficulty encountered in fitting data from large molecule systems with strongly asymmetric and rates.
We have compared ηz rates obtained from our experiment with ηz rates from the PFB experiment21 at τc=3.9 ns. The correlation shown in Fig. 2 is quite satisfying for this low global correlation time. We consider this to be an important result because it provides a direct test of the validity of the novel theory developed in Sec. 2. The rates obtained for larger molecules are therefore trustworthy, even if we cannot make a direct comparison between our methods and earlier methods.
ACKNOWLEDGMENTS
This work was initially supported by a National Institutes of Health Molecular Biophysics Training Grant awarded to D.S.W., subsequently by National Science Foundation Grant No. MCB 0135330, and finally by NIH Grant No. GM63027. The authors thank the National Science Foundation, the National Institutes of Health, the W. M. Keck Foundation, and the Michigan Tri-Corridor Grant Program for support of the instruments used in this work. They also thank Dr. F. Ferrage and Dr. I. Kuprov (University of Nancy, France) for helpful comments, Dr. A. Kurochkin (U. Michigan) for technical support and advice, Dr. E. B. Bertelsen (U. Michigan) for the sample and NMR assignments of DnaK, and Dr. A. J. Wand (U. Pennsylvania) for the sample of calmodulin.
APPENDIX: ENUMERATION OF FLIP-PRONE AND FLIP-IMMUNE AMIDE PROTONS
Consider an amide proton with N neighbor protons which are capable of undergoing zero-quantum spin flips (referred to as the rate κ) with the amide proton. At the large molecule limit, these flip rates are up to two orders of magnitude faster than the overall proton R1 relaxation rates. Once perturbed, a group of N+1 protons will relax to equilibrium in two stages. In the first stage, magnetization will equalize throughout the proton group by κ-type processes. In the second stage, the magnetization spread across the proton group will return to “true” equilibrium by conventional proton R1 relaxation. In the large molecule limit, this is completely equivalent to NOE-type cross relaxation, which consists of a fast “buildup” followed by a slow decay. In the following discussion, we will focus on the first stage, that of proton group equilibration caused by κ relaxation. In the ηz∕κ relaxation experiment, the use of symmetric reconversion accounts for the second-stage equilibration caused by proton R1 relaxation, rendering it irrelevant to the experiment under discussion.
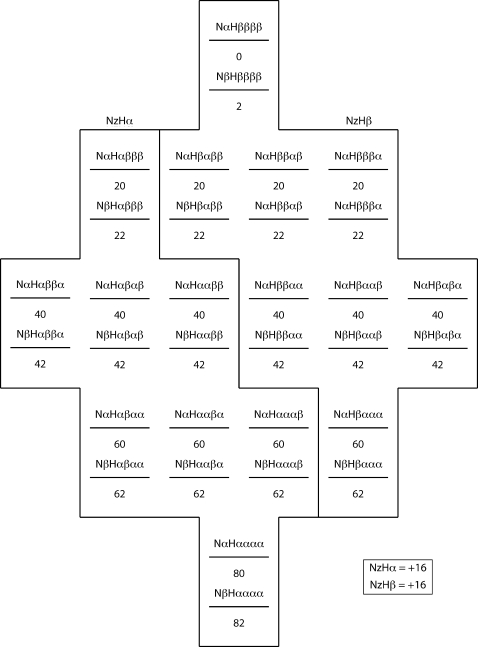
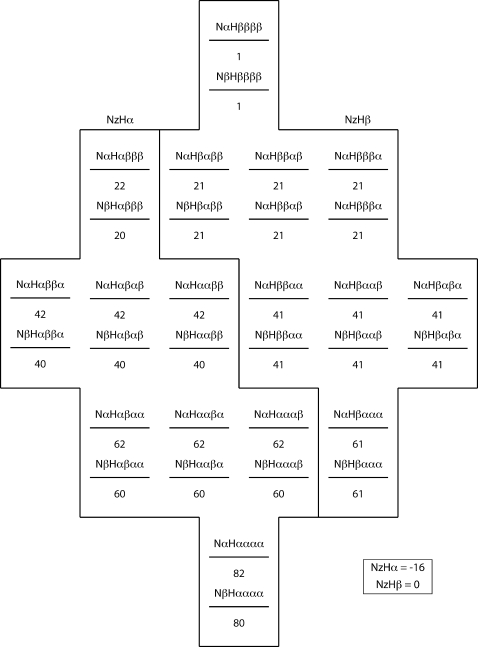
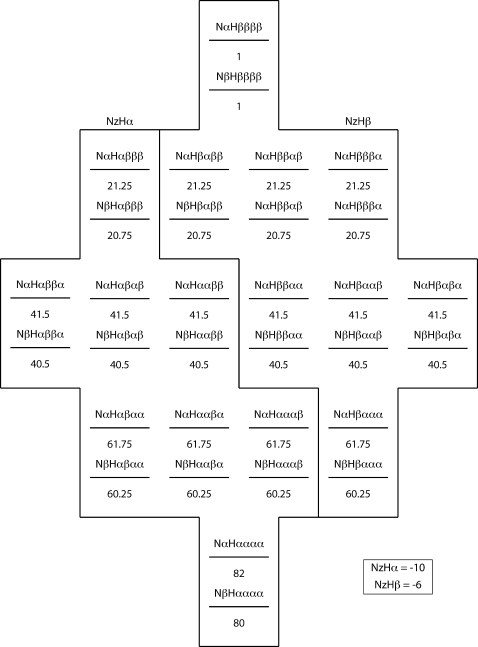
The essential feature of κ, or flip-flop, relaxation in a proton group is that a group of N+1 protons prepared with j α spins and N+1−j β spins will conserve j α spins and N+1−j β spins at the end of the κ relaxation period. We illustrate the principle, and its effects on our experiments, with model population distributions for a NH system with three neighbor protons (N=3) at several points during the ηz∕κ experiment. As shown in Figs. 91011, population distributions are described in terms of an energy-level diagram, with the population of each substate in the distribution given by a number below that state’s energy level. Substates are labeled according to the scheme Nx1Hx2x3x4x5, where x may be either α or β. x1 represents the state of the amide nitrogen spin, x2 represents the state of the amide proton spin, and x3, x4, and x5 represent the states of the N=3 neighbor protons
Figure 9.
Equilibrium population distribution for a NH system with three proton neighbors.
Figure 10.
The population distribution for a negative NzHα population state with three proton neighbors, obtained by an S3E filter (Ref. 27) which purges (equalizes) the states corresponding to NzHβ.
Figure 11.
The population distribution obtained at first-stage equilibrium due to fast zero-quantum flip-flops(κ-driven averaging) within each proton multiplicity.
Each substate is a component of the larger NzHα or NzHβ magnetization states observed during the ηz∕κ experiment. Substate affiliation with NzHα or NzHβ magnetization is indicated by black borders on the energy-level diagrams. The contribution of the various substate pairs to the overall intensity of NzHα or NzHβ magnetization is calculated by taking the difference between the NβHx2x3x4x5 and NαHx2x3x4x5 components of a given pair, and then summing over all pairs.
The energy-level diagram is set up such that the initial population difference between a lower-energy (α) and a higher-energy (β) proton state is 20, while the population difference between a lower-energy (β) and a higher-energy (α) nitrogen state is 2. The exact magnitude of this population difference is not relevant to the first-stage equilibrium ratio XMi∕AMi—the only relevant parameter is the number of neighbor protons Ni.
Figure 9 shows the equilibrium state population distribution corresponding to Nz magnetization for an amide system with N=3 neighbor protons; both NzHα and NzHβ magnetizations have a polarization of +16 units. Figure 10 shows the population distribution of the system after selecting for negative NzHα magnetization with an S3E element and subsequent gradient filter. Following the selection of NzHα magnetization and removal of NzHβ magnetization, populations of states with equal energy (e.g., NαHαβαα and NαHααβα) undergo rapid equalization due to fast κ spin flip-flop processes. Figure 11 illustrates the effect of this rapid κ averaging. During the relaxation period following the S3E and gradient, the NzHα magnetization rapidly relaxes from an initial state of −16 to −10 units, i.e., the fast flip-flop relaxation does not take it back to the equilibrium +16 state. In practice, one carries out a 180° phase cycling of the first 15N pulse in concert with receiver phase cycling, leading to −16 NzHα∕0 NzHβ magnetization and +16 NzHα∕0 NzHβ magnetization on alternate scans. In the case of +16 NzHα∕0 NzHβ magnetization, first-stage equilibration processes drive NzHα magnetization from an initial state of +16 to +10 units. Taking the receiver inversion into account, the result of the two scans combined describes a relaxation process from −32 to −20 units. The phase cycle does not relax it back to 0, as is the case in phase-cycled R1 experiments.
The magnetization leached from NzHa by κ-driven averaging processes ends up in substates affiliated with NzHβ magnetization. The κ-driven averaging of magnetization among states with equal energy levels causes NzHβ magnetization to rapidly build from an initial state of 0 to −6 units (or −12 units for the two scans combined as above).
The decay of initially prepared NzHa magnetization during first-stage equilibration is observed in the “I” symmetric reconversion component of the ηz∕κ experiment. The concurrent buildup of NzHβ magnetization is the cross relaxation observed in the “II” experiment of the symmetric reconversion experiment. The reverse situation of NzHβ decay and NzHα buildup applies for the “IV” and “III” experiments, respectively. In these cases, the S3E selects for pure NzHβ magnetization.
In the case of an amide system with three neighbor protons (Ni=3) prepared with pure NzHα magnetization, our model predicts that the ratio NzHβ∕NzHα=3∕5 will be observed at first-stage equilibrium. This ratio, referred to as (NzHβ∕NzHα)fse, is a free parameter in our data fitting protocol.
To expand the description to a larger number of spins, consider the proton group Gi belonging to the ith amide proton in the protein sequence. Gi contains Ni+1 protons, where Ni varies with the local environment of the amide proton. The population of all instances of a particular proton group Gi in the sample may be divided into subgroups Gi0 containing no α spins, Gi1 containing one α spin, and so on, ending with Gi(Ni+1) containing Ni+1 α spins. Since the number of α and β spins in Gij is conserved under κ relaxation, the Ni+2 subgroups Gij are segregated from each other under κ relaxation. Each subgroup equilibrates separately.
One of the Ni+1 protons in a proton group Gi is the amide proton spin, and it is the state of this spin that is observed in the experiment. Different subgroups Gij have different proportions of their population with the amide proton spin in the α state. For instance, Gi0 contains no α spins and therefore has no states where the amide proton spin is in the α state, while Gi1 contains one α spin and therefore has one state where the amide proton spin is in the α state. Gi(Ni+1) has all Ni+1 spins in the α state, and consequently all of its states have the amide proton spin in the α state. Since statistical mechanics dictates that there can be only one state where all Ni+1 spins are in the α state, Gi(Ni+1) also has one state where the amide proton spin is in the α state.
The number of states encompassed by a subgroup Gij is given by the number of ways to arrange j α spins among Ni+1 total spins, and is given by the binomial coefficient . The number of states in Gij that have their amide proton spin in the α state is given by the number of ways to arrange j−1 remaining α spins among Ni remaining spins for 0<j⩽Ni+1 and is 0 for j=0. The number of states in Gij that have their amide proton spin in the β state is given by the number of ways to arrange Ni−j remaining β spins among Ni remaining spins for all 0⩽j<Ni+1 and is 0 for j=Ni+1.
The fraction aij of states in Gij whose amide proton spin is in the α state is consequently
| (A1) |
while the fraction bij of states in Gij whose amide proton spin is in the β state is given by
| (A2) |
The κ relaxation experiment is conducted by preparing either the amide proton α states or the amide proton β states of the proton groups Gi, allowing the Gi to equilibrate for a time t, and measuring the ratio of “cross-magnetization” intensity (magnetization in the opposite state from that prepared) to “automagnetization” intensity (magnetization in the same state as that prepared).
Consider the case where α magnetization is prepared. The total equilibrium automagnetization AMi will be equal to the sum over j (all subgroups) of the number of states in Gij that have their amide proton spin in the α state (the initial states prepared) multiplied by the fraction aij of states in Gij whose amide proton spin is in the α state (the equilibrium distribution of α states among the states of Gij):
| (A3) |
where j=0 is not included in the sum. Conversely, the total equilibrium cross magnetization XMi will be proportional to the sum over j (all subgroups) of the number of states in Gij that have their amide proton spin in the α state (the initial states prepared) multiplied by the fraction bij of states in Gij whose amide proton spin is in the β state (the equilibrium distribution of α states among the states of Gij):
| (A4) |
The first-stage equilibrium ratio of cross to auto magnetization in the κ relaxation experiment for a given proton group Gi is then equal to
| (A5) |
where the ratio is the same whether amide proton α or β states are initially prepared.
Since the A(t) measurement in the ηz∕κ relaxation experiment involves the square root of two ratios of cross to auto magnetization, both of which have identical equilibrium values, the preceding equation gives the first-stage equilibrium value of A(t) as a function of Ni.
The NzHβ∕NzHα=3∕5 ratio at first-stage equilibrium corresponds to that predicted earlier from Fig. 11 for a system with Ni=3. When Ni becomes large, the NzHβ∕NzHα ratio becomes unity.
In this analysis, we have assumed that κ-driven averaging among neighbor protons occurs much faster than all other longitudinal relaxation processes, an assumption that does not hold for neighbor protons which are distant and/or disordered with respect to the amide proton. If this assumption is invalid, first-stage and second-stage equilibration processes will be mixed together and equilibration behavior will become more complicated. We have neglected the fact that the neighbor protons themselves have other neighbor protons which will cause magnetization to diffuse throughout the sample as a second-order effect, and we have neglected the possibility that some amide systems may share immediate neighbor protons. These neglected phenomena will complicate the diffusion of magnetization through the sample by κ-driven averaging. The analytical expressions derived above are therefore useful for explanation, but not for prediction. We thus must treat the ratio (NzHβ∕NzHα)fse as a free parameter in our data fitting, 0.333<(NzHβ∕NzHα)fse<1, even if the protein structure is known at high resolution.
References
- Karplus M. and Kuriyan J., Proc. Natl. Acad. Sci. U.S.A. 10.1073/pnas.0408930102 102, 6679 (2005). [DOI] [PMC free article] [PubMed] [Google Scholar]
- Maragakis P. and Karplus M., J. Mol. Biol. 10.1016/j.jmb.2005.07.031 352, 807 (2005). [DOI] [PubMed] [Google Scholar]
- Hoerter J. A., Lambert M. N., Pereira M. J., and Walter N. G., Biochemistry 10.1021/bi048533y 43, 14624 (2004). [DOI] [PubMed] [Google Scholar]
- Min W., English B. P., Luo G., Cherayil B. J., Kou S. C., and Xie X. S., Acc. Chem. Res. 10.1021/ar040133f 38, 923 (2005). [DOI] [PubMed] [Google Scholar]
- Bourgeois D., Vallone B., Arcovito A., Sciara G., Schotte F., Anfinrud P. A., and Brunori M., Proc. Natl. Acad. Sci. U.S.A. 10.1073/pnas.0508880103 103, 4924 (2006). [DOI] [PMC free article] [PubMed] [Google Scholar]
- Xu Q., Guo H., Wlodawer A., and Guo H., J. Am. Chem. Soc. 10.1021/ja058831y 128, 5994 (2006). [DOI] [PMC free article] [PubMed] [Google Scholar]
- Dyson H. J. and Wright P. E., Nat. Rev. Mol. Cell Biol. 6, 197 (2005). [DOI] [PubMed] [Google Scholar]
- Kay L. E., Torchia D. A., and Bax A., Biochemistry 10.1021/bi00449a003 28, 8972 (1989). [DOI] [PubMed] [Google Scholar]
- Mittermaier A. and Kay L. E., Science 10.1126/science.1124964 312, 224 (2006). [DOI] [PubMed] [Google Scholar]
- Wang T., Frederick K. K., Igumenova T. I., Wand A. J., and Zuiderweg E. R. P., J. Am. Chem. Soc. 10.1021/ja045743p 127, 828 (2005). [DOI] [PubMed] [Google Scholar]
- Brath U., Akke M., Yang D., Kay L. E., and Mulder F. A. A., J. Am. Chem. Soc. 10.1021/ja0570279 128, 5718 (2006). [DOI] [PubMed] [Google Scholar]
- Best R. B., Clarke J., and Karplus M., J. Mol. Biol. 10.1016/j.jmb.2005.03.001 349, 185 (2005). [DOI] [PubMed] [Google Scholar]
- Wang L., Pang Y., Holder T., Brender J. R., Kurochkin A., and Zuiderweg E. R. P., Proc. Natl. Acad. Sci. U.S.A. 10.1073/pnas.121069998 98, 7684 (2001). [DOI] [PMC free article] [PubMed] [Google Scholar]
- Eisenmesser E. Z., Millet O., Labeikovsky W., Korzhnev D. M., Wolf-Watz M., Bosco D. A., Skalicky J. J., Kay L. E., and Kern D., Nature (London) 10.1038/nature04105 438, 117 (2005). [DOI] [PubMed] [Google Scholar]
- Zhang Q., Sun X., Watt E. D., and Al-Hashimi H. M., Science 10.1126/science.1119488 311, 653 (2006). [DOI] [PubMed] [Google Scholar]
- Fischer M. W. F., Majumdar A., and Zuiderweg E. R. P., Prog. Nucl. Magn. Reson. Spectrosc. 10.1016/S0079-6565(98)00023-5 33, 207 (1994). [DOI] [Google Scholar]
- Kroenke C. D., Loria J. P., Lee L. K., Rance M., and A. G.PalmerIII, J. Am. Chem. Soc. 10.1021/ja980832l 120, 7905 (1998). [DOI] [Google Scholar]
- Wang L., Kurochkin A. V., and Zuiderweg E. R. P., J. Magn. Reson. 10.1006/jmre.2000.2064 144, 175 (2000). [DOI] [PubMed] [Google Scholar]
- Felli I. C., Desvaux H., and Bodenhausen G., J. Biomol. NMR 10.1023/A:1008301016608 12, 509 (1998). [DOI] [PubMed] [Google Scholar]
- Bouguet-Bonnet S., Mutzenhardt P., and Canet D., J. Biomol. NMR 10.1023/B:JNMR.0000048948.66235.d9 30, 133 (2004). [DOI] [PubMed] [Google Scholar]
- Pelupessy P., Ferrage F., and Bodenhausen G., J. Chem. Phys. 10.1063/1.2715583 126, 134508 (2007). [DOI] [PubMed] [Google Scholar]
- Pervushin K., Riek R., Wider G., and Wüthrich K., Proc. Natl. Acad. Sci. U.S.A. 10.1073/pnas.94.23.12366 94, 12366 (1997). [DOI] [PMC free article] [PubMed] [Google Scholar]
- Igumenova T. I. and A. G.PalmerIII, J. Am. Chem. Soc. 10.1021/ja061692f 128, 8110 (2006); [DOI] [PubMed] [Google Scholar]; Igumenova T. I. and A. G.PalmerIII, J. Am. Chem. Soc. 10.1021/ja061692f128, 8110 (2006). [DOI] [PubMed] [Google Scholar]
- Gong Q. and Ishima R., J. Biomol. NMR 10.1007/s10858-006-9125-7 37, 147 (2007). [DOI] [PubMed] [Google Scholar]
- Goldman M., Quantum Description of High-Resolution NMR in Liquids (Oxford University Press, Oxford, 1991). [Google Scholar]
- Ferrage F., Pelupessy P., Cowburn D., and Bodenhausen G., J. Am. Chem. Soc. 10.1021/ja0600577 128, 11072 (2006). [DOI] [PMC free article] [PubMed] [Google Scholar]
- Schulte-Herbrüggen T. and Sørensen O. W., J. Magn. Reson. 10.1006/jmre.2000.2020 144, 123 (2000). [DOI] [PubMed] [Google Scholar]
- Delaglio F., Grzesiek S., Vuister G. W., Zhu G., Pfeifer J., and Bax A., J. Biomol. NMR 10.1007/BF00197809 6, 277 (1995). [DOI] [PubMed] [Google Scholar]
- Goddard T. D. and Kneller G. D., SPARKY 3, University of California, San Francisco.
- See EPAPS Document No. E-JCPSA6-128-012812 for one table with fitted rates for ubiquitin, extracted from the experiments, and for two tables with fitted rates for smMLCKp-complexed calcium-saturated chicken calmodulin, extracted from the experiments, at different spectrometer field strengths. This document can be reached through a direct link in the online article’s HTML reference section or via the EPAPS homepage (http://www.aip.org/pubservs/epaps.html).
- Lipari G. and Szabo A., J. Am. Chem. Soc. 10.1021/ja00381a009 104, 4546 (1982). [DOI] [Google Scholar]
- Kay L. E., Keifer P., and Saarinen T., J. Am. Chem. Soc. 10.1021/ja00052a088 114, 10663 (1992). [DOI] [Google Scholar]
- Rance M., Loria J. P., and A. G.PalmerIII, J. Magn. Reson. 10.1006/jmre.1998.1626 136, 92 (1999). [DOI] [PubMed] [Google Scholar]
- Roerhl M. H. A., Heffron G. J., and Wagner G., J. Magn. Reson. 10.1016/j.jmr.2005.02.001 174, 325 (2005). [DOI] [PubMed] [Google Scholar]
- Lee A. L., Kinnear S. A., and Wand A. J., Nat. Struct. Biol. 10.1038/71280 7, 72 (2000). [DOI] [PubMed] [Google Scholar]


