Abstract
The LYS24∕29NLE double mutant of villin headpiece subdomain (HP35) is the fastest folding protein known so far with a folding time constant of 0.6 μs. In this work, the folding mechanism of the mutant has been investigated by both conventional and replica exchange molecular dynamics (CMD and REMD) simulations with AMBER FF03 force field and a generalized-Born solvation model. Direct comparison to the ab initio folding of the wild type HP35 enabled a close examination on the mutational effect on the folding process. The mutant folded to the native state, as demonstrated by the 0.50 Å Cα-root mean square deviation (RMSD) sampled in both CMD and REMD simulations and the high population of the folded conformation compared with the denatured conformations. Consistent with experiments, the significantly reduced primary folding free energy barrier makes the mutant closer to a downhill folder than the wild type HP35 that directly leads to the faster transition and higher melting temperature. However, unlike the proposed downhill folding which envisages a smooth shift between unfolded and folded states without transition barrier, we observed a well-defined folding transition that was consistent with experiments. Further examination of the secondary structures revealed that the two mutated residues have higher intrinsic helical preference that facilitated the formation of both helix III and the intermediate state which contains the folded segment helix II∕III. Other factors contributing to the faster folding include the more favorable electrostatic interactions in the transition state with the removal of the charged groups from LYS. In addition, both transition state ensemble and denatured state ensemble are shifted in the mutant.
INTRODUCTION
The native structures of protein are the outcome of the delicate balance among enthalpic and entropic forces. This balance can be disrupted by the change in the environment such as temperature, solvent, and salt concentration and cause many neurodegenerate diseases.1 To a lesser extent, mutations may affect the stability and folding process of proteins. The effect of point mutations depends on both the nature and position of the mutations. Generally, conservative mutations especially on surface residues have minor effect on protein structures, but nonconservative mutations on deeply buried residues can have profound effect. Mutational effects can be measured in experiments including Φ-value analyses which enable a systematic assessment on the mutational effects to protein stability and folding kinetics.2 However, exactly how the mutations disrupt the energy balance is usually not well understood due to the difficulty in evaluating the energy contributions from experimental data.
Owing to the ability to dissect energy contributions and the high spatial and temporal resolutions, computer simulations have been applied to the investigations of mutational effects. Yet, because of the enormous challenge both in reaching the native state directly by computer simulations from fully denatured state and in sampling the transition-state ensemble (TSE), most of the studies have focused on protein stability whereby only the experimental native state and the denatured-state ensembles (DSE) (typically represented as random coils) are needed. Using free energy calculation, Hendsch et al.3 predicted the stabilization effect of replacing buried polar groups with nonpolar residues which was verified in the circular dichroism experiment. Veenstra and Kollman4 applied free energy calculation to the mutations of T4 lysozyme and achieved good agreement with experiments in both stabilizing and destabilizing mutants. In the study of Zoete and Meuwly,5 the side chains of amino acids were treated as “pseudoligand” and the molecular mechanics and generalized born∕surface area (MM-GBSA) approach was applied to evaluate the contribution to protein stability, demonstrating promising results on monomer insulin. Based on molecular dynamics (MD) simulation, Santos et al.6 proposed that the changed stability of two mutants of β-lactamase was due to the altered van der Waals and hydrogen bonding network, respectively. However, because of the lack of sampling to either the transition state or the folding “pathways,” these studies were limited to protein stability and were unable to provide information on the folding kinetics.
Complementary to the stability study by free energy calculations, unfolding simulations have been exploited to probe TSE and DSE.7, 8 Examples of the work included the studies of Pan and Daggett9 who applied free energy perturbation to the hydrophobic deletion of chymotrypsin inhibitor 2 using transition-state and denatured-state structures from unfolding simulations and reached agreement with the Φ-value analysis experiment. Cregut and Serrano10 employed unfolding simulations to study the mutational effects on the B1 domain of protein G, which agreed with experiments. Eleftheriou et al.11 also applied thermal unfolding to the W62G mutant of lysozyme and found that the mutant has a lower stability compared with the wild type. While the results from these studies are encouraging, they did not directly sample the folding pathways and folding processes.
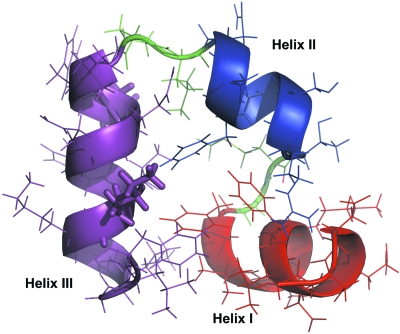
Villin headpiece subdomain (HP35) is a small and fast-folding protein which attracted many experimental and simulation studies. The structure of this 35-residue helical protein has been determined by both nuclear magnetic resonance (NMR) and x-ray crystallography.12, 13 The folding of HP35 has been investigated by experiments using unfolding, truncation, T-jump, and solid-state NMR techniques.14, 15, 16, 17 The folding time of HP35 was determined to be around 4.3 μs from T-jump experiment.17 HP35 was considered as a two-state folder but this notion has been challenged by a solid-state NMR experiment and by T-jump kinetic experiment in which a two-stage unfolding was observed.16, 17 In an effort to further examine the “speed limit” of protein folding, Kubelka et al. mutated the two partially buried LYS residues (LYS24 and 29, Fig. 1) to nonpolar residues NLE (nonstandard amino acid, see Discussion). The mutant can fold with a time constant of 0.6 μs which is very close to the theoretical limit.18
Figure 1.
The structure of the HP35 double mutant determined by x-ray crystallography (PDB code 2F4K). The backbone is shown as cartoon and the mutated residues (LYS24NLE and LYS29NLE) are shown as sticks. In this view, helices II (in blue) and III (in magenta) are in the plane and helix I (in red) is nearly perpendicular to the plane.
Despite the small size and fast folding, it has been difficult to fold HP35 to its native state. In earlier works, the folding of HP35 has been attempted by 1.0 μs simulations with explicit solvent and by folding@home with short trajectories by both implicit and explicit solvent utilizing enormous computing power.19, 20, 21 Attempts have been made by numerous groups using moderate computing power,22, 23, 24, 25, 26, 27, 28, 29 including the first attempt to fold HP35 using simulation with implicit solvent model by Shen and Freed22 that reached an Cα-RMSD of 3.0 Å, coarse-grained simulation by De Mori et al.,27 Go-model simulation by Faccioli et al.,29 and basin-hopping simulation by Derreumaux28 and Carr and Wales.26 Jayachandran et al.21 were able to fold residues 9–32 (corresponding to the helix II∕III segment) to 1.7 Å. Their recent simulations on the HP35 double mutant30 with explicit solvent demonstrated diverse folding pathways and highlighted the complexity of the free energy landscape.
In our recent work, we applied AMBER FF03 force field and a generalized-Born (GB) model to the folding of HP35 using both conventional MD (CMD) with long trajectories (1 μs) and replica exchange MD (REMD).31, 32 The protein folded to the native state as shown by the lowest Cα-RMSD <0.5 Å in both CMD and REMD simulations. Based on the simulations, we proposed a folding pathway in which the protein goes through a folding intermediate state with well-folded helix II∕III segment followed by docking of helix I. We also identified the primary folding free energy barrier which was the formation of the intermediate state. In this study, we are motivated to understand the underlying mechanism of the observed mutational effects of LYS24 and LYS29 on NLE. We apply the same strategy of using both CMD and REMD to obtain both the time-dependent kinetic information and temperature-dependent thermodynamic information. The ab initio folding of both wild type HP35 and the mutant allowed a close examination of the mutational effect.
RESULTS
In this section, we will first describe folding of the HP35 mutant to the native state. Following that, we will compare the folding of the HP35 mutant with that of the wild type. In the last part, we will discuss the underlying physical effects of the mutations.
Ab initio folding of the HP35 mutant
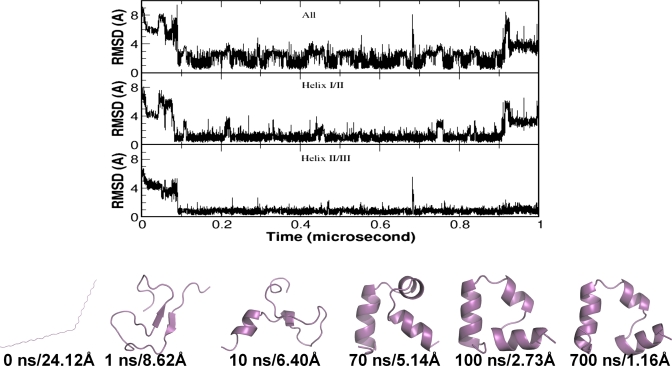
We conducted ten simulations (1 μs each, all started from the extended chain) with CMD on the HP35 double mutant. In the simulations, the HP35 mutant sampled conformations with Cα-RMSD <3.0 Å in all ten trajectories and Cα-RMSD <2.0 Å in eight trajectories. When Cα-RMSD <2.0 Å was used as cutoff, the folding time varied from 91 to 792 ns. Five of the trajectories reached the folded state within 500 ns (91, 146, 279, 281, and 465 ns, respectively), and three of the trajectories reached the folded state after 500 ns (530, 569, and 792 ns). Furthermore, folding of Cα-RMSD <1.0 Å was observed in four trajectories and one of them is shown in Fig. 2. In this trajectory, HP35 mutant reached the folded state at around 91 ns and stayed in the folded state for about 800 ns. As shown in the figure, the Cα-RMSD fluctuated between 0.4 and 3.0 Å and spent most of the time within 2.0 Å. The observed fluctuation of Cα-RMSD was primarily due to the movement of helix I, as discussed below.
Figure 2.
A representative folding trajectory from the CMD simulations of the HP35 mutant. Shown in the three panels are the Cα-RMSD of the whole protein (top, residues 2–34), the helix I∕II segment (middle, residues 3–21) and the helix II∕III segment (bottom, residues 15–33). Selected snapshots are presented to demonstrate the complete folding process from the extended chain to the fully folded structure.
To demonstrate the key events leading to folding to the native state, selected snapshots are shown in Fig. 2. Starting from an extended chain (0 ns), the HP35 mutant quickly collapsed into a coiled structure with a small local β-hairpin structure (1 ns). After 10 ns, helical turns started to form in the helix III region. The formation of the secondary structures was completed at 70 ns, which was followed by the repacking of the structural elements. This eventually evolved to the folded state with a slight variation in the orientation of helix I (two structures with Cα-RMSD of 2.73 and 1.16 Å, respectively, are shown).
In addition to the ten CMD simulations, we also conducted a set of REMD simulations, all starting from the extended chain, using 16 replicas and 240 ns for each replica. Folding was also observed in the REMD simulations where conformations with Cα-RMSD<1.0 Å were sampled in eight lower temperature replicas (T<353 K) and conformations with Cα-RMSD<0.5 Å were sampled in five replicas with T<310 K. For better understanding of the conformational sampling, we conducted clustering analysis on the conformations sampled at 296 K and the results are shown in Fig. 3. The top two clusters had very similar population (18.8% and 18.7%) and one of them was a well-folded conformation (1.62 Å Cα-RMSD for the cluster center). In addition, the third cluster (5.8%) was also a folded cluster (3.05 Å Cα-RMSD for the cluster center). Therefore, a combined population of more than 24.5% of folded conformation was sampled in the REMD simulation. In fact, all of the top ten clusters had well-folded helix II∕III segment (the intermediate state), indicating the low population of the denatured state. Ideally, the population of the folded conformations should be greater than 50% at 296 K, which is lower than the melting temperature (Tm=360 K from the experiment). However, this property was not faithfully reproduced in this work, indicating room for further improvement in the simulations, including force field and solvation model.
Figure 3.
The top 5 clusters (ranked by population) from the REMD simulations of the HP35 mutant (replica T=296 K). Two of them (cluster Nos. 2 and 3) belong to the folded state and the other three belong to the intermediate state.
Nevertheless, the ability to consistently reach the native state (as defined by Cα-RMSD<2.0 Å or even lower) was an encouraging progress. Further improvement will allow faithful replication of the kinetic and thermodynamic properties. Judging from the fact that most of the so-called “successful” folding simulations done by others failed to reach the native state, our present work is clearly a step forward in which not only the native state was consistently reached but also good agreement was observed between simulation and experiment in terms of certain kinetic and thermodynamic properties.
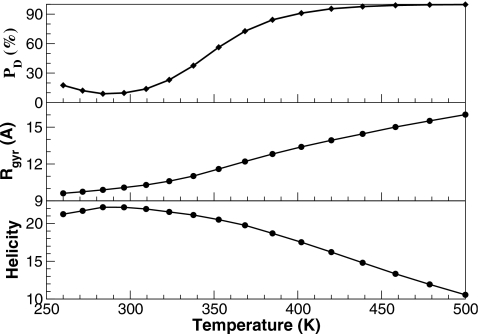
As temperature increased, the population shifted toward the denatured state gradually. This thermal denaturation of HP35 mutant is shown in Fig. 4. Consistent with the thermal denaturation experiments, there was a sharp increase in the population of the denatured state within the 273–373 K temperature range. In comparison, the increase in the radius of gyration and the decrease in helicity was much slower.
Figure 4.
Temperature dependent folding properties from the REMD simulations of the HP35 mutant. Thermal denaturation is demonstrated by the monotonic increase in the population of the denatured conformations (top), increase in the radius of gyration (middle), and decrease in helicity (bottom).
Comparison between the mutant and wild type
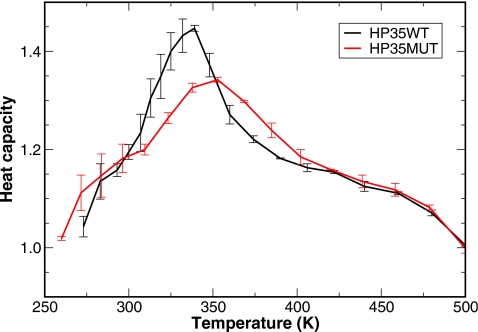
In the experimental studies, the mutant has an enhanced thermal stability with the melting temperature of Tm=360 K which is higher than the Tm=342 K of the wild type, an increase by ΔTm=18 K. Consistent with the experiments, we observed similar behavior in our simulations. From the heat capacity profiles shown in Fig. 5, the mutant had a Tm=353 K and the wild type had a Tm=339 K (the peaks of the heat capacity profiles are identified as Tm), an increase by ΔTm=14 K, in qualitative agreement with experiments.
Figure 5.
Heat capacity profiles of the HP35 wild type (black line) and mutant (red line) constructed from the REMD simulations. The simulation was divided into two blocks of equal length and heat capacity was calculated on the two blocks separately. The lines correspond to the average value and the error bars correspond to the standard error. The peak of each profile corresponds to the melting temperature Tm. The enhanced thermal stability in the mutant with respect to the wild type is clearly demonstrated by the increased Tm.
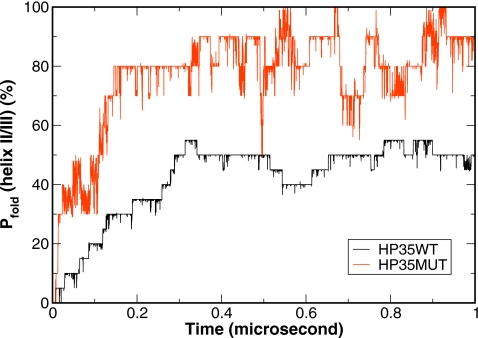
In addition to the enhanced thermal stability, the mutation also enhanced the folding kinetics. With a folding time of 0.6 μs, the mutant can fold notably faster than the wild type (4.3 μs). Our previous simulations showed that the primary folding transition barrier of the wild type is the formation of helix II∕III segment which leads to the folding intermediate. Our present simulations demonstrate that folding of helix II∕III segment of the mutant was significantly faster than that of the wild type (Fig. 6). With a cutoff of Cα-RMSD<2.5 Å, the helix II∕III of the HP35 mutant reached 80% folded near 150 ns, while that of the wild type only reached 50% folded near 300 ns. Thus, the mutant can cross the folding transition state and reach the folding intermediate state notably faster than the wild type.
Figure 6.
Comparison of the helix II∕III segment folding for the HP35 wild type (black line) and mutant (red line) from the CMD simulations. The percentage of the folded segment (defined by Cα-RMSD<2.5 Å) was averaged over ten steps. The accelerated transition to the intermediate state in the mutant is clearly shown by the faster formation of the helix II∕III segment.
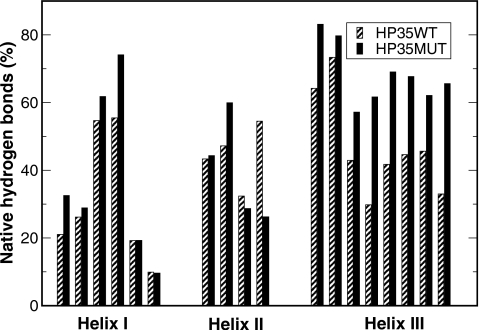
A key difference is noted in the formation of helix III which facilitates formation of helix II∕III segment. Formation of native hydrogen bonds is shown in Fig. 7. It is clear that a key effect of the mutations is the improved formation of helix III while the effect on the other two helices is marginal. This is not surprising because both mutated residues are within helix III. However, the effect went beyond helix III and notably stabilized helix II∕III segment.
Figure 7.
Native hydrogen bond occupancy from the CMD simulations of the HP35 wild type (gray bar) and mutant (dark bar). Since the first half of the wild type HP35 simulation was excluded due to its slower equilibration process, for consistent comparison, the first half of the simulations (0–0.5 μs) of the mutant was also excluded from the calculation. The accelerated formation of helix III in the mutant is clearly shown by the uniform increase in native hydrogen bond occupancy. Changes in the occupancy of some individual hydrogen bonds were also observed in helices I and II.
Reduced primary folding free energy barrier due to the mutations
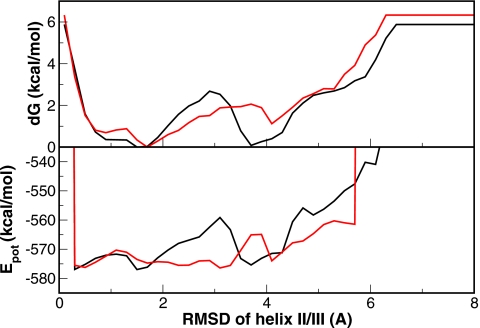
Protein folding rates are mostly determined by the primary folding free energy barriers. We calculated the free energy profiles for the folding of helix II∕III segment which was identified as the primary barrier in the wild type folding (Fig. 8). It is rather clear that the free energy barrier (upper panel in Fig. 8) of forming helix II∕III segment is much lower for the mutant (∼1.0 kcal∕mol) than the wild type (∼2.8 kcal∕mol). To identify the source of this change in free energy barrier, we calculated the potential energy profile for the folding of helix II∕III segment. As shown in the lower panel of Fig. 8, the potential energy barrier was ∼17 kcal∕mol for the wild type and ∼9 kcal∕mol for the mutant. Therefore, potential energy wise it is much more favorable for the mutant to cross the barrier to form the intermediate state.
Figure 8.
The comparison of energy profiles of the HP35 wild type (black lines) and mutant (red lines) from REMD (replica T=296 K). The folding of the helix II∕III segment was used as reaction coordinate to monitor the formation of the intermediate state. Significantly lowered energy barriers (both potential energy and free energy) from the denatured state to the intermediate state in the mutant are clearly shown. For the better comparison of the energy barrier, the potential energy curve of the wild type is shifted upward by 63 kcal∕mol.
Since two charged groups were removed by mutation, there are at least two possible scenarios for the decrease in the potential energy barrier: the mutant may either have less charge repulsion at the transition state or may have less favorable electrostatic interactions in the DSE in comparison to the wild type. Interestingly, the relative energy differences between the denatured state and intermediate state were similar for both the wild type and the mutant. However, the energy of the transition state decreased significantly in the mutant. What is more interesting is that the change also takes place in the positions of the denatured and transition states and both shifted toward higher RMSD for the mutant. This further underscores the notion that folding kinetics can be greatly influenced by a few mutational perturbations when these mutations are targeted at the key sites responsible for the stabilization of the TSE as have been revealed by the Φ-value analysis experiments.
DISCUSSION
In a recent simulation work on the same HP35 mutant, Ensign et al.30 investigated the folding rate of the mutant using the same force field (AMBER FF03) but with explicit solvent. Starting from various unfolded structures generated by unfolding simulation at 373 K, the authors observed heterogeneous folding behavior with various folding rates. The ones with nativelike structures in the helix I and three core phenylalanine residues displayed the closest folding rate to the experimentally determined folding rate. Based on this observation, the authors suggested that those nativelike structures may be close to the unfolded structures in the experiment. Here in our work, we started all simulations from the fully unfolded structures (the straight chain) that enabled us to observe the complete folding process without the potential bias due to selection of starting coordinates. Furthermore, since we obtained the ab initio folding of both the wild type and the mutant using the identical simulation parameter set, we were able to compare the difference and investigate the mutational effect. Evidently, the explicit representation of solvent water is ideally suitable to explore the influence of solvent at the molecular level. Therefore, the study of Pande et al. and our current work are complimentary to each other with different emphases.
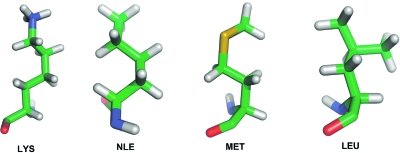
The mutation of LYS to NLE neutralizes the charged side chain by replacing the group with an H (Fig. 9). The neutralized side chains are subject to a reduced penalty when they are buried in the mutant.18 In addition, the mutation may also change the local secondary structure preference as illustrated by the helical propensity. Since NLE is a nonstandard amino acid, we will infer its helical propensity from similar nonpolar amino acids. Chemical composition wise, NLE is similar to LEU. Structure wise, NLE is similar to MET. We can consider NLE as a linear version of LEU or an S→CH2 mutant of MET. Both LEU and MET have higher helical propensity than LYS.33 Therefore we expect the helical propensity of NLE higher than that of LYS. Indeed, REMD simulations on the Ace-Gly-Lys-Gly-Nme and Ace-Gly-Nle-Gly-Nme showed that NLE peptide has a slightly higher helicity than the LYS peptide by ∼3%. This should partially account for the better formation of helix III in the mutant. When the neighboring effects are considered, slightly higher helicity in helix III was predicted by AGADIR (Ref. 34) when LYS is replaced by either LEU or MET (data not shown). This better formed helix III can facilitate the folding of the intermediate state and significantly enhance the folding rate of HP35.
Figure 9.
Structures of amino acids relevant to the LYS→NLE mutation, including LYS, NLE, MET, and LEU. This is to examine the source of the mutational effects.
Protein folding rate is largely determined by the primary free energy barriers. The change in the denatured state and transition state can both affect the folding rate in a significant manner. These effects are difficult to predict from the native structure alone. Rather, a detailed knowledge in the folding pathway is necessary to achieve reliable prediction of the mutational effect. From the free energy profile of the formation of the intermediate state (Fig. 8), it is quite clear that both TSE and DSE shifted to larger RMSD upon mutation. Further analyses of the TSE show that the mutation caused substantial changes, although it is difficult to attribute the free energy change to specific residue-residue interactions. In fact, the charge to neutral mutations in the two lysine residues caused substantial structural rearrangement in both the DSE and TSE.
Downhill folding has been a subject of great interest in the field. In the downhill folding process, the protein shifts between the denatured and folded states without notable thermodynamic barriers.35, 36, 37 For small barriers (barrier<3RT), the folding can be an incipient downhill process, as shown by lambda repressor and WW domain.32 In the cases of downhill or incipient downhill folding, the process exhibits the characteristics of nonexponential and noncooperative behavior. In our study, we observed a significantly reduced folding free energy barrier. After the double mutation, the folding free energy barrier was reduced to ∼1.0 kcal∕mole, notably smaller than the wild type and comparable to RT at room temperature (RT=∼0.6 kcal∕mole). Thus, the double mutant may be an example of incipient downhill folding. Interestingly, we observed a cooperative folding process as shown by the heat capacity (Fig. 5), folding free energy profiles (Fig. 8), and other measures (Fig. 4). These observations are consistent with experimental results.18 Thus, the double mutant, although can fold extremely rapidly with a time constant of 0.6 μs, appears to differ from the “downhill” folder which supposes to fold nonexponentially and noncooperatively as envisaged by the funnel theory.
In contrast to the prevailing side-chain∕backbone paradigm, Rose et al. proposed that protein folding starts from the building of a set of conformations driven by backbone hydrogen bonding which forms local helices and β-sheets.38 In a recent work by St-Pierre et al.,39 the complex folding scenario was attributed to the formation of a set of conformers before reaching the intermediate state. In the current work, although transient formation of β-sheets was observed in several trajectories such as displayed in Fig. 2, the formation of helical conformations was apparent even before reaching the intermediate state (data not shown). The frustration mostly came from two sources: the mispacking of folded helical segments before the formation of the intermediate state and the slow conformational search in helix I after the formation of the intermediate state.
METHODS
The simulations were conducted with the AMBER simulation package.40 The all-atom point-charge force field FF03 was chosen to represent the protein.41 The combined GB (Ref. 42) and surface area model was chosen to mimic solvation effect (surface tension=0.005 kcal∕mol Å2). The partial charges for the nonstandard amino acid norleucine were derived using an approach similar to that in FF03. The geometries of the two representative conformations (alpha and beta) were optimized at HF∕6-31G* and the electrostatic potentials for charge fitting were then calculated at B3LYP∕cc-pVTZ∥HF∕6-31G* in a medium (ether) mimicking the protein interior environment. The polarizable continuum model was used to consider the solvent effects.
Starting from the extended polypeptide chain of the HP35 mutant, short minimization (1000 steps) and equilibration (20 ps with random seed) were applied to the system. The equilibrated structures were the starting point for the simulation trajectories. There were 16 replicas in the REMD simulations43 and the target temperatures were 260.0, 271.6, 283.7, 296.3, 309.5, 323.3, 337.7, 352.8, 368.5, 384.9, 402.1, 420.0, 438.7, 458.3, 478.7, and 500.0 K. Temperature exchanges were attempted every 2000 steps. Temperature was set to 300 K in CMD simulations and was controlled by applying Berendsen’s thermostat44 with a coupling time constant of 2.0 ps. The choice of thermostat has been tested in a separate study on the B domain of protein A,45 which demonstrated similar ensemble properties and even folding behavior for Berendsen’s thermostat and Andersen’s thermostat. Ionic strength was set to 0.2 M. The cutoffs for both general nonbonded interaction and GB pairwise summation were set to 12 Å. The time step was 2 fs in CMD and 1 fs in REMD. SHAKE was applied for hydrogen-connected bond constraint.46 Slow-varying terms were evaluated every four steps. The coordinates were saved every 10 ps in CMD and 2 ps in REMD. The simulations were run on an advanced micro devices (AMD) cluster (4 CPU on each node), and it took ∼40 days to complete each 1 μs CMD simulation and ∼30 days to complete the 240 ns REMD simulation.
Clustering was conducted on the REMD trajectories at each temperature. The snapshots were clustered using a hierarchical clustering method. Two snapshots are considered as neighbors when their pairwise Cα-RMSD is below 2.5 Å. One residue from both termini was excluded in the clustering and other RMSD calculations due to the high flexibility. The snapshot with the most neighbors was identified as the center of the cluster. The process was iterated to identify other clusters from the remaining snapshots. Heat capacity was calculated using C=(⟨E2⟩−⟨E⟩2)∕RT2, where E is the potential energy, R is the gas constant, and T is the temperature. A standard criterion for hydrogen bond was used in the analyses where the cutoff for donor-acceptor distance was set to 3.5 Å and the donor-hydrogen-acceptor angle cutoff was set to 120°. Helicity was evaluated using a simple main chain dihedral cutoff: Φ=−57±40° and Ψ=−47±40°. We used smaller cutoff of ±30° in the previous studies.47 The larger cutoff used here is more tolerable to the dynamic nature of the structures. The choice of either value did not have significant effect on the estimation of helicity (data not shown).
CONCLUSIONS
To investigate the effect of the LYS24∕29NLE mutation on the folding of HP35, we conducted extensive ab initio folding simulations, including a set of ten CMD simulations (1 μs each) and a set of REMD simulations with 16 replicas for 240 ns. Consistent with the simulations on the wild type HP35, folding was obtained for the mutant in both CMD and REMD simulations where Cα RMSD of 0.5 Å was reached, and the population of the folded conformation was relatively high (>24.5%). Consistent with the experimental studies on the mutant and wild type, the mutant demonstrated higher thermal stability and faster folding compared with the wild type. The higher intrinsic helicity of NLE compared to LYS likely contributed to the faster formation of helix III. More importantly, the primary free energy barrier was significantly lower in the mutant which leads to the faster folding of the intermediate state with folded helix II∕III segment. Furthermore, unexpected changes in both the DSE and TSE were observed. In short, the simple LYS24∕29NLE mutation has profound effect on the folding of HP35.
ACKNOWLEDGMENTS
This work was supported by research grants from NIH (Grant Nos. GM64458 and GM67168 to Y.D.). Usage of PYMOL, GRACE, VMD, MATLAB, and RASMOL graphics packages are gratefully acknowledged.
References
- Calloni G., Zoffoli S., Stefani M., Dobson C. M., and Chiti F., J. Biol. Chem. 10.1074/jbc.M412951200 280, 10607 (2005). [DOI] [PubMed] [Google Scholar]
- Petrovich M., Jonsson A. L., Ferguson N., Daggett V., and Fersht A. R., J. Mol. Biol. 10.1016/j.jmb.2006.05.050 360, 865 (2006). [DOI] [PubMed] [Google Scholar]
- Hendsch Z. S., Jonsson T., Sauer R. T., and Tidor B., Biochemistry 10.1021/bi9605191 35, 7621 (1996). [DOI] [PubMed] [Google Scholar]
- Veenstra D. L. and Kollman P. A., Protein Eng. 10.1093/protein/10.7.789 10, 789 (1997). [DOI] [PubMed] [Google Scholar]
- Zoete V. and Meuwly M., J. Comput. Chem. 10.1002/jcc.20512 27, 1843 (2006). [DOI] [PubMed] [Google Scholar]
- Santos J., Risso V. A., Sica M. P., and Ermacora M. R., Biophys. J. 10.1529/biophysj.106.103804 93, 1707 (2007). [DOI] [PMC free article] [PubMed] [Google Scholar]
- Fersht A. R. and Daggett V., Cell 10.1016/S0092-8674(02)00620-7 108, 573 (2002). [DOI] [PubMed] [Google Scholar]
- C. L.BrooksIII, Curr. Opin. Struct. Biol. 10.1016/S0959-440X(98)80043-2 8, 222 (1998). [DOI] [PubMed] [Google Scholar]
- Pan Y. and Daggett V., Biochemistry 10.1021/bi0022036 40, 2723 (2001). [DOI] [PubMed] [Google Scholar]
- Cregut D. and Serrano L., Protein Sci. 8, 271 (1999). [DOI] [PMC free article] [PubMed] [Google Scholar]
- Eleftheriou M., Germain R. S., Royyuru A. K., and Zhou R., J. Am. Chem. Soc. 10.1021/ja060972s 128, 13388 (2006). [DOI] [PubMed] [Google Scholar]
- McKnight C. J., Matsudaira P. T., and Kim P. S., Nat. Struct. Biol. 10.1038/nsb0397-180 4, 180 (1997). [DOI] [PubMed] [Google Scholar]
- Chiu T. K., Kubelka J., Herbst-Irmer R., Eaton W. A., Hofrichter J., and Davies D. R., Proc. Natl. Acad. Sci. U.S.A. 10.1073/pnas.0502495102 102, 7517 (2005). [DOI] [PMC free article] [PubMed] [Google Scholar]
- Frank B. S., Vardar D., Buckley D. A., and McKnight C. J., Protein Sci. 10.1110/ps.22202 11, 680 (2002). [DOI] [PMC free article] [PubMed] [Google Scholar]
- Tang Y., Rigotti D. J., Fairman R., and Raleigh D. P., Biochemistry 10.1021/bi035652p 43(11), 3264 (2004). [DOI] [PubMed] [Google Scholar]
- Havlin R. H. and Tycko R., Proc. Natl. Acad. Sci. U.S.A. 10.1073/pnas.0406130102 102, 3284 (2005). [DOI] [PMC free article] [PubMed] [Google Scholar]
- Kubelka J., Eaton W. A., and Hofrichter J., J. Mol. Biol. 10.1016/S0022-2836(03)00519-9 329, 625 (2003). [DOI] [PubMed] [Google Scholar]
- Kubelka J., Chiu T. K., Davies D. R., Eaton W. A., and Hofrichter J., J. Mol. Biol. 10.1016/j.jmb.2006.03.034 359, 546 (2006). [DOI] [PubMed] [Google Scholar]
- Duan Y. and Kollman P. A., Science 10.1126/science.282.5389.740 282, 740 (1998). [DOI] [PubMed] [Google Scholar]
- Zagrovic B., Snow C. D., Shirts M. R., and Pande V. S., J. Mol. Biol. 10.1016/S0022-2836(02)00997-X 323, 927 (2002). [DOI] [PubMed] [Google Scholar]
- Jayachandran G., Vishal V., Garcia A. E., and Pande V. S., J. Struct. Biol. 10.1016/j.jsb.2006.10.001 157, 491 (2007). [DOI] [PMC free article] [PubMed] [Google Scholar]
- Shen M. Y. and Freed K. F., Proteins 10.1002/prot.10230 49, 439 (2002). [DOI] [PubMed] [Google Scholar]
- Ripoll D. R., Vila J. A., and Scheraga H. A., J. Mol. Biol. 10.1016/j.jmb.2004.04.002 339, 915 (2004). [DOI] [PubMed] [Google Scholar]
- Jang S., Kim E., Shin S., and Pak Y., J. Am. Chem. Soc. 10.1021/ja034701i 125, 14841 (2003). [DOI] [PubMed] [Google Scholar]
- Herges T. and Wenzel W., Structure (London) 10.1016/j.str.2005.01.018 13, 661. [DOI] [PubMed] [Google Scholar]
- Carr J. M. and Wales D. J., J. Chem. Phys. 10.1063/1.2135783 123, 234901 (2005). [DOI] [PubMed] [Google Scholar]
- De Mori G. M., Colombo G., and Micheletti C., Proteins 10.1002/prot.20313 58, 459 (2005). [DOI] [PubMed] [Google Scholar]
- Derreumaux P., Phys. Rev. Lett. 10.1103/PhysRevLett.85.206 85, 206 (2000). [DOI] [PubMed] [Google Scholar]
- Faccioli P., Sega M., Pederiva F., and Orland H., Phys. Rev. Lett. 10.1103/PhysRevLett.97.108101 97, 108101 (2006). [DOI] [PubMed] [Google Scholar]
- Ensign D. L., Kasson P. M., and Pande V. S., J. Mol. Biol. 374, 806 (2007). [DOI] [PMC free article] [PubMed] [Google Scholar]
- Lei H. and Duan Y., J. Mol. Biol. 10.1016/j.jmb.2007.04.040 370, 196 (2007). [DOI] [PMC free article] [PubMed] [Google Scholar]
- Lei H., Wu C., Liu H., and Duan Y., Proc. Natl. Acad. Sci. U.S.A. 10.1073/pnas.0608432104 104, 4925 (2007). [DOI] [PMC free article] [PubMed] [Google Scholar]
- Munoz V. and Serrano L., Proteins 10.1002/prot.340200403 20, 301 (1994). [DOI] [PubMed] [Google Scholar]
- Munoz V. and Serrano L., Nat. Struct. Biol. 10.1038/nsb0694-399 1, 399 (1994). [DOI] [PubMed] [Google Scholar]
- Bryngelson J. D., Onuchic J. N., Socci N. D., and Wolynes P. G., Proteins 10.1002/prot.340210302 21, 167 (1995). [DOI] [PubMed] [Google Scholar]
- Cho S. S., Weinkam P., and Wolynes P. G., Proc. Natl. Acad. Sci. U.S.A. 10.1073/pnas.0709376104 105, 118 (2008). [DOI] [PMC free article] [PubMed] [Google Scholar]
- Sadqi M., Fushman D., and Munoz V., Nature (London) 10.1038/nature04859 442, 317 (2006). [DOI] [PubMed] [Google Scholar]
- Rose G. D., Fleming P. J., Banavar J. R., and Maritan A., Proc. Natl. Acad. Sci. U.S.A. 10.1073/pnas.0606843103 103, 16623 (2006). [DOI] [PMC free article] [PubMed] [Google Scholar]
- St-Pierre J. F., Mousseau N., and Derreumaux P., J. Chem. Phys. 10.1063/1.2812562 128, 045101 (2008). [DOI] [PubMed] [Google Scholar]
- Case D. A., Cheatham T. E., Darden T., Gohlke H., Luo R., Merz K. M., Onufriev A., Simmerling C., Wang B., and Woods R. J., J. Comput. Chem. 10.1002/jcc.20290 26, 1668 (2005). [DOI] [PMC free article] [PubMed] [Google Scholar]
- Duan Y., Wu C., Chowdhury S., Lee M. C., Xiong G. M., Zhang W., Yang R., Cieplak P., Luo R., Lee T., Caldwell J., Wang J. M., and Kollman P., J. Comput. Chem. 10.1002/jcc.10349 24, 1999 (2003). [DOI] [PubMed] [Google Scholar]
- Onufriev A., Bashford D., and Case D. A., Proteins 10.1002/prot.20033 55, 383 (2004). [DOI] [PubMed] [Google Scholar]
- Hansmann U. H. E. and Okamoto Y., Phys. Rev. E 10.1103/PhysRevE.56.2228 56, 2228 (1997). [DOI] [Google Scholar]
- Berendsen H. J. C., Postma J. P. M., Vangunsteren W. F., Dinola A., and Haak J. R., J. Chem. Phys. 10.1063/1.448118 81, 3684 (1984). [DOI] [Google Scholar]
- Lei H., Wu C., Wang Z. X., Zhou Y., and Duan Y., J. Chem. Phys. 10.1063/1.2937135 128, 235105 (2008). [DOI] [PMC free article] [PubMed] [Google Scholar]
- Ryckaert J. P., Ciccotti G., and Berendsen H. J. C., J. Comput. Phys. 10.1016/0021-9991(77)90098-5 23, 327 (1977). [DOI] [Google Scholar]
- Zhang W., Lei H. X., Chowdhury S., and Duan Y., J. Phys. Chem. B 10.1021/jp037688x 108, 7479 (2004). [DOI] [Google Scholar]


