Abstract
Permanently crosslinked polyelectrolyte gels are known to undergo discontinuous first-order volume phase transitions, the onset of which may be caused by a number of factors. In this study we examine the volumetric properties of such polyelectrolyte gels in relation to the progressive substitution of monovalent counterions by divalent counterions as the gels are equilibrated in solvents of different dielectric qualities. We compare the results of coarse-grained molecular dynamics simulations of polyelectrolyte gels with previous experimental measurements by others on polyacrylate gels. The simulations show that under equilibrium conditions there is an approximate cancellation between the electrostatic contribution and the counterion excluded-volume contribution to the osmotic pressure in the gel-solvent system; these two contributions to the osmotic pressure have, respectively, energetic and entropic origins. The finding of such a cancellation between the two contributions to the osmotic pressure of the gel-solvent system is consistent with experimental observations that the swelling behavior of polyelectrolyte gels can be described by equations of state for neutral gels. Based on these results, we show and explain that a modified form of the Flory–Huggins model for nonionic polymer solutions, which accounts for neither electrostatic effects nor counterion excluded-volume effects, fits both experimental and simulated data for polyelectrolyte gels. The Flory–Huggins interaction parameters obtained from regression to the simulation data are characteristic of ideal polymer solutions, whereas the experimentally obtained interaction parameters, particularly that associated with the third virial coefficient, exhibit a significant departure from ideality, leading us to conclude that further enhancements to the simulation model, such as the inclusion of excess salt, the allowance for size asymmetric electrolytes, or the use of a distance-dependent solvent dielectricity model, may be required. Molecular simulations also reveal that the condensation of divalent counterions onto the polyelectrolyte network backbone occurs preferentially over that of monovalent counterions.
INTRODUCTION
The precipitation of polyelectrolytes through exposure to multivalent counterions is a problem of profound significance in biology and manufacturing. This phenomenon has been suggested to be fundamental in relation to nerve propagation,1, 2 muscle contraction,3 packaging of DNA and RNA in tight bundles within the cell nucleus and within viruses,4 and numerous fundamental biological processes. From a processing and technology standpoint, this phenomenon is important in wastewater remediation, thickening agents in the food industry, and avoiding plugging of porous rocks in oil recover process,5 just to name a few instances.
Crosslinked polyelectrolyte gels in general have greater swelling capacities than neutral nonionic polymer gels at the same crosslink densities.6 They are also known to undergo discontinuous first-order volume phase transitions affected by changes in the solvent condition, the ionic environment, the applied mechanical stress, and even exposure to light.7, 8
The inherent ability of polyelectrolyte gels to undergo such discontinuous volume transitions has received particular interest in both theoretical and applied research, especially as the phenomenon relates to certain biophysical processes. Hill had suggested that polyelectrolyte gels may be considered as a model for muscle contraction and protein transitions.3 More recently, Tasaki and Byrne1 associated the phase transition in polyelectrolyte gels with nerve excitation, supported by systematic experimental work on the swelling behavior and mechanical properties of polyelectrolyte gels under physiological salinity conditions.9 Progress is also being made on the application of phase transitions in polyelectrolyte gels for the delivery of drugs and genes into living cells and in the actuation of microfluidic devices.10
The origin of most of the theoretical treatments of the swelling of polyelectrolyte gels can be traced back to models proposed by Flory6 and Katchalsky and Michaeli,11 whereas the theoretical foundation for discontinuous volume phase transitions in polymer gels was laid down by Dušek and Patterson.12 While the latter theory adequately describes the discontinuous phase transitions that may be observable in neutral polymer gels, the theory behind the phase transitions in polyelectrolyte gels, particularly with respect to the treatment of charge interactions, needs further development.
In observing that polyelectrolyte gels can swell to a much greater extent than nonionic gels, Flory attributed the extra swelling to the osmotic pressure arising from the difference in mobile ion concentration inside and outside the polyelectrolyte gel.6 The mobile ions include counterions that are entrapped within the polyelectrolyte gel by virtue of their electrostatic attraction to the fixed charges on the network backbone and additional ions that may diffuse into the gel from the surrounding salt solution. The polyelectrolyte network and mobile ions together must comprise an electrically neutral system. Because of the confinement of mobile ions within the polyelectrolyte gel, the entire system resembles the conditions of Donnan equilibria. Flory proposed the simple equation of state6
| (1) |
where πmix, πelas, and πion are defined as
| (2) |
| (3) |
| (4) |
In these equations v is the molar volume of the solvent, ν is the number of elastically effective chains in the network, V is the volume of the relaxed and unswollen network, Δc is the molar concentration of excess mobile ions above the ion concentration in the surrounding solvent, and R, T, ϕ, and χ=χ0+χ1ϕ have their usual meanings of the gas constant, the temperature, the polymer volume fraction, and the polymer-solvent interaction parameter. Note that we have allowed for a linear dependence of the polymer-solvent interaction parameter χ on the polymer volume fraction ϕ.
Polymer-solvent interactions are more complex in polyelectrolyte solutions than in neutral polymer solutions. Flory addressed the problem of calculating χ for polyelectrolytes under restrictive conditions—high molecular mass polymers and solutions of reasonably high ionic strength.13 These restrictions require that the Debye–Hückel screening length 1∕κ be much smaller than the radius of gyration of the polymer chain14 and that long-range electrostatic interactions be negligible; these assumptions can only be justified under conditions of high salt concentration when the charge interactions are largely screened. The basic prediction of Flory’s theory is that χ contains two additive terms,
| (5) |
| (6) |
| (7) |
The first term χn is the usual van der Waals short-range interaction that is also encountered in a neutral polymer where ε is the characteristic enthalpy of mixing of the polymer with solvent; the second term χs describes the influence of the charge interactions where ωs is a coupling constant that depends on the degree of ionization of the polymer chain, and I is the ionic strength. Muthukumar15 has recently discussed the coupling constant ωs, based on a continuum Debye–Hückel type model of the polymer-polymer interaction. In a classic experimental study, Flory and Osterheld14 verified the ionic strength-dependence of the effective polymer-solvent thermodynamic interaction χ in Eq. 5 in the context of intrinsic viscosity measurements for poly-(acrylic acid) solution, with a moderate amount of dissolved salts (NaCl, Na2SO4, CaSO4, and CaCl2). An important prediction of the Flory theory of polyelectrolytes is that the replacement of monovalent ions such as Na+ by divalent ions such as Ca2+ leads to a reduced solvent quality simply because of the relative enhancement of the ionic strength.16 Flory and Osterheld17 specifically note that “it seems unnecessary to postulate formation of complex or cross-linkages” to account for the “salting out” tendencies of multivalent ions on polyelectrolyte solutions. This basic conclusion is supported by mechanical measurements by Horkay et al.18 where no evidence of crosslinking effects in polyelectrolyte gels was found for a wide range of multivalent salts.
In Eq. 2 we showed the polymer-solvent interaction parameter χ to be linearly dependent on the polymer volume fraction ϕ, as χ=χ0+χ1ϕ. The significance of a general dependence of the interaction parameter on the polymer concentration was studied by Moerkerke et al.19 in the context of discontinuous volume phase transitions in neutral polymer gels, and also by Šolc et al.20 with respect to the existence of off-zero critical points, at which the polymer concentration is finite, in monodisperse and polydisperse polymer solutions. It was found that a linear dependence of χ on ϕ was required to effect the existence of an off-zero critical point in monodisperse polymer solutions.20 However, for polymer gels that undergo discontinuous volume phase transitions, the three-phase equilibrium among the pure solvent, the swollen gel, and the collapsed gel requires a stronger quadratic dependence of χ=χ0+χ1ϕ+χ2ϕ2 to describe such systems.19 Experimentally Horkay and co-workers9, 27 found that a χ that was independent of the polymer concentration could not adequately describe the osmotic pressure data of polyacrylate gels, but that a χ that was linearly dependent on ϕ provided a satisfactory model for these gels.
The present study is stimulated by a series of measurements9, 21, 22 that investigates the salting out effect of adding a multivalent salt (CaCl2) to swollen polyelectrolyte gels (polyacrylate) in a monovalent salt (NaCl). These studies show that the introduction of a multivalent salt leads to changes in the osmotic properties that are anomalous in comparison to neutral gels (we summarize some of the main results of these measurements below), suggesting that the addition of multivalent salts might have an effect distinct from that of simply reducing the solvent quality, in the sense of this term as it pertains to neutral polymers.6
With this proposition in mind, we generalize our previous simulations of polyelectrolyte gels with exclusively monovalent or divalent counterions23 to describe gels that include a mixture of monovalent and divalent counterions. Our study is restricted to the salt-free case, where the counterions derive from those that dissociate from charged groups within the polymer chain. We also base our calculations on a generalized restricted primitive model of ionic solutions, or primitive polyelectrolyte model (PPM), where the water solvent is treated as a hydrodynamic continuum having a dielectric constant appropriate for water (ϵr≈80).
Our calculations indicate that our previous findings23 of an approximate cancellation between the electrostatic and excluded-volume contributions to the pressure for a pure species of counterions extend to mixtures of monovalent and divalent counterions. This result is of qualitative importance because it provides a numerical justification for treating π for polyelectrolyte gels using the same theoretical expressions as those derived for neutral gels, as implicit in Eqs. 1, 2, 3, 4. Our new calculations also indicate that divalent counterions have a higher affinity for the chain backbone and displace the monovalent counterion cloud when added to a mixture, such that the overall charge neutrality of our gel is preserved in the process. The spatial extent of the counterion cloud is found to be more contracted for divalent counterions than for monovalent counterions, a finding that is in broad accord with recent x-ray scattering measurements18 on hyaluronic acid with monovalent and divalent ions (Rb+ and Ca2+) and with previous simulations and density functional calculations.24
Although the simulations do seem to capture some of the qualitative trends of real polyelectrolyte solutions, we encounter what appears to be a fundamental quantitative difference with direct fits of experimental data. Specifically, our simulations indicate that network collapse does not occur unless the relative dielectric constant ϵr of the solvent is much lower than the room-temperature dielectric constant of water (ϵr≈80). In contrast to this result, previous experimental work on highly charged polyelectrolyte solutions in the salt-free limit2 has shown a clear tendency for higher valence ions to induce what appears to be phase separation. These observations, and our own simulations, suggest that the PPM of aqueous polyelectrolytes strongly underestimates the charge interactions of polyelectrolyte solutions if ϵr is literally identified with its bulk solution value for water (ϵr≈80), as in our simulations.
EXPERIMENTAL SWELLING OF POLYELECTROLYTE GELS
Experimental measurements of the equilibrium swelling, osmotic pressure, and shear modulus have been made by Horkay et al.9, 21, 22 on chemically crosslinked sodium polyacrylate gels in equilibrium with salt solutions containing NaCl and CaCl2. Horkay et al. used Eq. 1 to analyze the osmotic pressure data of these polyacrylate gels. The total osmotic pressure π was obtained by deswelling measurements of the gels in aqueous solutions of poly(vinylpyrrolidone) of known osmotic pressures.9, 22, 25, 26 The elastic contribution to the swelling pressure πelas was taken to be the negative of the shear modulus and measured in terms of the deformation response to an applied force under conditions of uniaxial compression.9, 22 The Donnan term πion was calculated using Eq. 4.6, 9, 21, 22 The mixing pressure was then obtained as πmix=π−πelas−πion. Estimated values of the interaction parameters χ0 and χ1 were obtained by fitting Eq. 2 to the values of πmix.
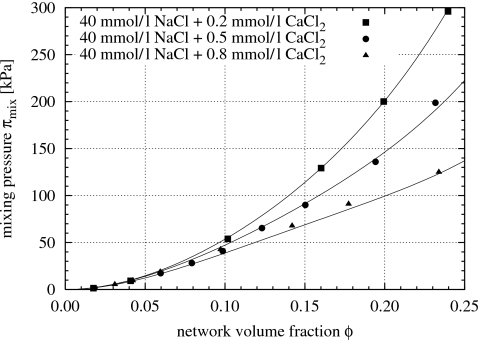
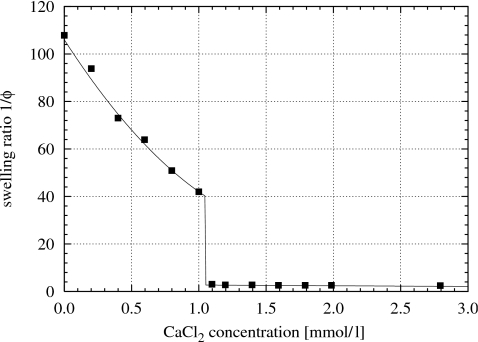
Figure 1, based on data from Horkay and co-workers,9, 27 shows the mixing pressure πmix of polyacrylate gels, as functions of the polymer gel volume fraction, swollen in salt solutions containing 40 mmol∕l NaCl plus 0.2, 0.5, and 0.8 mmol∕l CaCl2. The curves in Fig. 1 are fitted to the experimental data points using Eq. 2 (the values of χ0 and χ1 are shown in Fig. 8). As the concentration of Ca2+ is increased, the mixing pressure is gradually reduced. Figure 1 shows data for Ca2+ concentrations up to 0.8 mmol∕l. Above a Ca2+ concentration of approximately 1 mmol∕l, at which the polyacrylate gel collapses as shown in Fig. 2, the swelling pressure of the gel vanishes.
Figure 1.
Mixing pressure πmix=π−πelas−πion of polyacrylate gels vs gel volume fraction ϕ in salt solutions containing 40 mmol∕l NaCl plus various amounts of CaCl2 at room temperature; data from Horkay and co-workers (Refs. 9, 27). The curves show Eq. 2 fitted to the data; χ0 and χ1 are shown in Fig. 8.
Figure 8.
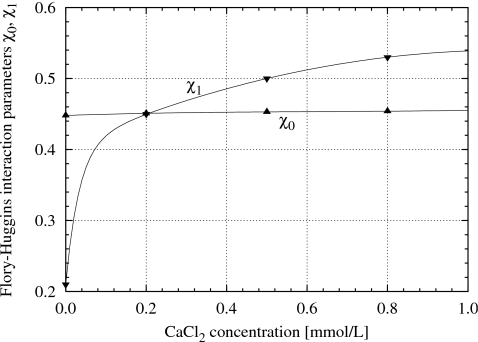
Flory–Huggins parameters χ0 and χ1 for sodium polyacrylate gels in the presence of 40 mmol∕l NaCl plus various concentrations of CaCl2; data from Horkay and co-workers (Refs. 9, 27).
Figure 2.
Equilibrium swelling degree of polyacrylate gels in salt solutions containing 40 mmol∕l NaCl plus various concentrations of CaCl2 at room temperature; data from Horkay and co-workers (Refs. 9, 27).
MOLECULAR DYNAMICS SIMULATIONS
We performed a series of molecular dynamics simulations employing a coarse-grained model of a polyelectrolyte network to study the volumetric properties and phase behavior of polyelectrolyte gels under swollen and collapsed conditions. The network has a defect-free tetrafunctionally crosslinked diamond network topology.23, 28, 29, 30, 31, 32, 33, 34 We simulate only a unit cell containing 16 crosslinked chains. The individual constituent chains are of the freely jointed bead-spring type having 100 monomeric units and the chains are linked at their ends. Periodic boundary conditions are imposed to simulate an infinitely large network. Insofar as each coarse-grained bead carries a monovalent anionic charge, the model represents a highly charged polyelectrolyte network, such as a polyacrylate network backbone. Monovalent and divalent counterions, which may be considered to represent Na+ and Ca2+ ions, appear explicitly in the system, but are only present to the extent that anionic charges on the network backbone are neutralized such that the net electrostatic charge of the system is zero. For computational efficiency the solvent is not modeled explicitly as a molecular fluid, it is instead treated as an implicit dielectric medium; the effect of excess salt in the solvent is incorporated through the adjustment of the Bjerrum length of the implicit solvent, to be described below.
There are three contributions to the potential energy of the coarse-grained polyelectrolyte network–solvent system. The short-range dispersion interaction between any pair of particles both of diameter σ separated at a distance r is modeled by the Weeks–Chandler–Andersen (WCA) potential35, 36, 37
| (8) |
The purely repulsive nature of this interaction implies that the particles (the monomers and the counterions) are immersed in a good solvent.38, 39 The constituent polyelectrolyte chains of the network backbone are modeled as freely jointed finitely extensible nonlinear elastic (FENE) bead-spring chains. The energy of a FENE bond of length r is given by40, 41
| (9) |
In our simulations, the FENE spring constant is kFENE=10kBT∕σ2, and the maximum bond length of rmax=1.5σ ensures that the constituent chains of the network cannot cross through each other. The electrostatic energy of two particles carrying electrical charges qi and qj is
| (10) |
where λ=e2∕4πϵ0ϵrkBT is the Bjerrum length, e is the elementary charge, and ϵr is the dielectric constant of the solvent relative to that of vacuum ϵ0. The Bjerrum length is the distance at which two unit charges have interaction energy of magnitude kBT. The ratio of λ to σ provides a measure of the charge energy of interactions relative to thermal energy and we denote this ratio as Γ=λ∕σ. Calculation of the electrostatic contributions was done using the smooth particle mesh Ewald (SPME) algorithm,42 and the SPME parameters are chosen to ensure that the relative error between the electrostatic potential and three times the electrostatic virial of the system is of the order O(10−4) or smaller.
Molecular dynamics integration was performed in the canonical NVT ensemble using the Nosé–Hoover chains algorithm.43 The size of the time steps used was generally τ∕128, where is the Lennard-Jones time unit. Each of the simulations lasted at least 8.3×10⁶ time steps which, for σ=7 Å, m=71 g∕mol, and T=300 K appropriate for a polyacrylate system, is taken as approximately 240 ns. The extended Hamiltonian of the Nosé–Hoover chains NVT ensemble (which should be constant) typically had a relative standard deviation of the order O(10−4). The relative standard error in the osmotic pressure is also of the order O(10−4) after 8.3×10⁶ time steps. Overall the molecular simulation model and the integration scheme are essentially the same as those used in our previous study,23 but with the difference that the system may contain a mixture of monovalent and divalent counterions. The extent of monovalent-divalent counterion exchange is denoted by the parameter α, describing the relative counterion concentration,
| (11) |
where c1 and c2 are the molar concentrations of monovalent counterions and divalent counterions, respectively; thus α=0 denotes a polyelectrolyte network with all monovalent counterions and α=1 denotes a network with all divalent counterions.
Discontinuous volume phase transitions
Figure 2, based on data from Horkay and co-workers,9, 27 shows the dependency of the equilibrium swelling degree of polyacrylate gels swollen at room temperature in salt solutions that contained a fixed concentration of 40 mmol∕l NaCl plus various concentrations of CaCl2 up to 3 mmol∕l. The volumes of the gels decrease with increasing Ca2+ ion concentration in the salt solution. When certain Ca2+ ion concentrations are reached (approximately 1.0 to 1.1 mmol∕l CaCl2), the gel undergoes a discontinuous collapse transition.
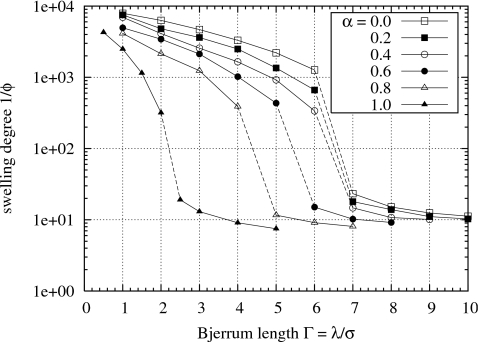
In Fig. 3 similar equilibrium swelling curves obtained from coarse-grained molecular dynamics simulations of polyelectrolyte gels with explicit counterions are shown as functions of the charge interaction strength Γ. The makeup of the counterions range from purely monovalent (α=0) to purely divalent (α=1). In these simulations the implicit solvent can be considered to represent a salt solution whose salt concentration is expressed indirectly in terms of the Bjerrum length. As we noted at the beginning of Sec. 3, the counterions that are explicitly present in the simulations are required for charge electroneutrality, and thus there is no explicitly added salt. A small Bjerrum length corresponds to a large dielectric constant, which in qualitative terms may represent a solvent containing a low concentration of salt. A large Bjerrum length corresponds to a solvent with a small dielectric constant and could be regarded as a solvent having a high salt concentration. The variation in the Bjerrum length of the implicit solvent need not represent only changes in salt concentration in the solvent. If the simulation model is to correspond to systems where indeed no excess salt is present, then the Bjerrum length may be associated with the type or chemical composition (excluding any salt) of the solvent, e.g., the amount of acetone added to water as in Tanaka’s original experiments.7 There are some solvents, such as N-methylformamide, that allow the variation in ϵr over a large range with temperature, so that Γ can be tuned.44, 45
Figure 3.
Equilibrium swelling curves for simulated polyelectrolyte gels with various mixtures of explicit monovalent or divalent counterions.
Discontinuous phase transitions, drawn as dashed lines, appear in the swelling curves shown in Fig. 3. Due to the finite-size nature of the simulations, it is not possible to resolve precisely these tie lines, which theoretically should pass vertically through the end points of the phase transitions. Nevertheless we can see that the volumes of the gels change by approximately one-and-a-half order of magnitude through the phase transitions, which is consistent with the experimentally measured change shown in Fig. 2.
For values of α in the range from 0.0 to 0.8, the simulated gel phase transition occurs between Γ=4 and Γ=7. Knowing that water at room temperature has a Bjerrum length of about λ=7 Å and that the relative permittivity of water is about ϵr≈80, and assuming that a typical polyelectrolyte such as polyacrylate has a coarse-grained monomer size of about σ≈7 Å,46 then our simulations imply that these phase transitions will occur only in solvents for which λ>28 Å, or equivalently ϵr<20. Such solvent conditions cannot be reached with aqueous NaCl solutions near the physiological concentration.47 Note that in the experiments in Fig. 2, excess CaCl2 was added to induce the phase transitions. As the gel shown in Fig. 2 undergo a phase transition, the Na+ ions in the gel would have been largely replaced by Ca2+ ions,9 so that α≈1. This substitution of divalent counterions for monovalent counterions allows the gels to undergo phase transition in solvents that have dielectric constants closer to that of water (ϵr≈80, Γ≈1).
The results of Fig. 3—that the simulated phase transitions in the gels occur only at higher values of Γ beyond the range achievable in physiological conditions—raise concerns about the appropriateness of an excess salt-free PPM to describe real polyelectrolyte solutions, a result with important ramifications. Previous work has also established that the primitive model of the ionic species interactions can give an inaccurate description of the charge interactions near the chain backbone where ϵr is locally much smaller (ϵr=2–4),48 an effect that significantly influences the resulting counterion distribution. Incorporating a spatially dependent ϵr will have the same basic effect as increasing Γ. This will trigger chain and network collapse, an effect observed previously by Winkler et al.49 in molecular dynamics simulations of isolated polyelectrolyte chains. This effect has also been observed in molecular dynamics simulations of solutions of polyelectrolyte chain50 where dynamic chain clustering at equilibrium as well as chain collapse is observed. The PPM with ϵr set to 80 does not capture this behavior.
We attempted to address this issue by employing a distance-dependent dielectric constant for the implicit solvent51 that allows Γ to vary effectively from a value of 1 at long range to a maximum value of 16 as two ions approach each other. While the resulting simulated osmotic pressure is in fact lowered by the use of such a distance-dependent dielectric constant, the depression of the osmotic pressure is not sufficiently large to alter the equilibrium swelling degree of the simulated gel in a significant way. With a constant (spatially invariant) Γ=1 for a gel with purely divalent counterions (α=1), the equilibrium swelling degree is 2650 (the second solid triangle on the lowest curve in Fig. 3); by using the distance-dependent dielectric constant, the equilibrium swelling degree is lowered only to approximately 2000. Further investigation is required to tune the parameters of the distance-dependent dielectric model for use with the PPM (the original parameters were tuned for NaCl in water), and the allowance for size asymmetry in the representation of monomers and counterions needs to be made.
Osmotic pressure of simulated polyelectrolyte gels
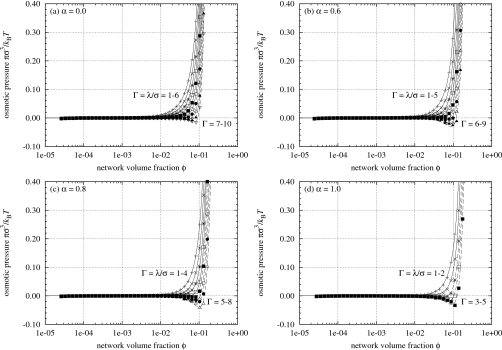
The osmotic pressure π of the simulated polyelectrolyte gels is shown in Fig. 4 for four selected values of α and different values of the Bjerrum length λ. The equations used to calculate π are discussed in Sec. 3C. Recall that Fig. 1 shows that the mixing pressure πmix for real gels is lowered with increasing Ca2+ ion concentration in the surrounding salt solution. Here Fig. 4 shows that the osmotic pressure π of the simulated gels is also depressed with increasing Bjerrum length. An increase in the Bjerrum length qualitatively corresponds to an increase in the excess salt concentration in the implicit solvent, so the experimental and simulation results are qualitatively consistent.
Figure 4.
Osmotic pressure of simulated polyelectrolyte gels. The curves are obtained by fitting Eq. 2 to the data via Eq. 20.
The results in Fig. 4 show that for a range of values of the dimensionless charge interaction Γ=λ∕σ the calculated osmotic pressure π fits well with Eq. 2. This means that π can reasonably be described by the theory of uncharged networks developed by Flory6 and Tanaka.7, 8 It turns out that the simulation results give an interaction parameter χ0 in Eq. 2 that is close to 1∕2, so that the chains are nearly ideal, i.e., the second virial coefficient A2∝[(1∕2)−χ0] is small. We elaborate on this point later in Sec. 3E and Fig. 8.
The solid isotherms (constant Bjerrum length isopleths) in Fig. 4 all have Bjerrum lengths shorter than the values where the phase transitions would occur in Fig. 3. These isotherms have positive slopes (∂π∕∂ϕ)T,λ>0 through all values of the volume fraction ϕ. Along these isotherms the gel is stable but not fully swollen if π>0, stable and fully swollen to equilibrium with the solvent where π=0 and ϕ⪡O(0.01), and unstable and oversaturated with solvent if π<0. In the last of these three cases, the gel expels pure solvent until the osmotic pressure rises to π=0 and equilibrium between the gel and solvent is established.6 The dashed isotherms in Fig. 4 have Bjerrum lengths longer than the transition values and all develop van der Waals loops where (∂π∕∂ϕ)T,λ<0; the gels are unstable in this region and will spontaneously collapse until an equilibrium state is reached where π=0 and ϕ∼O(0.1). As the Bjerrum length increases through the actual transitional value, the equilibrium point on the π=0 abscissa discontinuously shifts from the left to the right on the abscissa, indicating the occurrence of the discontinuous phase transition as pure solvent is expelled.
Cancellation of electrostatic and excluded-volume contributions to osmotic pressure
To gain insight into the underlying phenomenology of the discontinuous volume phase transition in polyelectrolyte gels, we analyzed the breakdown of the contributions to the osmotic pressure of the simulated gels. Based on the potential energy models Eqs. 8, 9, 10 that we employed in the simulations, we can identify three separate excess contributions to the osmotic pressure, namely, the counterion excluded-volume contribution
| (12) |
where im and ii denote counterion-monomer pairs and counterion-counterion pairs, the electrostatic contribution
| (13) |
and the network contribution
| (14) |
where mm denotes monomer-monomer pairs. The dagger superscript on the summation operators in Eqs. 12, 14 indicate that the extent of the summation goes only to . The osmotic pressure of the simulated polyelectrolyte gel is therefore calculated as
| (15) |
where ρ=(Nm+Ni)∕Vis the total number density of monomers plus counterions. Note that the first term ρkBT gives the osmotic pressure of an ideal solution containing a concentration of ρ noninteracting solute particles.
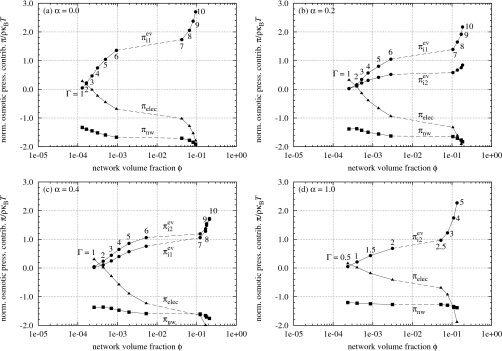
In Fig. 5, the breakdown of the simulated osmotic pressure into the three contributions is taken in the plane π=0 in π-ϕ-λ space. Each of the graphs in Fig. 5 corresponds point by point to the equilibrium swelling curve of the same α value shown in Fig. 3 as the Bjerrum length λ and polymer volume fraction ϕ vary. Under the constraint of π=0, Eq. 15, after being divided through by ρ, gives the relation
| (16) |
between the three osmotic pressure contributions.23 For cases where a mixture of monovalent counterions and divalent counterions are present in the system, i.e., 0<α<1, the counterion excluded-volume contribution to the osmotic pressure is separated into two parts, and , which are the contributions associated with the monovalent counterions and the divalent counterions, respectively. There would be a cross-term contribution for the excluded-volume interaction between monovalent and divalent counterions, but its magnitude is much smaller than and so we neglect its contribution to π in the following analysis.
Figure 5.
Excess contributions to the osmotic pressure of simulated gels: network πnw (◼), electrostatics πelec (▴), and monovalent counterion excluded-volume and divalent counterion excluded-volume (both ●).
Several prominent features of these contributions to the osmotic pressure, normalized as π∕ρkBT, stand out in Fig. 5. The symmetry between the sum of the counterion excluded-volume contributions and the electrostatic contribution is evident. As a result of this symmetry, we find that there is an approximate cancellation between and πelec; in other words the sum of these contributions is relatively constant compared with the variations in , , and πelec and its value is small, lying between 0 and ρkBT. We also find that in the ranges of Bjerrum lengths where the gels undergo phase transitions in Fig. 3, the curves in Fig. 5 are stretched out and correspond to the van der Waals loops. The network contribution to the osmotic pressure, compared with the other contributions, remains relatively invariant and close to −ρkBT throughout the entire range of volume fractions and Bjerrum lengths explored in the simulation studies.
Influence of counterion valance on the counterion cloud
Upon closer inspection of the counterion excluded-volume contributions to the osmotic pressure and , we also see evidence that divalent counterions interact in closer proximity with the oppositely charged polyelectrolyte network backbone than monovalent counterions do. For the case of α=0.2, the monovalent counterion excluded-volume contribution remains greater than the divalent counterion excluded-volume contribution as expected based on the fact that the concentration of monovalent counterions in the gel is greater than that of divalent counterions. For α=0.4, however, the divalent counterion excluded-volume contribution exceeds its monovalent counterpart even though the concentration of monovalent counterions is three times that of divalent counterions.
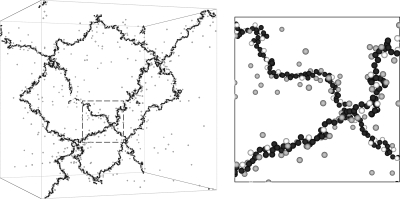
We anticipate that many of the dramatic effects that derive from multivalent counterions and ions of different sizes derive from changes in the counterion cloud as the type of counterion is varied. The ions on the chain backbone and the counterions can be expected to form multiple clusters with nontrivial dipole and multipole interactions, just as observed previously in the restricted primitive model.52, 53, 54, 55, 56 This type of phenomenon cannot be easily treated by continuum theories since the discrete particle nature of the ions comes into play in an important way. To gain insight into this phenomenon, we show a snapshot of our simulated gel for α=0.6, Γ=3, and ϕ=4.85×10⁻⁴, in Fig. 6.
Figure 6.
Snapshot of simulated polyelectrolyte gel (α=0.6, Γ=3, ϕ=4.85×10⁻⁴, and πσ3∕kBT=1.52×10⁻⁵). The polyelectrolyte network backbone is black, monovalent counterions are gray, and divalent counterions are white. The dashed-square section in the left figure is enlarged on the right.
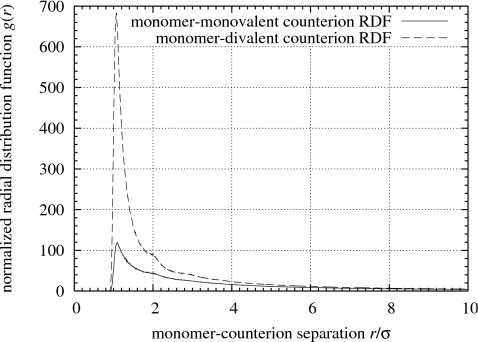
In Fig. 6 all of the divalent counterions (shown in white) are condensed onto the polyelectrolyte network backbone (black), while a significant fraction of the monovalent counterions (gray) remains scattered in a highly mobile gaslike state. The condensation of monovalent and divalent counterions onto the network backbone can be compared quantitatively via the normalized monomer-counterion pair radial distribution function shown in Fig. 7. The preferential condensation of divalent counterions onto the network backbone results in a sharp peak in the monomer-divalent counterion radial distribution function (dashed curve) at r∕σ=1 in Fig. 7 that is six times as tall as the peak for the monomer-monovalent counterion radial distribution function (solid curve). If both types of counterions interacted equally with the backbone monomers, the peak for the monomer-monovalent counterion radial distribution function would be 2(1−α)∕α=c1∕c2=4∕3 times the height of the peak of the monomer-divalent counterion radial distribution function, i.e., the ratio of the peak heights would be proportional to the ratio of the counterion concentrations.
Figure 7.
Monomer-monovalent counterion and monomer-divalent counterion pair radial distribution functions. The state of the gel is the same as in Fig. 6.
This preferential condensation of divalent counterions, which is consistent with recent anomalous small-angle x-ray scattering measurements of monovalent and divalent counterion cloud distributions around high molecular mass hyaluronic acid,18 arises thermodynamically from the increased translational entropy of mobile monovalent counterions and the decreased electrostatic energy in the ion-condensed state. The condensation of divalent counterions also provides more effective screening of the repulsion between charged monomers on the network backbone than the condensation of monovalent counterions does, thus strengthening the electrostatic cohesive forces within the gel. Therefore an increase in the concentration of divalent counterions (an increase in the value of α) in polyelectrolyte gels shifts the onset of discontinuous volume phase transitions from higher values of Γ to lower values, allowing the gels to undergo the swelling-collapse transition more readily in solvents of higher dielectric constants, as shown in Figs. 23.
Approximating polyelectrolyte gels as neutral gels
The approximate cancellation between the counterion excluded-volume contribution and the electrostatic contribution πelec to the osmotic pressure leaves the network contribution to the osmotic pressure πnw and the kinetic contribution to the osmotic pressure ρkBT to balance each other under equilibrium conditions. As pointed out earlier, this observation provides some justification for using a neutral network equation of state to model our polyelectrolyte gels.
Let us take into consideration the electrostatic and counterion excluded-volume contributions to the osmotic swelling pressure of real polyelectrolyte gels by rewriting Eq. 1 as
| (17) |
If we assume that the approximate cancellation between and πelec observed for simulated gels in equilibrium with a pure implicit solvent also holds true for real gels that are partially or fully swollen in salt solutions, then Eq. 17 reduces to Eq. 1. It was noted earlier that the curves in Fig. 1 were obtained by fitting Eq. 2 to experimental data points. As a result of this curve fitting Horkay and co-workers9, 27 obtain values for the interaction parameters χ0 and χ1 shown in Fig. 8. Whereas χ0 increases slightly with the Ca2+ concentration in the solvent, χ1 is sensitive to low Ca2+ concentrations and exhibits a sharp initial increase; the reasons for this behavior in χ1 are not understood. Nevertheless we see in Fig. 1 that Eq. 2 does appear to provide an adequate description of the experimental data.
For simulated polyelectrolyte gels we similarly show that their osmotic pressure can be modeled using Eq. 2. Because the osmotic pressure of the coarse-grained simulated gels is calculated using Eq. 15, we start with Eq. 15 instead of Eq. 17. If the approximate cancellation between and πelec holds true not only for simulated gels in equilibrium but also for cases where π≠0, Eq. 15 can be simplified to
| (18) |
The network contribution to the osmotic pressure πnw includes a network elasticity component and a polymer-solvent mixing component, so that
| (19) |
If the elasticity of the polyelectrolyte network is assumed to be ideal and primarily entropic in nature and the network is not under externally applied tension, then πelas asymptotically scales as πelas∼−ρkBT. Therefore we arrive at the approximation
| (20) |
for the simulated polyelectrolyte gels.
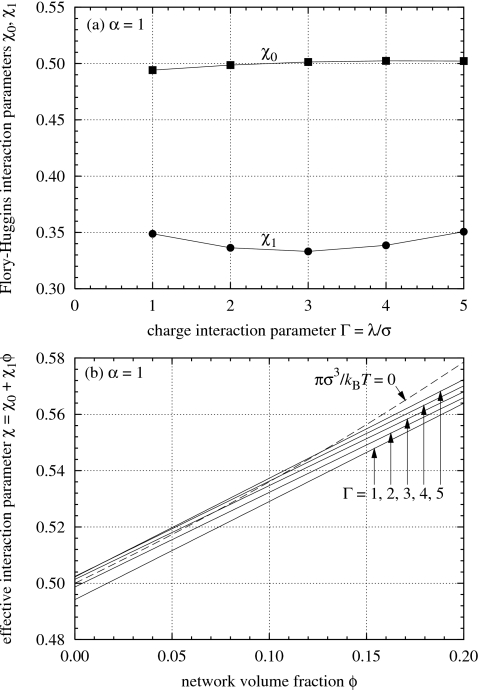
By using Eq. 20 as a bridge to fit Eq. 2 to the osmotic pressure π of the simulated gels for α=1.0 plotted in Fig. 4, we obtain values for the interaction parameters χ0 and χ1 shown in Fig. 9. The parameter χ0 is close to 0.5 and is relatively insensitive to the Bjerrum length λ. The parameter χ1 is close to the value 1∕3 and does not exhibit the sharp initial increase that was observed in Fig. 8.
Figure 9.
Flory–Huggins parameter χ=χ0+χ1ϕ as a function of the charge interaction strength Γ=λ∕σ and the gel volume fraction ϕ for simulated polyelectrolyte gels with divalent counterions α=1. The values of χ0 and χ1 shown here give the fitted isotherms for α=1 in Fig. 4.
As λ increases, the effective interaction parameter χ increases in the range of volume fractions ϕ shown in the lower part of Fig. 9, which is consistent with a gradual degradation in the solvent quality. The dotted curve in the lower part of Fig. 9 represents the equation χ=−[ln(1−ϕ)+ϕ]∕ϕ2, which by Eq. 2 is equivalent to πmix=0. The intersections of this dotted curve and the upper three solid curves (Γ=3, 4, and 5) correspond to the lowest three triangles on the α=1 curve in Fig. 3.
The results in Fig. 9 indicate that the second and third virial coefficients A2 and A3 of the simulated gels are close to zero,57 and therefore the swelling behavior of the gels do not deviate far from ideality. The analysis of experimental data shown in Fig. 8 tells us otherwise and suggests that the behavior of polyelectrolyte gels deviates significantly from ideality. Although a value of 0.5 for χ0 is consistent with the cancellation of excluded-volume entropy effects by an attractive energetic interaction, as we have observed in Fig. 5, our results indicate that, in the absence of excess salt, the PPM is still inadequate in capturing certain aspects of the experimentally observed behavior of polyelectrolyte gels. As noted earlier we have considered the incorporation of a distance-dependent dielectric constant51 in our simulations, but the results were not significantly improved. The shortcomings of the current simulation model may ultimately be due to the fact that it employs an implicit solvent and does not explicitly take into account the effects of excess salt in the solvent and in the gel. However, despite the quantitative discrepancies in the values of χ0 and χ1 that are obtained, the salt-free PPM model gives simulation results that qualitatively agree with experimental observations. Our next step for improving our understanding of the swelling behavior of polyelectrolyte gels will be to consider the case of excess salt. The complexity of simulating a polyelectrolyte gel in the presence of excess salt, however, puts it beyond the scope of the current work, and we leave our report on this subject for a subsequent article.
CONCLUSIONS
We have compared computer-simulated and experimentally measured osmotic pressure and volumetric data of polyelectrolyte gels. The simulation data were obtained from molecular dynamics simulations of a coarse-grained model polyelectrolyte network with explicit monovalent and divalent counterions in an implicit dielectric solvent, and compared with experimental measurements taken of polyacrylate gels swollen in nearly physiological salt solutions containing NaCl and CaCl2. The comparisons show good qualitative agreement between the simulation data and experimental data in several aspects, thus confirming the results of the simulations and the general utility of the simulation model. The simulations allowed us to examine the contributions to the osmotic pressure of polyelectrolyte gels, which are not accessible separately through experimental measurement, and to offer insight in the interpretation of the experimental results. In particular, the approximate cancellation between the counterion excluded-volume contribution and the electrostatic contribution to the osmotic pressure in the simulation data provided us with quantitative justification to model both experimental and simulated osmotic mixing pressure of polyelectrolyte gels using a modified Flory–Huggins equation of state for neutral polymer gels. However, the fact that the Flory–Huggins interaction parameters for the simulated polyelectrolyte gels exhibit nearly ideal behavior suggests that further improvements to the PPM must be made in order to capture qualitatively certain experimentally observed trends. We also observed the preferential condensation of divalent counterions over monovalent counterions onto the polyelectrolyte network backbone, and found that this phenomenon shifts the onset of discontinuous volume phase transitions to higher dielectric solvents as the divalent counterion concentration in the gel is increased.
ACKNOWLEDGMENTS
The authors are grateful for funding support by the U.S. National Science Foundation through the University of Wisconsin-Madison Materials Research Science and Engineering Center (UW MRSEC). D.W.Y. thanks the Grainger Wisconsin Foundation and the Natural Sciences and Engineering Research Council of Canada (PGSB-242497-2001) during the course of his studies. F.H. acknowledges the support of the Intramural Research Program of the NICHD, NIH. The authors also wish to thank T.A. Darden of the U.S. National Institute of Environmental Health Sciences for the SPME (Ref. 42) computer code that was used to calculate the electrostatic interactions. The simulations were performed on computers of the Grid Laboratory of Wisconsin at the University of Wisconsin-Madison.
References
- Tasaki I. and Byrne P. M., Biopolymers 10.1002/bip.360320812 32, 1019 (1992). [DOI] [PubMed] [Google Scholar]
- Zhang Y., Douglas J. F., Ermi B. D., and Amis E. J., J. Chem. Phys. 10.1063/1.1336148 114, 3299 (2001). [DOI] [Google Scholar]
- Hill T. L., J. Chem. Phys. 10.1063/1.1700720 20, 1259 (1952). [DOI] [Google Scholar]
- Yamasaki Y. and Yoshikawa K., J. Am. Chem. Soc. 10.1021/ja971849r 119, 10573 (1997). [DOI] [Google Scholar]
- Axelos M. A. V., Mestdagh M. M., and François J., Macromolecules 10.1021/ma00100a052 27, 6594 (1994). [DOI] [Google Scholar]
- Flory P. J., Principles of Polymer Chemistry (Cornell University Press, Ithaca, NY, 1953). [Google Scholar]
- Tanaka T., Phys. Rev. Lett. 10.1103/PhysRevLett.40.820 40, 820 (1978). [DOI] [Google Scholar]
- Tanaka T., in Polyelectrolyte Gels, ACS Symposium Series Vol. 480, edited by Harland R. S. and Prud’homme R. K. (American Chemical Society, Washington, DC, 1992), Chap. 1, pp. 1–21. [Google Scholar]
- Horkay F., Tasaki I., and Basser P. J., Biomacromolecules 10.1021/bm9905031 1, 84 (2000). [DOI] [PubMed] [Google Scholar]
- Wolgemuth C. W., Mogilner A., and Oster G., Eur. Biophys. J. 10.1007/s00249-003-0344-5 33, 146 (2004). [DOI] [PubMed] [Google Scholar]
- Katchalsky A. and Michaeli I., J. Polym. Sci. 10.1002/pol.1955.120157906 15, 69 (1955). [DOI] [Google Scholar]
- Dušek K. and Patterson D., J. Polym. Sci., Part A-2 10.1002/pol.1968.160060701 6, 1209 (1968). [DOI] [Google Scholar]
- Flory P. J., J. Chem. Phys. 10.1063/1.1698574 21, 162 (1953). [DOI] [Google Scholar]
- Flory P. J. and Osterheld J. E., J. Phys. Chem. 10.1021/j150518a014 58, 653 (1954). [DOI] [Google Scholar]
- Muthukumar M., Macromolecules 10.1021/ma021456z 35, 9142 (2002). [DOI] [Google Scholar]
- Huber K., J. Phys. Chem. 10.1021/j100140a046 97, 9825 (1993). [DOI] [Google Scholar]
- Ikegami A. and Imai N., J. Polym. Sci. 10.1002/pol.1962.1205616312 56, 133 (1962). [DOI] [Google Scholar]
- Horkay F., Hecht A. M., Rochas C., Basser P. J., and Geissler E., J. Chem. Phys. 10.1063/1.2402921 125, 234904 (2006). [DOI] [PubMed] [Google Scholar]
- Moerkerke R., Koningsveld R., Berghmans H., Dušek K., and Šolc K., Macromolecules 10.1021/ma00108a043 28, 1103 (1995). [DOI] [Google Scholar]
- Šolc K., Dušek K., Koningsveld R., and Berghmans H., Collect. Czech. Chem. Commun. 10.1135/cccc19951661 60, 1661 (1995). [DOI] [Google Scholar]
- Horkay F., Tasaki I., and Basser P. J., Biomacromolecules 10.1021/bm0056153 2, 195 (2001). [DOI] [PubMed] [Google Scholar]
- Horkay F. and Basser P. J., Biomacromolecules 10.1021/bm034372m 5, 232 (2004). [DOI] [PubMed] [Google Scholar]
- Yin D. -W., Yan Q., and de Pablo J. J., J. Chem. Phys. 10.1063/1.2102827 123, 174909 (2005). [DOI] [PubMed] [Google Scholar]
- Patra C. N. and Yethiraj A., J. Phys. Chem. B 10.1021/jp991062i 103, 6080 (1999). [DOI] [Google Scholar]
- Zrínyi M. and Horkay F., J. Polym. Sci., Polym. Phys. Ed. 10.1002/pol.1982.180200504 20, 815 (1982). [DOI] [Google Scholar]
- Vink H., Eur. Polym. J. 10.1016/0014-3057(71)90035-8 7, 1411 (1971). [DOI] [Google Scholar]
- Horkay F., Basser P. J., Hecht A. -M., and Geissler E., Macromolecules 10.1021/ma000972r 33, 8329 (2000). [DOI] [PMC free article] [PubMed] [Google Scholar]
- Yan Q. and de Pablo J. J., Phys. Rev. Lett. 91, 018301 (2003). [DOI] [PubMed] [Google Scholar]
- Schneider S. and Linse P., Eur. Phys. J. E 8, 457 (2002). [DOI] [PubMed] [Google Scholar]
- Schneider S. and Linse P., J. Phys. Chem. B 10.1021/jp022336w 107, 8030 (2003). [DOI] [Google Scholar]
- Schneider S. and Linse P., Macromolecules 10.1021/ma035512n 37, 3850 (2004). [DOI] [Google Scholar]
- Edgecombe S., Schneider S., and Linse P., Macromolecules 10.1021/ma0486391 37, 10089 (2004). [DOI] [Google Scholar]
- Mann B. A., Everaers R., Holm C., and Kremer K., Europhys. Lett. 10.1209/epl/i2004-10121-x 67, 786 (2004). [DOI] [Google Scholar]
- Mann B. A., Holm C., and Kremer K., J. Chem. Phys. 10.1063/1.1882275 122, 154903 (2005). [DOI] [PubMed] [Google Scholar]
- Chandler D. and Weeks J. D., Phys. Rev. Lett. 10.1103/PhysRevLett.25.149 25, 149 (1970). [DOI] [Google Scholar]
- Weeks J. D., Chandler D., and Andersen H. C., J. Chem. Phys. 10.1063/1.1674820 54, 5237 (1971). [DOI] [Google Scholar]
- Andersen H. C., Weeks J. D., and Chandler D., Phys. Rev. A 10.1103/PhysRevA.4.1597 4, 1597 (1971). [DOI] [Google Scholar]
- Stevens M. J. and Kremer K., J. Chem. Phys. 10.1063/1.470698 103, 1669 (1995). [DOI] [Google Scholar]
- Micka U., Holm C., and Kremer K., Langmuir 10.1021/la981191a 15, 4033 (1999). [DOI] [Google Scholar]
- Bird R. B., Curtiss C. F., Armstrong R. C., and Hassager O., Dynamics of Polymeric Liquids: Kinetic Theory, 2nd ed. (Wiley, New York, 1987), Vol. 2. [Google Scholar]
- H. R.Warner, Jr., Ind. Eng. Chem. Fundam. 10.1021/i160043a017 11, 379 (1972). [DOI] [Google Scholar]
- Essmann U., Perera L., Berkowitz M. L., Darden T. A., Lee H., and Pedersen L. G., J. Chem. Phys. 10.1063/1.470117 103, 8577 (1995). [DOI] [Google Scholar]
- Martyna G. J., Klein M. L., and Tuckerman M. E., J. Chem. Phys. 10.1063/1.463940 97, 2635 (1992). [DOI] [Google Scholar]
- Sehgal A. and Seery T. A. P., Macromolecules 10.1021/ma980416l 31, 7340 (1998). [DOI] [Google Scholar]
- Sehgal A. and Seery T. A. P., Macromolecules 10.1021/ma034251e 36, 10056 (2003). [DOI] [Google Scholar]
- Reith D., Meyer H., and Müller-Plathe F., Macromolecules 10.1021/ma001499k 34, 2335 (2001). [DOI] [Google Scholar]
- Nörtemann K., Hilland J., and Kaatze U., J. Phys. Chem. A 10.1021/jp971623a 101, 6864 (1997). [DOI] [Google Scholar]
- Jayaram B., Swaminathan S., Beveridge D. L., Sharp K., and Honig B., Macromolecules 10.1021/ma00214a021 23, 3156 (1990). [DOI] [Google Scholar]
- Winkler R. G., Gold M., and Reineker P., Phys. Rev. Lett. 10.1103/PhysRevLett.80.3731 80, 3731 (1998). [DOI] [Google Scholar]
- Chu J. C. and Mak C. H., J. Chem. Phys. 10.1063/1.477989 110, 2669 (1999). [DOI] [Google Scholar]
- Lenart P. J., Jusufi A., and Panagiotopoulos A. Z., J. Chem. Phys. 10.1063/1.2431169 126, 044509 (2007). [DOI] [PubMed] [Google Scholar]
- Yan Q. and de Pablo J. J., J. Chem. Phys. 10.1063/1.1335653 114, 1727 (2001). [DOI] [Google Scholar]
- Yan Q. and de Pablo J. J., Phys. Rev. Lett. 10.1103/PhysRevLett.86.2054 86, 2054 (2001). [DOI] [PubMed] [Google Scholar]
- Yan Q. and de Pablo J. J., J. Chem. Phys. 10.1063/1.1435567 116, 2967 (2002). [DOI] [Google Scholar]
- Yan Q. and de Pablo J. J., Phys. Rev. Lett. 10.1103/PhysRevLett.88.095504 88, 095504 (2002). [DOI] [PubMed] [Google Scholar]
- Panagiotopoulos A. Z. and Fisher M. E., Phys. Rev. Lett. 10.1103/PhysRevLett.88.045701 88, 045701 (2002). [DOI] [PubMed] [Google Scholar]
- Rubinstein M. and Colby R. H., Polymer Physics, 1st ed. (Oxford University Press, Oxford, UK, 2003). [Google Scholar]


