

Abstract
In previous work we introduced a novel method for reducing global interference, based on adaptive filtering, to improve the contrast to noise ratio (CNR) of evoked hemodynamic responses measured non-invasively with near infrared spectroscopy (NIRS). Here, we address the issue of how to generally apply the proposed adaptive filtering method. A total of 156 evoked visual response measurements, collected from 15 individuals, were analyzed. The similarity (correlation) between measurements with far and near source-detector separations collected during the rest period before visual stimulation was used as indicator of global interference dominance. A detailed analysis of CNR improvement in oxy-hemoglobin (O2Hb) and deoxy-hemoglobin (HHb), as a function of the rest period correlation coefficient, is presented. Results show that for O2Hb measurements, 66% exhibited substantial global interference. For this dataset, dominated by global interference, 71% of the measurements revealed CNR improvements after adaptive filtering, with a mean CNR improvement of 60%. No CNR improvement was observed for HHb. This study corroborates our previous finding that adaptive filtering provides an effective method to increase CNR when there is strong global interference, and also provides a practical way for determining when and where to apply this technique.
Keywords: near infrared, brain, visual cortex, vision, hemodynamics, adaptive filter, interference, cancellation, physiological noise
Introduction
Over the last decade there have been numerous studies showing that near infrared spectroscopy (NIRS) can be used to measure functional brain activity non-invasively, both in adults and in infants (e.g., Durduran et al., 2004; Franceschini et al., 2003; Hespos et al., In press; Jasdzewski et al., 2003; Maki et al., 1996; Meek et al., 1998; Miki et al., 2005; Obrig et al., 2002; Schroeter et al., 2002; Toronov et al., 2007; Villringer and Chance, 1997; Villringer et al., 1993; Watanabe et al., 1998; Wilcox et al., 2005; Zeff et al., 2007). With non-invasive NIRS techniques, light is introduced into the head through the intact scalp. To reach cortical tissue, photons must travel through overlaying tissue, including the scalp and the skull. Thus, the measured signals (HHb and O2Hb concentration changes) are a mixture of hemodynamic signals occurring in the gray matter and interfering signals occurring in these overlaying tissue layers (McCormick et al., 1991; McCormick et al., 1992; Steinbrink et al., 2005; Toronov et al., 2001). Among the major sources of interference are cardiac and respiratory activity, which are themselves partly coupled. There are also low frequency spontaneous physiological oscillations (referred to as LFOs, vasomotor waves or Mayer's waves) around 0.1 Hz, as well as very low frequency oscillations around 0.04 Hz (Obrig et al., 2000). All of these interference sources are located both in the vasculature of the layers overlaying the brain and in the brain itself, and are often referred to as “global interference”. To improve the noninvasive measurement of brain activity, numerous methods have been proposed to reduce interference due to such global physiological effects including: low-pass filtering (Franceschini et al., 2003; Jasdzewski et al., 2003), subtraction of an average “noise” (cardiac) waveform (Gratton and Corballis, 1995), linear regression against a close source-detector pair (Saager and Berger, 2005), state space estimation (Diamond et al., 2006; Kolehmainen et al., 2003; Prince et al., 2003), principal components analysis (Zhang et al., 2005), and adaptive filtering using a pulse oximetry reference waveform (Morren et al., 2004). While each of these methods can help improve NIRS signals, and variants have been used in functional MRI and EEG analysis (e.g., Bonmassar et al., 2002), considerable room for improvement remains in terms of contrast improvement and suitability to real-time use. The main disadvantage of low-pass filtering procedures is that they can reduce hemodynamic responses as well as noise because these components overlap in terms of frequency spectra. Furthermore, low-pass filtering methods cannot be used with common event-related designs, because the frequency bands of physiological noise and stimulus evoked activations are highly overlapping. Methods based on subtracting average “noise” waveforms from the recorded time series only correct for one type of oscillation and do not take into account the nonstationarity of the oscillation shape. Methods using pulse oximetry reference waveforms measured far from the head can only reduce global interference due to cardiac oscillations (Zhang et al., 2007a, b).
To overcome some of these problems, we developed a new method, based on adaptive filtering, to remove global interference (Zhang et al., 2007a, b; Zhang et al., 2005). The key idea of this method is to employ NIRS measurements of HHb and O2Hb from detectors close to the source(s) to estimate hemodynamic changes in the overlaying tissue layers. These measurements are used as a reference channel by an adaptive filter. Next, using this reference, the adaptive filter estimates global interference, which is then removed from the target signals measured from detectors farther away from the sources. The simulations carried out by Zhang et al. (2007a) indicate that this method is effective at removing global interference because such interference is largely produced by signals in the overlaying tissue layers. In addition to evaluating the method with Monte Carlo simulations, we have also shown a proof of principle that it can effectively reduce global interference in vivo (Zhang et al., 2007b). Here, we address the generalizability of these findings, the domain of applicability of this technique, and their interpretation. We applied our adaptive filtering method to NIRS data obtained from a set of 156 NIRS time series collected from 15 participants in order to replicate and expand our original findings. We predicted that adaptive filtering would improve the contrast-to-noise ratio for O2Hb measurements when there is global interference. We also sought to quantify the efficacy of our adaptive filtering method, and its dependence on the contrast-to-noise ratio of the original measurements.
Material and methods
Participants
Seventeen individuals (10 females, 7 males; mean age = 20.6 years), volunteered for the study. All had normal or corrected-to-normal vision, no history of neurological disease, and were right-handed. All participants gave written informed consent prior to the study, according to the protocols approved by the Massachusetts General Hospital Institutional Review Board. Complete data from two participants (1 female, 1 male) was not available because of technical problems before or during data acquisition. We therefore analyzed data from 15 participants.
Stimuli
The stimuli were flickering polar checkerboards subtending 15 × 15 degrees of visual angle. To maximize visual activation, high contrast visual stimuli (over 50%) were flickered at 8 Hz. To ensure people were paying attention to the stimuli, once every 5 seconds, on average, one of the checkers in the checkerboard, chosen randomly, turned red for 125 ms, and participants pressed a button with their dominant hand every time they detected such a change. These types of visual stimuli are well known to produce robust activation in retinotopically organized areas in the occipital lobe (e.g., Sereno et al., 1995), maximizing the chances that visually evoked activation would be present at all occipital recording sites.
Procedure
Prior to the session, we administered general health history and Edinburgh Handedness (Oldfield, 1971) questionnaires. Tasks were administered on a MacIntosh G3 Powerbook computer using Psyscope software (Macwhinney et al., 1997). Participants were supine on a reclining bed and viewed the stimuli on a computer screen, which was positioned within view via an extensible mechanical arm. The screen was placed approximately 57 cm from the participants' eyes. Responses to the red checkers were made with the index finger of the dominant hand, using a button box placed on the bed. Each run consisted of alternating 15 seconds of visual stimulation with 15 seconds of fixation, for a total of at least 10 cycles. At the onset of each stimulation block, a digital signal was sent by the presentation computer to the NIRS instrument, via a specialized button box (Carnegie Mellon University, Pittsburgh).
Optical data was collected using two NIRS1 devices (TechEn, Milford, MA) used in previous studies (Jasdzewski et al., 2003; Zhang et al., 2007b). Each device used two source lasers (690 and 830 nm), and three detectors (Hamamatsu C5460-01), arranged into two vertical rows. The geometry of the optical probe is illustrated in Figure 1. The lights from two diode lasers were combined using bifurcated glass fiber bundle with a nominal 2.7 mm core diameter (Fiberoptics Technology, prototype). Detector fibers were glass fiber bundles with also 2.7mm core diameter. The optical fiber bundles (optodes) were anchored in a flexible piece of plastic that was attached to a black Velcro headband that fastened snugly around the head of the subject. Soft, black Velcro was also used to absorb stray light beneath the probe. The lasers were intensity-modulated by an approximately 4 kHz square wave and an in-phase/quadrature-phase (IQ) detection scheme. The analog optical signals were low pass filtered at 3.4 Hz using second order RC low pass filter. These signals were simultaneously sampled at 200 Hz, and transferred to computer using a 16bit A/D conversion (Measurement Computing, PCM-DAS16D/16). Thus, all signal channels were precisely synchronized to enable accurate comparison of timings of event onsets.
Figure 1.
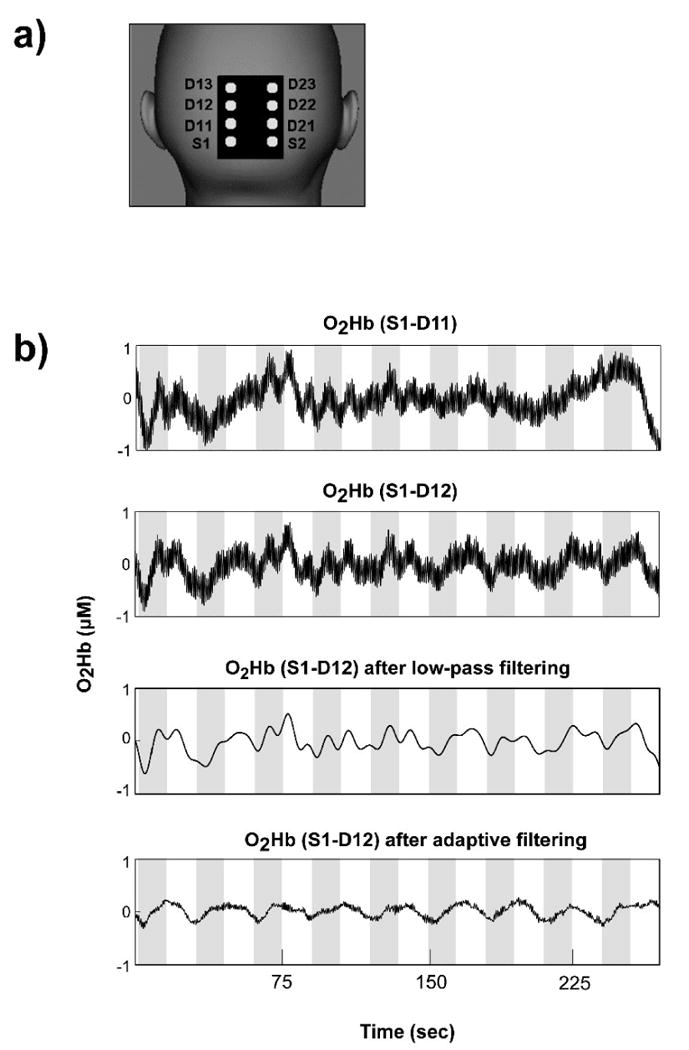
Representative case (see also Figures 2 and 4) of adaptive filtering to remove global interference to recover hemodynamic changes elicited by visual stimulation. a) Probe geometry schematic; b) The time series at the top shows O2Hb concentration changes calculated from optode pair S1-D11 (near detector). The time series in the second row shows O2Hb concentration changes calculated from optode pair S1-D12 (middle detector), before adaptive filtering. The CNR in this case was 55.3%. The time series in the third row shows the results of low-pass filtering (cut-off frequency: 0.125 Hz). Finally, the time series at the bottom shows the results of adaptive filtering applied to the top time series. Adaptive filtering increased the CNR to 187.3%. The gray bands on the time series depict visual stimulation periods.
The combined light of two wavelengths were in contact with tissue in one source location (Sx in Figure 1, where x is 1 or 2, defining the optode row), and exiting light was collected from three detectors for each NIRS device (a total of six), placed 11 mm (Dx1, near), 26 mm (Dx2, mid) and 40 mm (Dx3, far) from the respective source, as illustrated in Figure 1. During the visual task, the center of the multi-channel NIRS probe was positioned on the participant's midline, over caudal parts of visual areas V1 and V2 (confirmed by existing MRI scan on a subset of participants), so that the centers of the two optode rows were about 20 mm left and right of midline.
Data Analysis
Similar to our previous study (Zhang et al., 2007b) the raw 200 Hz optical data were offset-corrected and digitally low-pass filtered at 5Hz (in addition to the instrument filter) to further reduce instrument noise. The optical measurements for each channel were converted to relative concentration changes of HHb and O2Hb using the modified Beer-Lambert Law (e.g., Strangman et al., 2003). Concentration measurements were then band-pass filtered (pass band: 0.01Hz to 1.25Hz ) to further remove any slowly drifting signal components and other noise with frequencies far from the target signal, then down-sampled to 20 Hz. Based on our previous Monte Carlo simulations with common head structure and tissue optical properties (Zhang et al., 2007a), we chose the following differential path length factors (DPF), although previous work has demonstrated the approach is relatively insensitive to DPF (Zhang et al., 2007a): 5.4 for S-D1, 6.7 for S-D2, and 7 for S-D3 at 690 nm; 5.1 for S-D1, 6.3 for S-D2, and 6.6 for S-D3 at 830 nm.
The time series of O2Hb concentration changes acquired from all source-detector pairs (S1-D11, S1-D12, S1-D13, S2-D21, S2-D22, and S2-D23) were fed into the adaptive filter (HHb was filtered similarly but separately). The adaptive filter used a finite impulse response (FIR) and transversal structure (tapped delay line), with 100 nodes, and Widrow-Hoff Least Mean Squared (LMS) adaptation algorithm (for additional details, see Zhang et al., 2007b). The Matlab code used to perform the adaptive filtering can be obtained by contacting the corresponding author.
To assess the contrast-to-noise ratio (CNR) of the detected visual response we performed power spectral density (PSD) analysis, as in our case study (Zhang et al., 2007b). Briefly, the signal power is calculated by integrating the power (in linear scale) from the PSD over the “signal bands”, the noise power is calculated by integrating the rest of the power spectrum (“noise bands”), and the CNR is calculated as the square root of the ratio of signal power to noise power. The signal bands of the vision response in our stimulation paradigm are defined as 0.028-0.039Hz (fundamental band) and 0.061-0.072Hz (second harmonic). These bands were chosen because (i) 0.033Hz and 0.066Hz are the fundamental frequency and the second harmonic of the evoked visual response signal, respectively, containing most of the signal power of the visual response (Zhang et al., 2007b), and (ii) these two peaks in the power spectrum have a width of roughly 0.011Hz. The noise bands comprise the rest of the spectrum in the 0-10Hz range. Given the periodic nature of our visual stimulation, this frequency domain method of defining CNR is preferable to time domain methods because it enables more accurate separation between signal and noise.
Our theoretical work suggested that a measurement of the degree of global interference dominance is important to maximize the benefit of adaptive filtering: adaptive filtering may be beneficial only if the target channel shows interference similar to the reference channel. In this group study, global interference dominance was evaluated using the Pearson correlation coefficient between the reference and each target time series during the rest period, when there was no visual stimulation.
In addition, we anticipated that recordings with poor signal quality (low signal-to-noise ratio, or SNR) would not benefit from adaptive filtering. The hypothesis is that at low SNR, the measurement will not be dominated by global interference common to both the target and reference measurements, and hence adaptive filtering will not help. We therefore also computed SNR for each oxygenation measurement. While measurement noise includes both shot noise and electronic noise (Zhang et al., 2001), at low SNR usually our measurements are dominated by electronic noise; hence only electronic noise is considered here. The electronic noise was measured as the standard deviation of the measurements acquired when the laser is turned off, and, in principle, is proportional to the noise equivalent power (NEP) of the NIRS instrument.
Results
A total of 156 O2Hb and HHb time series were successfully acquired: four measurements (from S1-D12, S1-D13, S2-D22, and S2-D23) from each of 39 experimental runs on 15 participants. In the correlation coefficient calculation for global interference dominance estimation, the length of the available rest period with no visual stimulation differed slightly for different NIRS time series, ranging from 7 to 20 sec (mean 12 sec, standard deviation 5 sec, N=152). For four of the time series the leading rest period was not available due to technical difficulties, so the correlation coefficient was calculated using a separate run on the same subject. The correlation coefficient was calculated with short baseline periods at the beginning of each run because one of the potential applications of this method is real-time adaptive filtering of NIRS signals, for which fast estimates are critical. The correlation coefficients were comparable with those calculated with longer baseline. A representative case of adaptive filtering of O2Hb time series is shown in Figures 1 and 2. The CNR before adaptive filtering for this case was 55.3%, after filtering the CNR increased to 187.3%, demonstrating a CNR improvement of 239%. Figures 1 and 2 also show a comparison between low-pass and adaptive filtering, using a particularly low 0.125 Hz low-pass filter cutoff. Critically, adaptive filtering reduces the variability in the data (Figure 2c), relative to more traditional low-pass filtering (Figure 2b; standard deviation of 0.063 vs. 0.144, respectively, t(600)>20, p<.00001). Furthermore, by removing the physiological oscillatory noise observed in the near detector (Figure 2a), adaptive filtering results in a qualitatively different shape for the hemodynamic response, eliminating the two peaks visible in the low-pass filtered average. This is important because such peaks could be interpreted erroneously as being due to the dynamics of visually elicited neural activation (instead of residual physiological noise).
Figure 2.
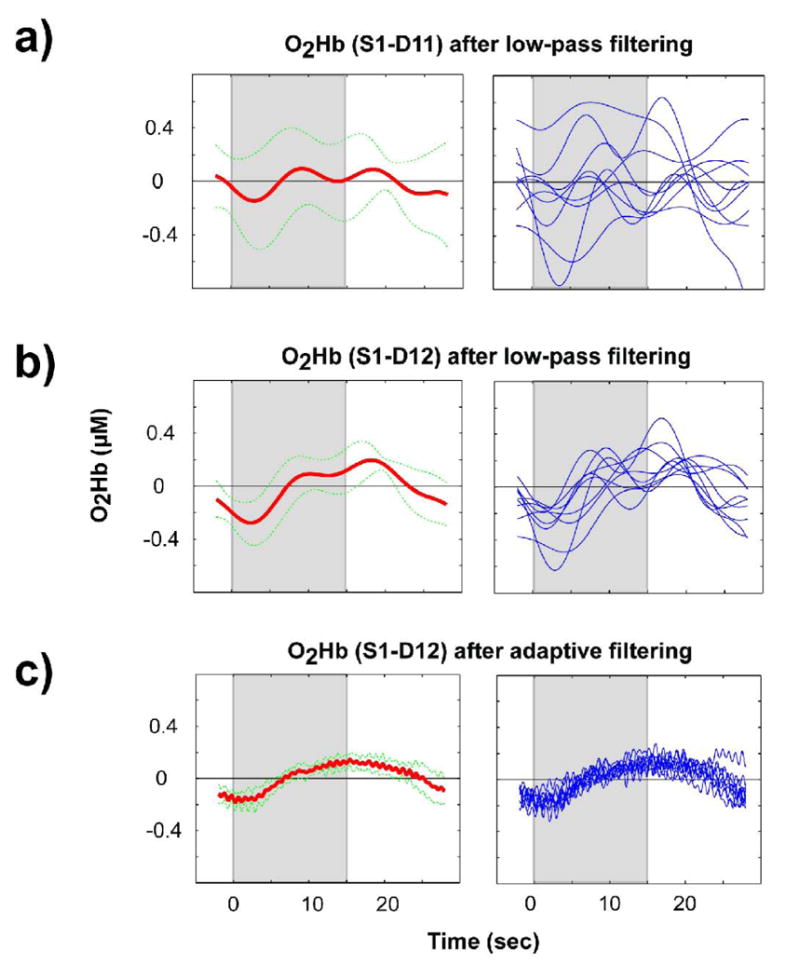
The panels in the left column show the average responses (thick lines) and corresponding standard deviation (thin, dotted lines) for the data shown in Figure 1. The panels in the right column show data for all the individual blocks (9) that comprise the corresponding average on the left; a) results for optode pair S1-D11 (near detector) after low-pass filtering; b) results for optode pair S1-D12 (middle detector) after low-pass filtering; c) results for optode pair S1-D12 after adaptive filtering. The gray bands depict the period during which visual stimulation occurred.
Figure 3 and Table 1 summarize the CNR improvement after adaptive filtering for the entire dataset as a function of the rest period correlation coefficient, where one point is plotted for every channel in each run collected (N=156). As can be seen from Figure 3, for O2Hb, when the rest period correlation coefficient is low, the CNR improvement for evoked visual signal detection is also low; in fact, most of the measurements show decreased CNR after adaptive filtering. When the correlation coefficient is high, however, there is substantial CNR improvement, with most measurements revealing increased CNR after adaptive filtering, up to 400% improvement. Ideally, we would be able to predict the percent CNR improvement from the rest period correlation coefficients, and to apply adaptive filtering only when needed. The simplest way to achieve this is to use a threshold. The data in Figure 3a suggests a more rapid increase in CNR improvement with increasing correlation at a correlation coefficient threshold of approximately 0.6, where we consider values higher than this threshold as indicating substantial global interference dominance for O2Hb. Note that, although we chose a threshold of 0.6 to illustrate our findings, the general pattern of results holds for a range of thresholds. Using this value, 101 O2Hb measurements, out of the total of 156 cases (65%) are dominated by global interference, and 72 out of these 101 cases (71%) show improved CNR (first row in Table 1). A binomial sign test, justified by our expectation that the CNR improvements would fail parametric distribution assumptions, finds this proportion significant (p=0.00002). The CNR change ranges from -77% to 404%, and the average CNR improvement is 60% (the median value is 49%). Some measurements in this set still show decreased CNR, and further exploration is needed to understand why. If we look at CNR improvement for all 156 measurements without considering whether it is global interference dominated, 77 measurements (49%) show CNR improvement, which was not significant by a sign test (p=0.9). This result suggests that the set of measurements with substantial global interference dominance (as defined by our threshold) reliably benefit from adaptive filtering.
Figure 3.
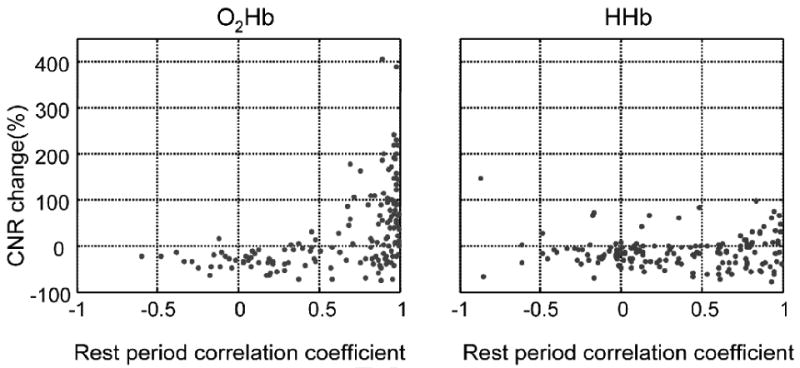
CNR improvement, defined as , versus global interference dominance (measured by the Pearson correlation coefficient during the rest period); a) O2Hb; b) HHb.
Table 1.
Percent CNR improvement when applying adaptive filtering relative to no filtering.
| N* | Np* | Mean | St Dev. | Median | Range | |
|---|---|---|---|---|---|---|
| O2Hb (r>0.6) | 101 | 72 | 60% | 91% | 49% | -77% to 404% |
| O2Hb (all) | 156 | 77 | 28% | 86% | -1.7% | -77% to 404% |
| HHb (r>0.8) | 31 | 17 | -1.6% | 46% | 3.3% | -78% to 97% |
| HHb (all) | 156 | 36 | -14% | 35% | -16% | -78% to 146% |
N is the total number of measurements, Np is the number of measurements showing positive CNR changes.
For HHb, as can be seen from the right plot in Figure 3b, most of the cases show decreased CNR after adaptive filtering, even at higher rest period correlation coefficients. Selecting r=0.8 as a correlation threshold to maximize the benefit of adaptive filtering for HHb, some 31 HHb measurements remain, 17 of which (or 55% of this set) show CNR>0, a proportion which is not significant by a sign test (p=0.7). When considering all 156 HHb measurements, 36 cases (23%) show CNR improvement. In this case, a sign test indicates that our filtering method reliably degrades the HHb signal (p<0.00001).
The distribution of CNR before and after adaptive filtering can be found in Figure 4, separating the measurements by rest period correlation coefficients and by O2Hb/HHb. The mean CNR of all 156 O2Hb measurements is 64% before adaptive filtering and 75% after filtering. For rest period correlation coefficients larger than 0.6, the mean CNR is 70% before adaptive filtering and 97% after filtering. For HHb, the mean CNR of all 156 measurements is 85% and 63% before and after adaptive filtering, respectively. For measurements with rest period correlation coefficient larger than 0.8, the original mean CNR is 109% and after adaptive filtering it is reduced to 85%, again supporting the conclusion that HHb does not benefit from this adaptive filtering approach.
Figure 4.
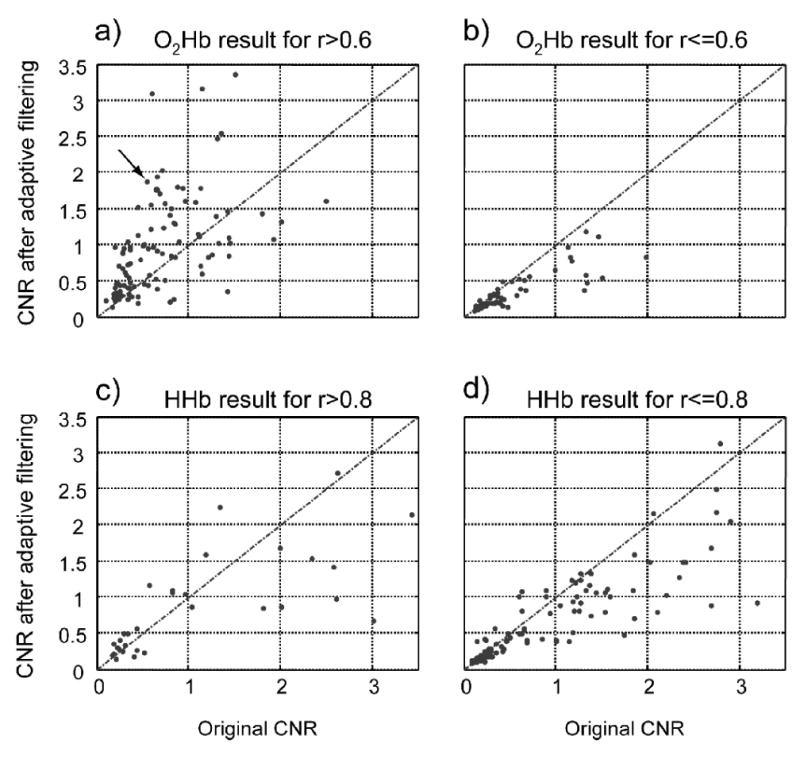
CNR before and after adaptive filtering for different sets; a) and b): O2Hb with rest period correlation coefficient threshold; c) and d) are the same, but for HHb. Dots above the lines are the measurements with improved CNR after adaptive filtering, r is the rest period correlation coefficient. The arrow points to the case shown in Figures 1 and 2.
We also sought to quantify the extent to which the reference and target measurements correlated in O2Hb versus HHb. Using a mixed-effects linear regression (Pinheiro and Bates, 2000), we found that O2Hb exhibited a mean target-reference correlation of 0.61 +/-0.38, whereas HHb exhibited mean target-reference correlations of 0.37+/-0.45, a significant difference, T(308.1) = 5.0, p<0.0001, indicating, as expected, that global interference is stronger on O2Hb measurements.
Finally, we had expected an effect of SNR on filtering efficacy. We therefore performed a mixed-effects linear regression between the channel-minimum SNR and the resulting CNR improvement. Significant positive relationships were observed in both O2Hb [T(116)=5.8, p<0.0001] and HHb [T(116)=3.9, p=0.0001]. Measurements where SNR<10 consistently showed poor correlations (r<0.6) and either no improvement or decreases in CNR
Discussion
We begin by summarizing the two principal findings from this study. First, adaptive filtering improves the CNR for O2Hb when there is substantial global interference. This should remain true, at least quantitatively, even in comparison to simple subtraction [as discussed in (Zhang et al., 2007a)] as well as low-pass filtering methods. In contrast, adaptive filtering did not help, and actually degraded, the CNR for HHb. One key factor to make the adaptive filtering approach practical is to find a way to pre-identify those measurements that will benefit most from adaptive filtering. Our study suggests that a rest period correlation coefficient can help predict the magnitude of O2Hb CNR improvement. Second, we also demonstrated that HHb and O2Hb differ significantly in the rest period correlation coefficient and in their response to adaptive filtering when there is visual stimulation using multi separation data collection.
Before further discussing these findings, it is important to point out that our results represent a worst case scenario. Indeed, despite the full-field, high contrast visual stimuli used in the study, some measurements may have contained no visually evoked activation, and hence could not generate a CNR improvement. While these conclusions are relatively straightforward, the reason for the qualitative difference between O2Hb and HHb merits discussion. In principle, adaptive filtering works well when the multi separation measurements share a significant amount of common mode signal, and the statistical properties of this common mode signal change (i.e., are non stationary). The fact that adaptive filtering performs poorly for HHb means that HHb is more strongly affected by local changes than global ones, e.g. related to the heterogeneous distribution of blood vessels or blood supply. While HHb and O2Hb are computed from the same raw NIRS data, under normal circumstances HHb is generated via oxygen utilization in tissue, and oxygen utilization by brain and scalp differ, both due to different regional demands for oxygen, and differences in cerebral blood flow regulation which are not paralleled in the scalp. These differences would lead to the prediction of poorer correspondences between scalp and brain HHb measures, as observed, and a correspondingly reduced ability for adaptive filtering to improve CNR, as also observed. In contrast, the dominant sources of physiological “noise” when trying to detect brain function are often arterial, respiratory and lower frequency vasomotor oscillations (Obrig et al., 2000). These pulsatile components are present in the arterial compartment, which typically is greater than 95% oxygenated, and such oscillations would be expected in both cerebral and extra-cerebral tissue. Hence, one might expect better performance of our adaptive filtering method on O2Hb, given the closer expected correspondence between reference and target measurements. Indeed, the measurement similarities were significantly closer for O2Hb than for HHb.
In both O2Hb and HHb, numerous data points exhibited negative changes in CNR with adaptive filtering. Decreases in CNR could be due to changes localized near the target or reference detector contact point. Any independent changes in the reference measurement, when subtracted from the target during adaptive filtering, will effectively be injected into the target measurement, thereby decreasing the target measurement CNR. In addition, if there are any systemic changes correlated with the stimulus delivery (e.g., increase in heart rate or blood pressure, more typical during motor stimulation than during visual stimulation), it is possible that this stimulus-related systemic change in the reference measurement could negatively affect the observed CNR, as found in other neuroimaging contexts (e.g., Bullmore et al., 1999). The various potential reasons behind the CNR decreases remain to be investigated in detail.
Our reported results depend on the selection of “similarity thresholds” between reference and target measurements. In theory, an optimized threshold should be chosen, but such a threshold will change with various experimental parameters including probe geometry. Since the major goal of this study was to demonstrate how well and when our adaptive filtering approach helps in general, we did not investigate methods for optimal threshold selection and pooled the measurements from 2.6 and 4.0cm source-detector separations for analysis.
Our findings also suggest that our adaptive filtering technique is best applied when there is substantial global interference (e.g. judged by rest period correlation coefficient >0.6), and that the filtering should be exclusively applied to O2Hb signals, not HHb. We have also shown that, as anticipated, SNR of both the target and reference NIRS signals affects the adaptive filtering result: it is better if the SNR is at least 10 to 1. More work is needed to establish a complete and standardized way of predicting CNR improvement using signal processing techniques, including the reason for some CNR decreases following adaptive filtering even when interference dominates the signal (e.g., r>0.6). Further exploration could also help better understand the physiology behind the difference between HHb and O2Hb during the rest period, their differential response to adaptive filtering, and to use the resulting information to improve noninvasive, in vivo cerebral measurements.
In this study, a single short-distance detector per hemisphere was used. An important question is whether a separate short-distance detector would be needed for every optode, or whether a single such detector may be sufficient to measure global interference. For example, although the Mayer's wave is a global factor, its contribution may be different at measurements collected at different sites because of heterogeneity in blood vessel sizes, location, or geometry. In addition, since different optodes have different contact and skin conditions (e.g., due to hair, focal pigmentation, sweating), the corresponding interference may be different at different sites. Ideally, one would have one reference measurement for each target source-detector pair. However, many such reference measurements would likely be redundant. The optimal (or minimum) number of required reference measurements remains to be established.
In summary, adaptive filtering and related methods, are promising for cognitive neuroscience researchers using NIRS techniques to probe the human brain non-invasively. On the one hand, by reducing the effect of global interference on the O2Hb measurements, one could conduct shorter studies and still achieve sufficiently high CNR, thus minimizing the effects of fatigue and adaptation. On the other hand, adaptive filtering methods may make it possible to obtain better sensitivity or specificity for the time course of neural changes non-invasively, possibly even at the level of single trials, which are key to understand the relationship between brain and behavior. This approach is particularly well suited to event-related designs where the use of a low pass filter with a low frequency cutoff is not possible. This type of adaptive filtering techniques can also be applied in real-time, enabling better on-line recording evaluation or even higher sensitivity feedback paradigms for neuroscience research.
Acknowledgments
We would like to thank Christina Supelana for technical support. This effort was supported primarily by the NIMH (R21-MH068610), with contributions from the NSF (BCS-0322611), the NIBIB (R01-EB006589), and the National Space Biomedical Research Institute through NASA Cooperative Agreement NCC 9-58.
Funding Sources: NIH (R21-MH068610-01A1), NSF (BCS-0322611), NIBIB (R01-EB006589)
Footnotes
Financial Disclosure: Nothing to disclose.
Publisher's Disclaimer: This is a PDF file of an unedited manuscript that has been accepted for publication. As a service to our customers we are providing this early version of the manuscript. The manuscript will undergo copyediting, typesetting, and review of the resulting proof before it is published in its final citable form. Please note that during the production process errors may be discovered which could affect the content, and all legal disclaimers that apply to the journal pertain.
References
- Bonmassar G, Purdon PL, Jaaskelainen IP, Chiappa K, Solo V, Brown EN, Belliveau JW. Motion and ballistocardiogram artifact removal for interleaved recording of EEG and EPs during MRI. Neuroimage. 2002;16:1127–1141. doi: 10.1006/nimg.2002.1125. [DOI] [PubMed] [Google Scholar]
- Bullmore ET, Brammer MJ, Rabe-Hesketh S, Curtis VA, Morris RG, Williams SC, Sharma T, McGuire PK. Methods for diagnosis and treatment of stimulus-correlated motion in generic brain activation studies using fMRI. Hum Brain Mapp. 1999;7:38–48. doi: 10.1002/(SICI)1097-0193(1999)7:1<38::AID-HBM4>3.0.CO;2-Q. [DOI] [PMC free article] [PubMed] [Google Scholar]
- Diamond SG, Huppert TJ, Kolehmainen V, Franceschini MA, Kaipio JP, Arridge SR, Boas DA. Dynamic physiological modeling for functional diffuse optical tomography. Neuroimage. 2006;30:88–101. doi: 10.1016/j.neuroimage.2005.09.016. [DOI] [PMC free article] [PubMed] [Google Scholar]
- Durduran T, Yu G, Burnett MG, Detre JA, Greenberg JH, Wang J, Zhou C, Yodh AG. Diffuse optical measurement of blood flow, blood oxygenation, and metabolism in a human brain during sensorimotor cortex activation. Opt Lett. 2004;29:1766–1768. doi: 10.1364/ol.29.001766. [DOI] [PubMed] [Google Scholar]
- Franceschini MA, Fantini S, Thompson JH, Culver JP, Boas DA. Hemodynamic evoked response of the sensorimotor cortex measured noninvasively with near-infrared optical imaging. Psychophysiology. 2003;40:548–560. doi: 10.1111/1469-8986.00057. [DOI] [PMC free article] [PubMed] [Google Scholar]
- Gratton G, Corballis PM. Removing the heart from the brain: compensation for the pulse artifact in the photon migration signal. Psychophysiology. 1995;32:292–299. doi: 10.1111/j.1469-8986.1995.tb02958.x. [DOI] [PubMed] [Google Scholar]
- Hespos S, Ferry A, Cannistraci C, Gore J, Park S. In: Imaging the brain with optical methods. Roe A, editor. Springer; New York: In press. [Google Scholar]
- Jasdzewski G, Strangman G, Wagner J, Kwong KK, Poldrack RA, Boas DA. Differences in the hemodynamic response to event-related motor and visual paradigms as measured by near-infrared spectroscopy. Neuroimage. 2003;20:479–488. doi: 10.1016/s1053-8119(03)00311-2. [DOI] [PubMed] [Google Scholar]
- Kolehmainen V, Prince S, Arridge SR, Kaipio JP. State-estimation approach to the nonstationary optical tomography problem. J Opt Soc Am A Opt Image Sci Vis. 2003;20:876–889. doi: 10.1364/josaa.20.000876. [DOI] [PubMed] [Google Scholar]
- Macwhinney B, Cohen J, Provost J. The PsyScope experiment-building system. Spat Vis. 1997;11:99–101. doi: 10.1163/156856897x00113. [DOI] [PubMed] [Google Scholar]
- Maki A, Yamashita Y, Watanabe E, Koizumi H. Visualizing human motor activity by using non-invasive optical topography. Front Med Biol Eng. 1996;7:285–297. [PubMed] [Google Scholar]
- McCormick PW, Stewart M, Goetting MG, Dujovny M, Lewis G, Ausman JI. Noninvasive cerebral optical spectroscopy for monitoring cerebral oxygen delivery and hemodynamics. Crit Care Med. 1991;19:89–97. doi: 10.1097/00003246-199101000-00020. [DOI] [PubMed] [Google Scholar]
- McCormick PW, Stewart M, Lewis G, Dujovny M, Ausman JI. Intracerebral penetration of infrared light. Technical note. J Neurosurg. 1992;76:315–318. doi: 10.3171/jns.1992.76.2.0315. [DOI] [PubMed] [Google Scholar]
- Meek JH, Firbank M, Elwell CE, Atkinson J, Braddick O, Wyatt JS. Regional hemodynamic responses to visual stimulation in awake infants. Pediatr Res. 1998;43:840–843. doi: 10.1203/00006450-199806000-00019. [DOI] [PubMed] [Google Scholar]
- Miki A, Nakajima T, Takagi M, Usui T, Abe H, Liu CS, Liu GT. Near-infrared spectroscopy of the visual cortex in unilateral optic neuritis. Am J Ophthalmol. 2005;139:353–356. doi: 10.1016/j.ajo.2004.07.042. [DOI] [PubMed] [Google Scholar]
- Morren G, Wolf U, Lemmerling P, Wolf M, Choi JH, Gratton E, De Lathauwer L, Van Huffel S. Detection of fast neuronal signals in the motor cortex from functional near infrared spectroscopy measurements using independent component analysis. Med Biol Eng Comput. 2004;42:92–99. doi: 10.1007/BF02351016. [DOI] [PubMed] [Google Scholar]
- Obrig H, Israel H, Kohl-Bareis M, Uludag K, Wenzel R, Muller B, Arnold G, Villringer A. Habituation of the visually evoked potential and its vascular response: implications for neurovascular coupling in the healthy adult. Neuroimage. 2002;17:1–18. doi: 10.1006/nimg.2002.1177. [DOI] [PubMed] [Google Scholar]
- Obrig H, Neufang M, Wenzel R, Kohl M, Steinbrink J, Einhaupl K, Villringer A. Spontaneous low frequency oscillations of cerebral hemodynamics and metabolism in human adults. NeuroImage. 2000;12:623–639. doi: 10.1006/nimg.2000.0657. [DOI] [PubMed] [Google Scholar]
- Oldfield RC. The assessment and analysis of handedness: the Edinburgh inventory. Neuropsychologia. 1971;9:97–113. doi: 10.1016/0028-3932(71)90067-4. [DOI] [PubMed] [Google Scholar]
- Prince S, Kolehmainen V, Kaipio JP, Franceschini MA, Boas D, Arridge SR. Time-series estimation of biological factors in optical diffusion tomography. Phys Med Biol. 2003;48:1491–1504. doi: 10.1088/0031-9155/48/11/301. [DOI] [PubMed] [Google Scholar]
- Saager RB, Berger AJ. Direct characterization and removal of interfering absorption trends in two-layer turbid media. Journal of the Optical Society of America A - Optics Image Science and Vision. 2005;22:1874–1882. doi: 10.1364/josaa.22.001874. [DOI] [PubMed] [Google Scholar]
- Schroeter ML, Zysset S, Kupka T, Kruggel F, Yves von Cramon D. Near-infrared spectroscopy can detect brain activity during a color-word matching Stroop task in an event-related design. Hum Brain Mapp. 2002;17:61–71. doi: 10.1002/hbm.10052. [DOI] [PMC free article] [PubMed] [Google Scholar]
- Sereno MI, Dale AM, Reppas JB, Kwong KK, Belliveau JW, Brady TJ, Rosen BR, Tootell RB. Borders of multiple visual areas in humans revealed by functional magnetic resonance imaging. Science (New York, NY. 1995;268:889–893. doi: 10.1126/science.7754376. [DOI] [PubMed] [Google Scholar]
- Steinbrink J, Kempf FC, Villringer A, Obrig H. The fast optical signal--robust or elusive when non-invasively measured in the human adult? Neuroimage. 2005;26:996–1008. doi: 10.1016/j.neuroimage.2005.03.006. [DOI] [PubMed] [Google Scholar]
- Strangman G, Franceschini MA, Boas DA. Factors affecting the accuracy of near-infrared spectroscopy concentration calculations for focal changes in oxygenation parameters. Neuroimage. 2003;18:865–879. doi: 10.1016/s1053-8119(03)00021-1. [DOI] [PubMed] [Google Scholar]
- Toronov V, Webb A, Choi JH, Wolf M, Michalos A, Gratton E, Hueber D. Investigation of human brain hemodynamics by simultaneous near-infrared spectroscopy and functional magnetic resonance imaging. Med Phys. 2001;28:521–527. doi: 10.1118/1.1354627. [DOI] [PubMed] [Google Scholar]
- Toronov VY, Zhang X, Webb AG. A spatial and temporal comparison of hemodynamic signals measured using optical and functional magnetic resonance imaging during activation in the human primary visual cortex. Neuroimage. 2007;34:1136–1148. doi: 10.1016/j.neuroimage.2006.08.048. [DOI] [PMC free article] [PubMed] [Google Scholar]
- Villringer A, Chance B. Non-invasive optical spectroscopy and imaging of human brain function. Trends Neurosci. 1997;20:435–442. doi: 10.1016/s0166-2236(97)01132-6. [DOI] [PubMed] [Google Scholar]
- Villringer A, Planck J, Hock C, Schleinkofer L, Dirnagl U. Near infrared spectroscopy (NIRS): a new tool to study hemodynamic changes during activation of brain function in human adults. Neurosci Lett. 1993;154:101–104. doi: 10.1016/0304-3940(93)90181-j. [DOI] [PubMed] [Google Scholar]
- Watanabe E, Maki A, Kawaguchi F, Takashiro K, Yamashita Y, Koizumi H, Mayanagi Y. Non-invasive assessment of language dominance with near-infrared spectroscopic mapping. Neurosci Lett. 1998;256:49–52. doi: 10.1016/s0304-3940(98)00754-x. [DOI] [PubMed] [Google Scholar]
- Wilcox T, Bortfeld H, Woods R, Wruck E, Boas DA. Using near-infrared spectroscopy to assess neural activation during object processing in infants. J Biomed Opt. 2005;10:11010. doi: 10.1117/1.1852551. [DOI] [PMC free article] [PubMed] [Google Scholar]
- Zeff BW, White BR, Dehghani H, Schlaggar BL, Culver JP. Retinotopic mapping of adult human visual cortex with high-density diffuse optical tomography. Proc Natl Acad Sci U S A. 2007;104:12169–12174. doi: 10.1073/pnas.0611266104. [DOI] [PMC free article] [PubMed] [Google Scholar]
- Zhang Q, Brown EN, Strangman GE. Adaptive Filtering for Global Interference Cancellation and Real Time Recovery of Evoked Brain Activity: A Monte Carlo Simulation Study. Journal of Biomedical Optics. 2007a;12:044014. doi: 10.1117/1.2754714. [DOI] [PubMed] [Google Scholar]
- Zhang Q, Brown EN, Strangman GE. Adaptive filtering to reduce global interference in evoked brain activity detection: A human subject case study. Journal of Biomedical Optics. 2007b;2007:064009. doi: 10.1117/1.2804706. [DOI] [PubMed] [Google Scholar]
- Zhang Q, Brukilacchio TJ, Gaudett T, Wang L, Li A, Boas DA. Experimental comparison of using continuous-wave and frequency-domain diffuse optical imaging systems to detect heterogeneities. Optical Tomography and Spectroscopy of Tissue IV, San Jose 2001 [Google Scholar]
- Zhang YH, Brooks DH, Franceschini MA, Boas DA. Eigenvector-based spatial filtering for reduction of physiological interference in diffuse optical imaging. Journal of Biomedical Optics. 2005;10 doi: 10.1117/1.1852552. [DOI] [PubMed] [Google Scholar]