Abstract
Electron spin-lattice relaxation rates, 1/T1, at X-band of nitroxyl radicals (4-hydroxy-2,2,6,6-tetramethylpiperidin-1-oxyl, 4-oxo-2,2,6,6-tetramethylpiperidin-1-oxyl, 3-carbamoyl-2,2,5,5-tetramethylpyrrolidin-1-oxyl and 3-carbamoyl-2,2,5,5-tetramethylpyrrolin-1-oxyl) in glass-forming solvents (decalin, glycerol, 3-methylpentane, o-terphenyl, 1-propanol, sorbitol, sucrose octaacetate, and 1:1 water:glycerol) at temperatures between 100 K and 300 K were measured by long-pulse saturation recovery to investigate the relaxation processes in slow-to-fast tumbling regimes. A subset of samples was also studied at lower temperatures or at Q-band. Tumbling correlation times were calculated from continuous wave lineshapes. Temperature dependence and isotope substitution (2H and 15N) were used to distinguish the contributions of various processes. Below about 100 K relaxation is dominated by the Raman process. At higher temperatures, but below the glass transition temperature, a local mode process makes significant contributions. Above the glass transition temperature, increased rates of molecular tumbling modulate nuclear hyperfine and g anisotropy. The contribution from spin rotation is very small. Relaxation rates at X-band and Q-band are similar. The dependence of 1/T1 on tumbling correlation times fits better with the Cole-Davidson spectral density function than with the Bloembergen-Purcell-Pound model.
Keywords: Cole-Davidson spectral density function, nitroxyl radical, spin-lattice relaxation, tumbling
1 Introduction
The widespread use of nitroxyl radicals as probes of motion, local environment, and distance between sites in proteins has led to detailed studies of their properties [1-4]. Although spin-spin relaxation rates have been extensively studied [5, 6], less is known about spin-lattice relaxation rates [7-9]. Raman and local mode processes have been shown to contribute to spin-lattice relaxation of nitroxyl radicals at X- and Q-band in glasses with melting points or glass transition temperatures above room temperature. In sucrose octaacetate or sorbitol glasses the contributions from these two processes, which modulate spin-orbit coupling, are correlated [10].
The Raman process is a two-phonon process in which the energy to be transferred to the lattice is the difference between the energies absorbed and emitted for a virtual excited state at an energy less than the Debye temperature [11]. The temperature dependence of the Raman process is given by Eq. (1).
| (1) |
where θD is the Debye temperature and J8 is the transport integral, . The coefficient CRam depends upon the spin-orbit coupling, the solvent, and the size of the solute [10]. In the high-temperature limit the expression for the Raman process reduces to
| (2) |
Although the concept of the Raman process was developed for an ionic lattice, its characteristic temperature dependence has been observed for many molecular systems including organic radicals in glassy solvents [7, 10].
The local mode [11, 12] is also a two-phonon process, but unlike the Raman process it involves a vibrational frequency that is above the Debye temperature. The temperature dependence of the contribution to relaxation from a local mode is given by Eq. (3).
| (3) |
where Clocal is the coefficient for the contribution, and Δloc is the energy for the local mode in Kelvin. This process is independent of Zeeman frequency.
As a glassy matrix softens, the rate of molecular tumbling increases and tumbling-dependent processes contribute to the relaxation. The contribution to spin-lattice relaxation due to spin rotation is given by Eq. (4) [13].
| (4) |
where τR is the tumbling correlation time.
The contribution to spin-lattice relaxation due to modulation of g and A anisotropy by molecular tumbling has been described by [8, 9, 14-16]
| (5) |
| (6) |
| (7) |
Δg = gzz − 0.5(gxx+gyx), δg = 0.5(gxx-gyy), Ai is a component of the nitrogen nuclear hyperfine coupling, Ā is the average nitrogen hyperfine coupling, and I is the nitrogen nuclear spin.
J(ω) is the spectral density of the solute motion and the Fourier transform of the correlation function C(t). In prior studies of nitroxyl spin-lattice relaxation [8, 14, 15] the Bloembergen-Pound-Purcell (BPP) model for the spectral density function, Eq. (8), was used.
| (8) |
The BPP function assumes that the reorientational motions are stochastic and that only one ensemble of reorienting units is present. The BPP correlation function is an exponential [17].
The Cole-Davidson spectral density function (Eq. 9) was developed in studies of dielectric relaxation [18].
| (9) |
where β characterizes the distribution of correlation times. The smaller the value of β, the wider the distribution. For β = 1, JCD(ω) reduces to JBPP(ω). The Cole-Davidson spectral density model has been applied to NMR and dielectric relaxation [19-21], in which the spectral density of solvent molecules is monitored. However, in an EPR experiment the solute motion is monitored. An EPR study of the temperature dependence of linewidths for tempone-d16 in toluene used a Cole-Davidson spectral density function [22].
An additional contribution to spin-lattice relaxation from ‘general spin diffusion’ has been proposed to arise from modulation of electron-nuclear spin interaction [9]. This process has a weaker dependence on tumbling correlation time than the modulation of nitrogen nuclear hyperfine, and is frequency dependent.
Nitroxyl relaxation rates in fluid solution are described with functions that depend both on temperature and tumbling correlation times. In a recent study of nitroxyl relaxation the viscosity of the solution was varied to permit characterization of the relaxation rates at room temperature at three microwave frequencies. By holding the temperature constant the contribution from the local mode was constant [8]. Those studies demonstrated the importance of modulation of g and A anisotropy. However, to obtain a wide range of tumbling correlation times the solvent and structure of the radical were varied, which complicates interpretation of the results. In another study, tumbling correlation times were varied by changing the size of doxyl radicals in lipids and relaxation rates were measured as a function of Zeeman frequency [23]. It was proposed that modulation of g- and A-anisotropy, spin rotation, and generalized spin diffusion were required to model the relaxation rates [9]. In the studies reported here, temperature was varied and the dependence of tumbling correlation time on temperature was measured to permit modeling of relaxation rates as a function of both temperature and tumbling.
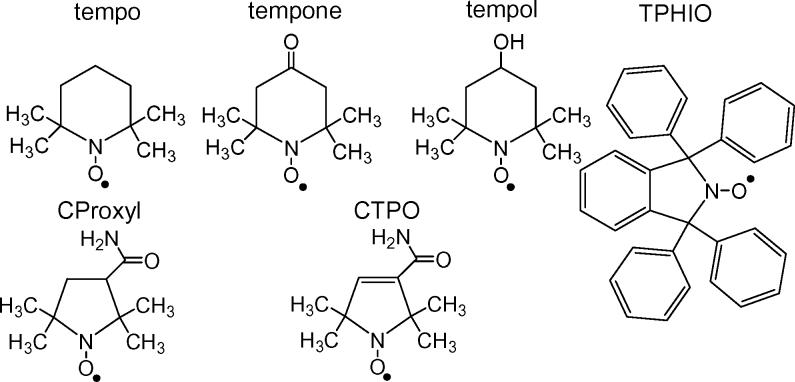
The experiments reported in this paper were designed to examine the tumbling-dependent contributions to relaxation for the 6 nitroxyl radicals shown in Figure 1. To separate the contributions from the Raman and local mode processes from contributions that depend on tumbling correlation time, solvents were selected with different glass transition temperatures (Tg) and therefore with different temperatures for the onset of tumbling-dependent processes. Isotope substitution (2H and 15N) also was used to distinguish between processes.
Figure 1.
Structures of the nitroxyls studied.
2 Experimental Methods
2,2,6,6-Tetramethylpiperidin-1-oxyl (tempo), 4-hydroxy-2,2,6,6-tetramethylpiperidin-1-oxyl (tempol), 4-oxo-2,2,6,6-tetramethylpiperidin-1-oxyl (tempone) (Aldrich Chemical Co.); 3-carbamoyl-2,2,5,5-tetramethylpyrrolidin-1-oxyl (CPROXYL), 3-carbamoyl-2,2,5,5-tetramethylpyrrolin-1-oxyl (CTPO) (Eastman Kodak Co.); 15N-tempone, tempone-d16, tempol-d17 , and 15N-tempol-d17 (CDN Isotope) were used as received. TPHIO was prepared as reported in ref. [10]. 3-Methylpentane was Aldrich reagent grade and glycerol was Aldrich anhydrous grade. Decalin and 1-propanol were purchased from City Chemical Corporation and Mallinkrodt Chemical, respectively. o-Terphenyl (OTP) was purified by recrystallization twice from ethanol. 1:1 Water:glycerol, by volume, was prepared gravimetrically.
When glycerol or 1:1 water:glycerol was the solvent, the samples (1.0 mM) were contained in thin-wall Teflon tubes with 0.97 mm i.d. The Teflon tube was supported in a 4 mm o.d. quartz tube. To remove oxygen from the solutions, nitrogen gas was passed over the sample via a thin Teflon tube positioned in the quartz tube alongside the sample-containing Teflon tube. When 3-methylpentane, decalin, OTP, or 1-propanol was used as the solvent, nitroxyl concentration was 0.1 to 1.0 mM; samples were contained in 4 mm o.d. quartz tubes and degassed by freeze-pump thaw. Samples in sorbitol (Aldrich Chemical Co.) or sucrose octaacetate (Aldrich Chemical Co.) were prepared by grinding solid mixtures prior to putting the solid in an EPR tube. The tube was then evacuated and evacuation was continued during the melting. Tubes were flame-sealed.
X-band CW spectra were recorded on a Varian E9 with a rectangular resonator or in the CW mode of the X-band SR spectrometer [24]. The g-value standard was DPPH (g = 2.0036) [25]. SR experiments at lower temperatures and for longer relaxation times were performed with a rectangular resonator. For higher temperatures and shorter relaxation times a loop-gap resonator (LGR) for 4 mm o.d. tubes was used [26]. The Q of this resonator is about 1000. To continuously monitor approximate sample temperatures a thermocouple was affixed to the shield of the LGR or positioned above the active volume of the cavity. To more precisely measure the temperature of the samples in 0.97 mm i.d. Teflon tubing, a thermocouple supported in a thin Teflon tube was positioned alongside the sample immediately before and after each T1 measurement. For samples in 4 mm OD tubes, the sample tube was replaced with a 4 mm o.d. quartz tube containing a thermocouple immersed in a 2.5 mm high column of decalin, immediately after each measurement. Q-band SR measurements were made on a Bruker E580 with a SuperQFT bridge, an ER5107D2 dielectric resonator, and an Oxford ESR935 cryostat with cernox sensor adjacent to the resonator.
Recovery curves were recorded at the position of maximum intensity in the nitroxyl absorption spectrum. Values of T1 were obtained by fitting a single exponential to the experimental curves. Below Tg a single exponential was not a good fit to the data because of overlapping contributions from molecules with different orientations with respect to the external magnetic field [27]. Although improved fits to the curves could be obtained as the sums of multiple exponentials or a distribution of exponentials, the single exponential fits provide an adequate single-parameter representation of trends. At temperatures where tumbling is fast enough to impact the CW spectra and contribute to spin-lattice relaxation, a single exponential gave a good fit to the experimental curves for most radical/solvent combinations. Fitting to a single exponential did not work well for the SR responses in 3-methylpentane, which is attributed to the dynamic effects of methyl group rotation at rates comparable to the electron-proton couplings. At temperatures where T1 is less than about 2 μs, single exponentials did not fit well to many of the experimental data sets. This non-exponential behavior was attributed to residual contributions from the FID that were not cancelled completely by the phase cycling and to incomplete subtraction of off-resonance instrumental artifacts [28]. These artifacts tended to make the apparent value of T1 at fast tumbling correlation times appear to be longer than the true value. For these cases values of T1 were calculated by omitting the early-time data that were judged to be contaminated by artifacts. The shortest T1 values included in this study were about 1 μs.
2.1 Determination of Nitroxyl Tumbling Correlation Times
For each of the nitroxyl/solvent combinations the tumbling correlation times as a function of temperature were determined by simulation of X-band CW spectra using the NLSL program of Budil et al, which is based on the expressions derived by Freed and co-workers [5, 29]. The g-values and A-values required for the NLSL simulations were determined from the glassy solution spectra using locally written software. Values of gzz and Azz are readily determined. At X-band the values of Axx, Ayy, gxx, and gyy are harder to evaluate. Values of these parameters were constrained by requiring that the average g and A values agree with the isotropic g and A values for rapid tumbling spectra. The resulting g values are: tempone, CPROXYL, CTPO, and TPHIO in all solvents; gxx = 2.0090, gyy = 2.0058, gzz = 2.0020; tempol in polar solvents; gxx = 2.0103, gyy = 2.0067, gzz = 2.0032 [8]. Values of hyperfine couplings are solvent dependent and weakly dependent on temperature. For some of the combinations of nitroxyl and solvent the spectra could not be fitted with isotropic rotation, but could be fitted with axial rotation. The x-axis and z-axis are along the direction of the N-O bond and along the π orbital of nitrogen, respectively, and these were defined as the axes for R⊥ [30]. The tumbling correlation times for these cases were calculated as .
2.2 Modeling the Temperature Dependence of 1/T1
Values of 1/T1 as a function of temperature were modeled as the sum of contributions from the Raman process (Eq. 1 or Eq. 2), local mode (Eq. 3), spin rotation (Eq. 4), and modulation of g and A anisotropy by molecular tumbling (Eq. 5).
| (10) |
To separate the contributions of the Raman and local mode processes, 1/T1 in some solvent-solute combinations was examined in the temperature range between about 20 K and the glass transition temperature. In the analysis of these data the full form of the equation for the Raman process (Eq. 1) was used, which involves a two-parameter fit in the Debye temperature and the coefficient CRam. For comparison with other data sets the corresponding value of (Eq. 2) that applies in the high temperature limits was calculated and listed in Table 1. For most solvent-solute combinations relaxation rates were analyzed at temperatures above 100 K, where Eq. (2) describes the Raman process. This equation has the advantage that it includes a single adjustable parameter. For most solvents there was no indication of a change in at Tg, but for water:glycerol there was a change of about 10%. Values of the parameters that were used to model the temperature dependence of 1/T1 are summarized in Table 1.
Table 1.
Parameters used for the simulations and theoretical values of CA,g.
| solute | solvent | C″Ram | Clocal | Δlocal | βa | CA,g | CA,gb | βc | CA,g (theory) | Ratioh |
|---|---|---|---|---|---|---|---|---|---|---|
| ×106 | (K) | ×1016 | β=0.67 | ×1016 | ||||||
| tempone | glycerol | 0.57 | 3.7 | 1090 | 0.61 | 7.1 | 8.1 | 9.3 | 0.86 | |
| tempone | WGf | 0.57d | 3.5 | 1090 | 0.66 | 7.5 | 7.6 | 0.64 | 9.3 | 0.82 |
| 15N-tempone | WGf | 0.57d | 3.5 | 1090 | 0.66 | 6.2 | 6.3 | 0.63 | 7.0 | 0.90 |
| tempone-d16 | WGf | 0.51d | 3.4 | 1200 | 0.63 | 7.1 | 7.7 | 0.62 | 9.3 | 0.82 |
| tempol | WGf | 0.38d | 3.5 | 1180 | 0.71 | 9.8 | 9.0 | 0.64 | 9.3 | 0.97 |
| tempol-d17 | WGf | 0.32d | 3.4 | 1250 | 0.72 | 8.8 | 8.0 | 0.64 | 9.3 | 0.86 |
| 15N-tempol-d17 | WGf | 0.31d | 3.4 | 1275 | 0.69 | 6.9 | 6.5 | 0.64 | 6.9 | 0.94 |
| CTPO | WGf | 0.35d | 3.5 | 1225 | 0.68 | 8.5 | 8.3 | 0.63 | 8.9 | 0.93 |
| CTPND | WGf | 0.34d | 3.5 | 1260 | 0.70 | 8.0 | 7.4 | 0.66 | 8.9 | 0.83 |
| tempo | 3-methyl-pentane | 0.79 | 3.5e | 958e | 0.61 | 10.0 | 9.2 | 1.08 | ||
| tempone | OTP | 1.17 | 4.1e | 990e | 0.37 | 11.8 | 9.2 | 1.28 | ||
| tempone | 1-propanol | 1.12 | 4e | 990e | 0.62 | 14. | 9.2 | 1.52 | ||
| tempone | decalin | 1.14 | 4.0e | 990e | 0.53 | 9.8 | 9.4 | 1.05 | ||
| tempone (Q)g | decalin | 1.14 | 4.0e | 990e | 0.53 | 58.0 | 14.4 | 4.02 | ||
| tempone-d16 | decalin | 0.98 | 3.3e | 1074e | 0.55 | 11.0 | 9.4 | 1.17 | ||
| 15N-tempone | decalin | 1.26 | 4.4e | 990e | 0.50 | 8.8 | 7.0 | 1.25 | ||
| TPHIO | decalin | 0.16 | 3.5e | 2050e | 0.53 | 4.5 | 7.7 | 0.59 | ||
| TPHIO (Q)g | decalin | 0.16 | 3.5e | 2050e | 0.53 | 15.6 | 12.7 | 1.23 |
β was estimated by simulation of all processes.
The average β = 0.67 for nitroxyl in water:glycerol was used for estimation of CA,g.
β estimated from the tumbling process (1/T1(water glycerol)-1/T1(glycerol)), as in Figure 9.
The value above the glass transition temperature.
Clocal and Δlocal for these solute/solvent combinations were estimated from nitroxyls in sucrose octaacetate.
WG is water:glycerol
Except for the rows identified with (Q), experiments were performed at X-band.
CA,g (experimental)/CA,g (theory) including β.
3 Results and Discussion
3.1 Nitroxyl Tumbling Correlation Times
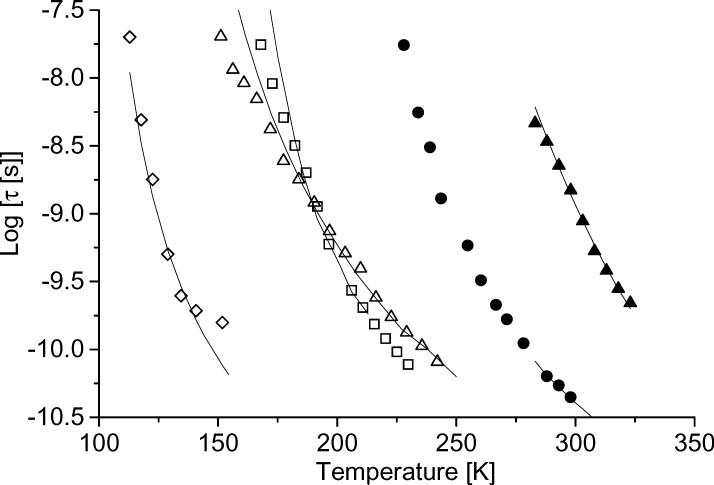
The tumbling correlation times calculated using NLSL for tempone and tempo in several solvents are shown in Figure 2. Literature values for the temperature dependence of solvent viscosity (decalin [31], glycerol [32], 1:1 water:glycerol [32], 3-methylpentane [33], and 1-propanol [34]) were used to calculate the tumbling correlation time, τ, based on the Stokes-Einstein equation (τ= cslip V η/kT, V = molecular volume, k = Boltzmann's constant). The slip coefficient, cslip, was adjusted to fit the experimental data. The volume was estimated from the molecular weight of a single molecule divided by 0.9g/cm3 which is a typical density for organic molecules. The values of cslip for tempone are: 0.024 for decalin, 0.02 for glycerol, 0.12 for water glycerol, and 0.09 for propanol. The cslip values are strongly dependent on the nitroxyl.
Figure 2.
Tumbling correlation times, τ, of tempo or tempone in several solvents as a function of temperature: (◇) tempo in 3-methylpentane, (△) tempone in 1-propanol, (□) tempone in decalin, (•) tempone-d16 in 1:1 water:glycerol, (▲) tempone in glycerol. The solid lines show the tumbling times calculated from the literature values of solvent viscosity using the Stokes-Einstein equation with temperature-independent slip coefficients (see text for details).
There is generally good agreement between trends in experimental values of τ and values of τ calculated from literature viscosity values (Figure 2). For tempone in 1-propanol or decalin agreement is reasonable for −8.5 >log(τ) > −10.5, but poorer for longer tumbling correlation times. A similar discrepancy was reported in supercooled molecular liquids [16, 35-38]. The slowest tumbling times are less temperature dependent than viscosity, which is attributed to partial decoupling from the host motion. Anisotropy in tumbling may also contribute to uncertainties in τ for the slower tumbling regimes. For tempo in 3-methylpentane, agreement is poorer for shorter tumbling correlation times (Figure 2). The rapid tumbling regime occurs at lower temperatures in 3-methylpentane than in other solvents studied and overlaps with the temperature range in which the rate of methyl rotation is comparable to the inequivalence in electron-coupling to the methyl protons [39, 40]. The dynamic averaging of proton couplings makes the linewidths and lineshapes temperature dependent and complicates calculations of τ.
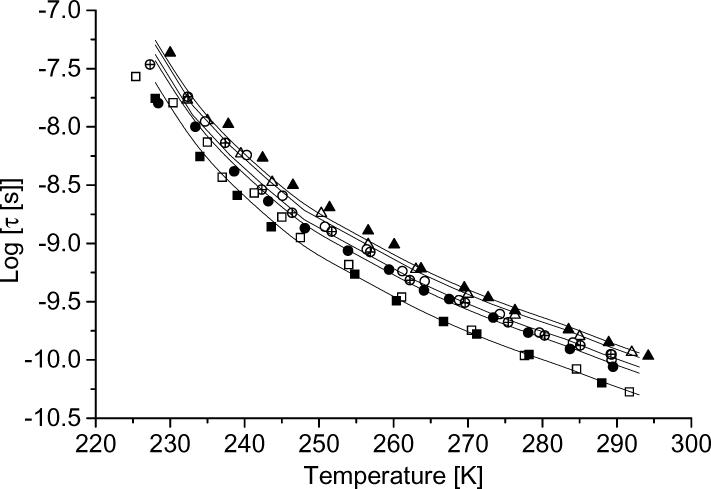
The temperature dependence of tumbling correlation times determined using NLSL for five nitroxyls in 1:1 water:glycerol is shown in Figure 3. Values of log(τ) > −8.5 are more uncertain and deviations between experimental and calculated values are larger than for faster tumbling (Figure 3). In water:glycerol τ decreases in the order CPROXYL (mw = 185) > CTPO (mw = 183) > tempol (mw = 172) > tempone (mw = 170), which reflects the effects of changes in molecular weight and in hydrogen bonding. In either water:glycerol or in decalin (data not shown) tumbling correlation times for tempone and tempone-d16 are similar, which is consistent with the expectation that deuteration does not impact τ because the primary factor for tumbling is molecular volume, rather than molecular mass. However, there was ∼10% difference between derived τ values for tempol and tempol-d17 in water:glycerol. The linewidths in the spectra of tempol are broader than for tempone and are substantially broader for tempol than for tempol-d17 and 15N-tempol-d17, which may introduce systematic errors in the calculation of τ. The average τ values obtained for tempol-d17 and 15N-tempol-d17 were used in the analysis of the dependence of 1/T1 on tumbling. The points in Figure 3 are experimental values, which were obtained at different temperatures for different samples. To permit calculations of 1/T1 as a function of τ at temperatures that are the same for different radicals (but different from the temperatures at which τ was measured), the solid line through the data was calculated at 5 K intervals with the assumption that the Stokes-Einstein equation is obeyed.
Figure 3.
Tumbling correlation times for (■) tempone, (□) tempone-d16, (•) tempol, (○) tempol-d17, (⊗) 15N-tempol-d17, (△) CTPO and(▲) CPROXYL in 1:1 water:glycerol mixtures as a function of temperature. The solid lines are interpolated between data points.
3.2 Temperature Dependence of 1/T1
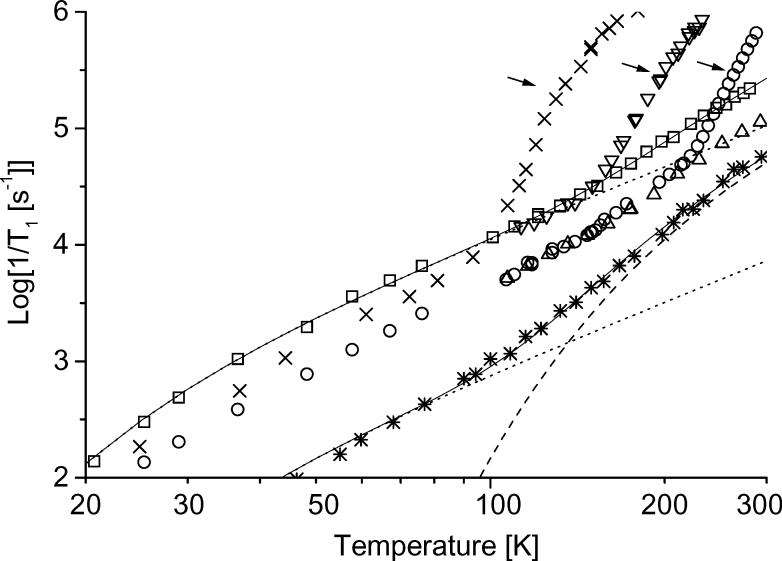
Spin-lattice relaxation rates, 1/T1, of tempone in several glassy matrices and trityl-CD3 in water:glycerol are plotted as a function of temperature in Figure 4. The values of 1/T1 are more strongly temperature dependent below about 100 K, which is approximately the Debye temperature, than at higher temperatures, which is consistent with the Raman process. Between about 100 K and the glass transition temperature the relaxation rates exhibit the approximately T2 dependence that is characteristic of the Raman process in the high temperature limit (Eq. 2). All of the data in sucrose octaacetate and sorbitol were obtained at temperatures where CW spectra indicate slow tumbling, so the dominant contributions to 1/T1 are the Raman and local mode processes. Above about 100 K for 3-methylpentane, 143 K for decalin, and 215 K for water:glycerol 1/T1 becomes more strongly temperature dependent. These temperatures are slightly above the glass transition temperatures (80 K for 3-methylpentane [33], 135 K for decalin [41], and ∼175 K for 1:1 water:glycerol [19, 42]). Above these temperatures the solvent mixtures become more lossy, the EPR lineshapes are strongly temperature dependent, and Azz becomes more temperature dependent, as expected in the regime where the glass is softening and tumbling rates are changing rapidly with temperature. The focus of this study is on the nitroxyl relaxation processes at these transition temperatures and above.
Figure 4.
Temperature dependence of 1/T1 for tempone in (▽) decalin, (□) sucrose octaacetate, (○) 1:1 water:glycerol, (△) sorbitol, and (×) tempo in 3-methylpentane. Values of 1/T1 for (*) trityl-CD3 in water:glycerol (1:1) are included for comparison [43]. The solid lines are sums of the simulated contributions from the (...) Raman and (---) local mode processes. The arrows indicate the temperature regimes where the tumbling-dependent process dominates.
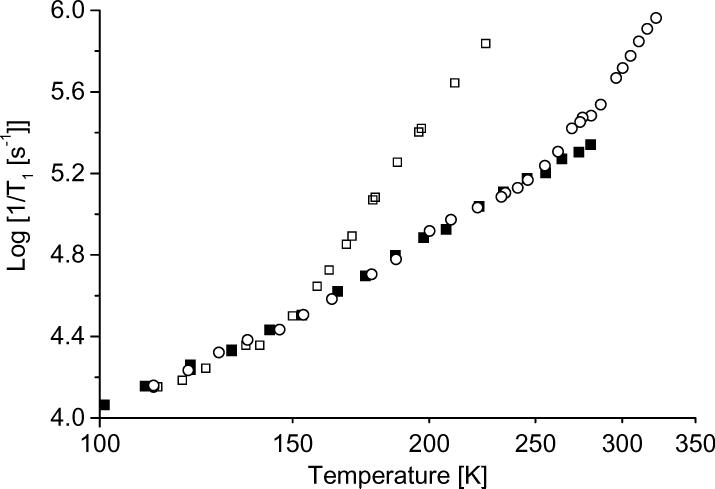
The relaxation rates for tempone in decalin, OTP, and sucrose octaacetate above 100 K are shown in more detail in Figure 5. The glass transition temperatures are much higher for OTP or sucrose octaacetate than for decalin, so between 100 and 300 K the tumbling-dependent process only makes a significant contribution in decalin. The similarity in the relaxation rates for tempone between 150 and 270 K in OTP and in sucrose octaacetate indicates that the contributions from the local mode and Raman process are very similar for tempone in these two low polarity solvents. This is the basis for the assumption in the data analysis that the contributions for the local mode and Raman process in low-polarity decalin are similar to what is observed in OTP or sucrose octaacetate.
Figure 5.
1/T1 at X-band for tempone in (□) decalin, (○) OTP, or (■) sucrose octaacetate.
The relaxation rates for trityl-CD3 in 1:1 water:glycerol (Figure 4) do not exhibit a change in slope at the glass transition temperature. Near Tg the local mode is the dominant contribution to relaxation for trityls. This contribution, and the underlying contribution from the Raman process, do not change at the glass transition. Unlike the nitroxyls, the contribution from the tumbling process to the relaxation of trityl-CD3 is not significant because of the small g and hyperfine anisotropy and the slow tumbling rates for the large molecule (mw = 1011) [43].
3.3 Isotope Effects on Relaxation
Isotope substitution provides a method to distinguish between relaxation processes. Since the ratio of magnetic moments of 1H/2H is 6.5, processes that depend on electron-nuclear dipolar interaction will decrease by a factor of 6.5 or 6.52 when 1H is replaced by 2H. For the contribution to 1/T1 due to modulation of nitrogen hyperfine anisotropy, the isotope effect depends both on nuclear spin I and on magnetic moment. 15N has a larger magnetic moment than 14N (μ14N/μ15N = 0.71), but the I (I+1) term in the coefficient offsets this difference so the ratio of the 14N/15N coefficients in Eq. 7 is (0.71)2 × I14N (I14N+1)/ I15N (I15N+1) = 1.4.
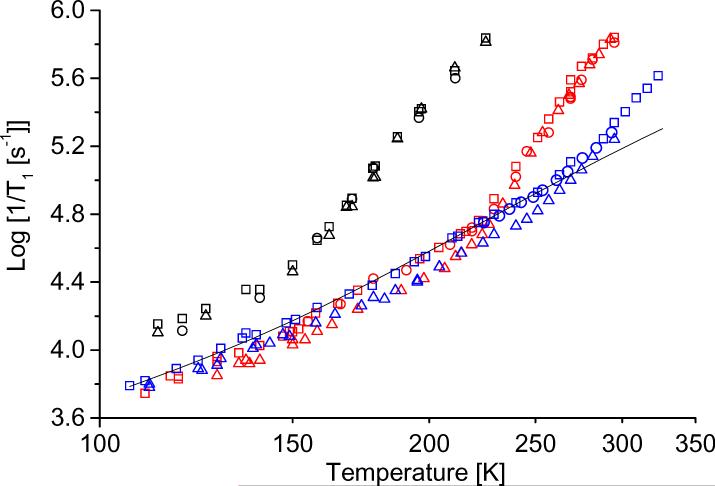
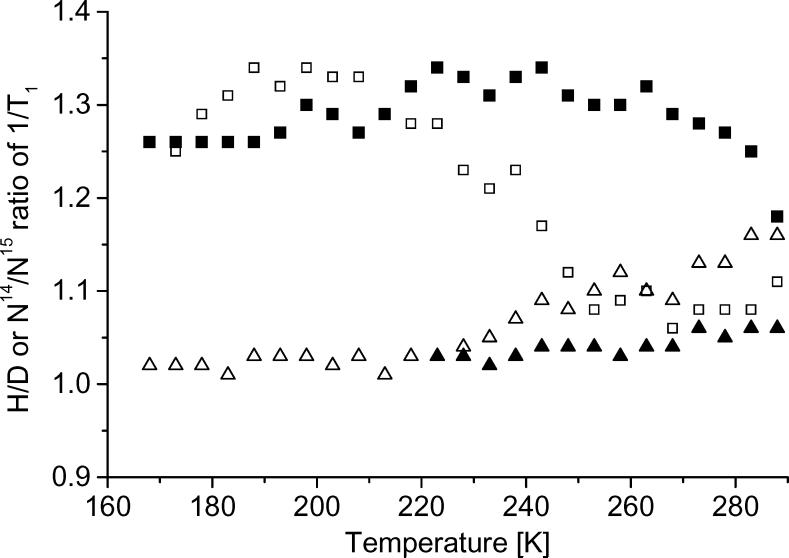
To characterize the effects of isotope substitution, spin-lattice relaxation rates were measured for tempone, tempone-d16, and 15N-tempone-d16 and for tempol, tempol-d17, and 15N-tempol-d17 (Figure 6). Rates for the isotopically substituted nitroxyls are similar to the normal isotope abundance analogs and there is no indication of an effect as large as the ratios of magnetic moments for H vs. D. To examine the isotope effects in more detail the ratios of 1/T1 for isotopically-substituted tempones in water:glycerol are shown in Figure 7. Tumbling rates in water:glycerol are about 100 times faster than in glycerol (Figure 3) so the tumbling-dependent process has much greater impact in water:glycerol than in glycerol. The ratio of values of 1/T1 for tempone and tempone-d16 is referred to as the H/D ratio and the ratio for tempone-d16/15N-tempone-d16 is denoted as the 14N/15N ratio. In glycerol between 180 and 280 K the H/D ratio is approximately constant at about 1.3 and the 14N/15N ratio is approximately 1. In water:glycerol below about 200 K the H/D and 14N/15N ratios are about the same as in glycerol. Above ∼200 K the H/D ratio decreases and the 14N/15N ratio increases as temperature increases. At temperatures above ∼200 K the tumbling rate is fast enough to cause readily observable changes in the nitroxyl lineshape. The changes in the isotope ratios indicate changes in the dominant relaxation processes as a function of tumbling. The temperature dependence of the isotope ratios for tempol is similar to those for tempone. Throughout the temperature range examined the H/D isotope effect is much smaller than predicted on the basis of dipole moments, which indicates that modulation of electron-proton dipolar interactions does not dominate relaxation. In the temperature regimes where the H/D ratio is about 1.3 the Raman and local mode processes dominate. The factor of 1.3 is about what is expected for the isotope effect on a vibration with a large C-H(D) contribution [8]. Increases in the 14N/15N ratio are indicative of increasing significance of processes that modulate the anisotropy of nitrogen hyperfine interaction.
Figure 6.
Temperature dependence of 1/T1 at X-band for (□) tempone, (△) tempone-d16, and (○) 15N-tempone-d16 in 1:1 water:glycerol (red symbols), glycerol (blue symbols) or decalin (black symbols), showing isotope effects. The solid line is the fitted line for the sum of the Raman and local mode processes.
Figure 7.
Temperature dependence of isotope effects on 1/T1 for isotopically-substituted tempone in glycerol and 1:1 water:glycerol. The (□) and (■) points are the H/D ratio in water glycerol and glycerol, respectively. The (△) and (▲) points are the 14N/15N ratio in water:glycerol and glycerol, respectively. Since the experimental data were recorded at different temperatures, interpolation was used to calculate 1/T1 at defined 5 K intervals and those interpolated values were used in the comparisons. Uncertainties in the ratios are about ±0.03.
3.4 Characterization of Processes that Depend on Molecular Tumbling
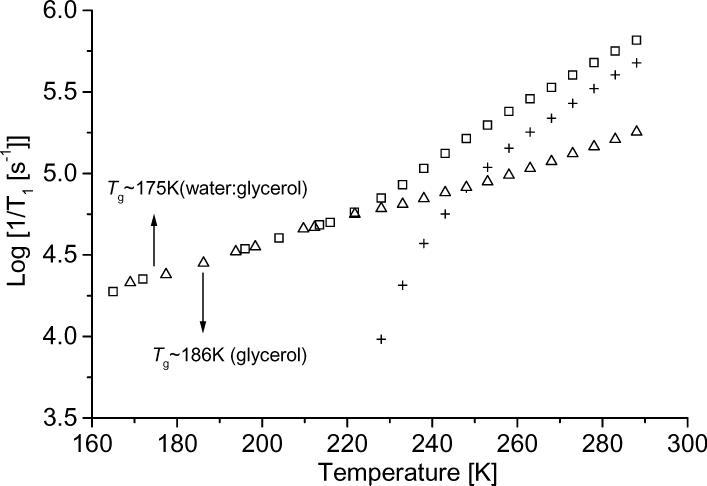
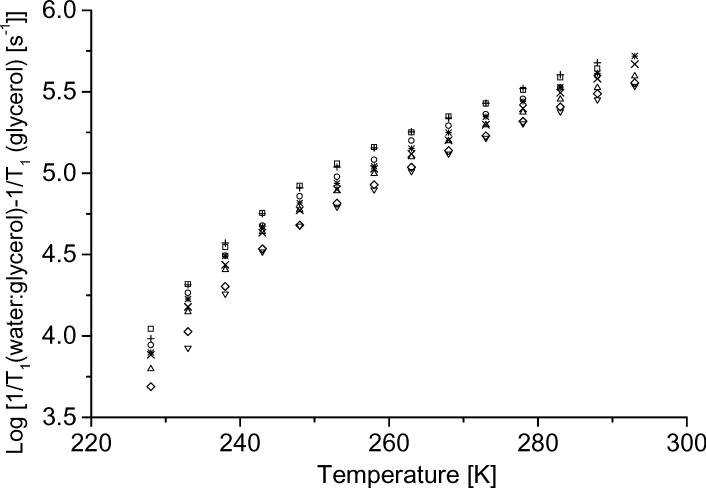
Since 1/T1 was similar in glycerol and 1:1 water:glycerol at temperatures where tumbling did not contribute to relaxation (Figure 8a), it was assumed that the contributions from the local and Raman processes would be the same in glycerol and water:glycerol at higher temperatures. Thus differences in 1/T1 between water:glycerol and glycerol were attributed to processes that depend on the rate of tumbling. Values of 1/T1 for tempone in water:glycerol and glycerol, and the tumbling-dependent contributions to relaxation [1/T1 (water:glycerol) − 1/T1 (glycerol)] are plotted as a function of temperature in Figure 8a. The subtractions were done over the range of temperatures for which it was possible to calculate tumbling correlation times from the CW lineshapes (Figure 3). To the extent that tumbling-dependent processes contribute to relaxation in glycerol solutions, subtraction of 1/T1 in glycerol from 1/T1 in water:glycerol will underestimate the contribution to relaxation from tumbling-dependent processes in water:glycerol. The tumbling-dependent contributions to relaxation for other nitroxyls were calculated analogously as the difference between rates in water:glycerol and glycerol and are shown in Figure 8b. The dependence of 1/T1 (water:glycerol) − 1/T1 (glycerol) on temperature (Figure 8b) is similar for each of the nitroxyls, which indicates that similar tumbling-dependent processes dominate. In Figure 8b the differences in relaxation rates are about the same for −H and −D, but differences in rates are larger for 14N than for 15N, which confirms the conclusion reached on the basis of the ratios of rates (Figure 7) that modulation of the nitrogen hyperfine anisotropy contributes to the tumbling-dependent process, but that there is negligible H/D isotope effect.
Figure 8.
Temperature dependence of (a) 1/T1 for (△) 14N tempone in glycerol and (□) water:glycerol and (+) the tumbling-dependent contribution to relaxation [1/T1 (water:glycerol) − 1/T1 (glycerol)] and (b) the tumbling-dependent contribution to relaxation [1/T1 (water:glycerol) − 1/T1 (glycerol)] for (+) 14N tempone, (○) 15N tempone, (□) tempone-d16, (*) tempol, (×) tempol-d17, (◇) 15N-tempol-d17, (△) CTPO and (▽) CPROXYL. Since experimental values in the glycerol and water:glycerol data sets were obtained at different temperatures, the points shown in the plot and used in the subtractions were linearly interpolated at 5 K intervals from the experimental data.
3.5 Spectral Density Function
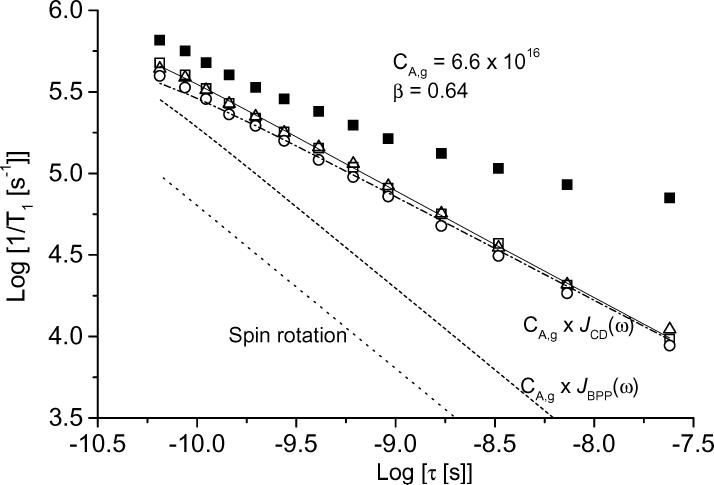
As discussed in the introduction, contributions to relaxation from molecular tumbling are described as the sum of spin rotation (Eq. 4) and modulation of g and A anisotropy (Eq. 5) [14, 15]. It was assumed that all of the temperature dependence for the tumbling-dependent contributions to the relaxation is reflected in the temperature dependence of the experimentally-determined τ values. The contributions to relaxation from spin rotation were calculated using Eq. 4 and the same g values that were used in the NLSL simulations. Eq. 5 includes a spectral density function, J(ω). When the tumbling-dependent contributions to 1/T1 were calculated as a function of tumbling correlation time using Eq. 5 and the BPP spectral density function (Eq. 8), the slopes of the curves were much steeper than for the experimental rates (Figure 9). NMR relaxation studies in viscous solution indicate that 1/T1 may not follow the BPP spectral density [44, 45], which is attributed to a distribution of tumbling correlation times that can be modeled with a Cole-Davidson spectral density function (Eq. (9)) [18, 19, 22, 45].
Figure 9.
Dependence of 1/T1 in water:glycerol (■) and [1/T1 (water:glycerol) − 1/T1 (glycerol)] (open symbols) on tumbling correlation time between 228 and 288 K for (□) tempone, (△) tempone-d16 and (○) 15N-tempone. Lines show the contributions to relaxation from spin rotation (...), modulation of g and nitrogen hyperfine anisotropy calculated with a BPP spectral density function (- - -), modulation of g and nitrogen hyperfine anisotropy calculated with a Cole-Davidson spectral density function (_ ._ . _), and the total contribution for tempone from spin rotation and the Cole-Davidson spectral density model (____) .
The coefficient of the spectral density function (CA,g) in Eq. 5 and the value of β in Eq. 9 were adjusted to obtain the best fit to the data shown in Figure 9. The slope of the plot of log[(1/T1 (water:glycerol) − 1/T1 (glycerol)] vs. log(τ) equals β. The β values obtained by least-squares fitting of the difference curves (Table 1) are significantly different from β = 1, which is the β value for the BPP spectral density function. The coefficient of the Cole-Davidson spectral density function also was used to calculate the relaxation predicted with a BPP spectral density function (Figure 9).
3.6 Simulation of Temperature Dependence of 1/T1
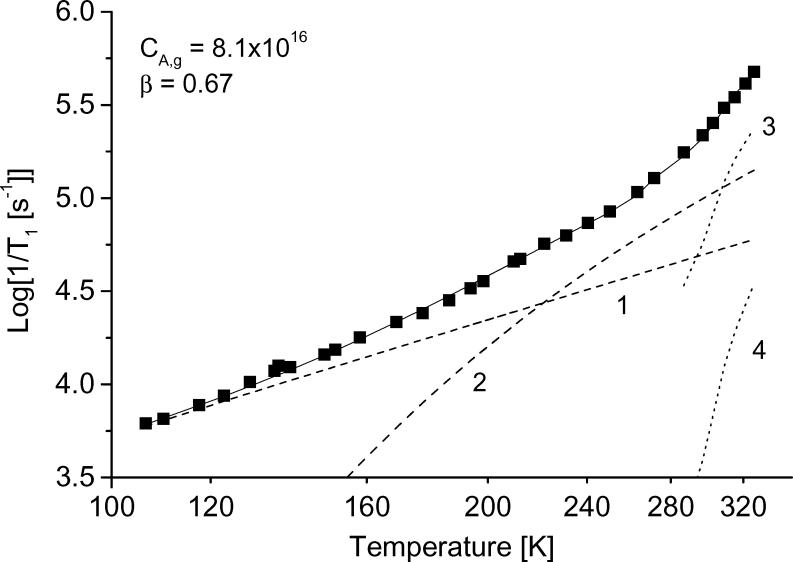
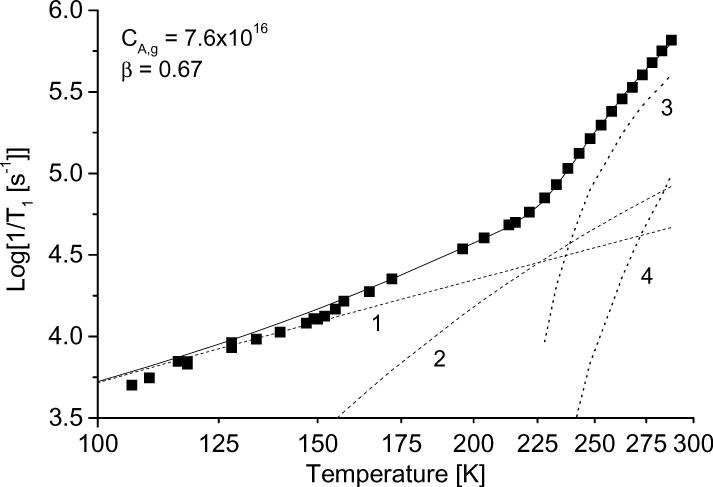
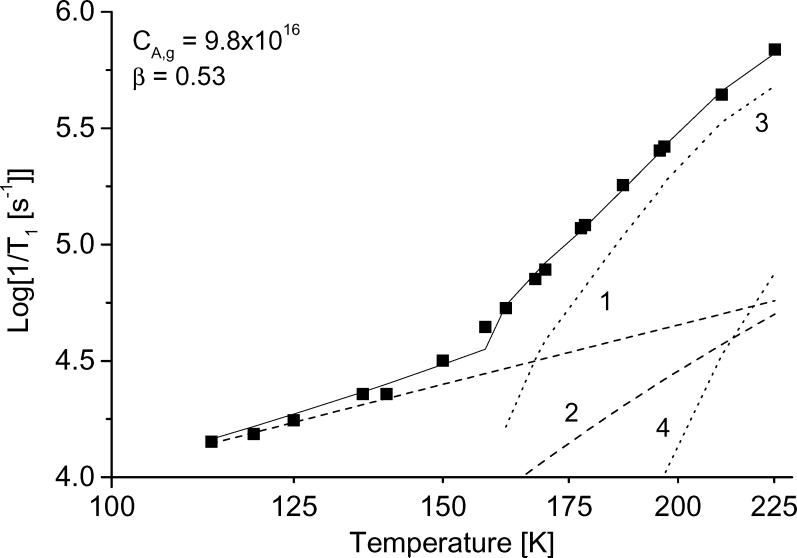
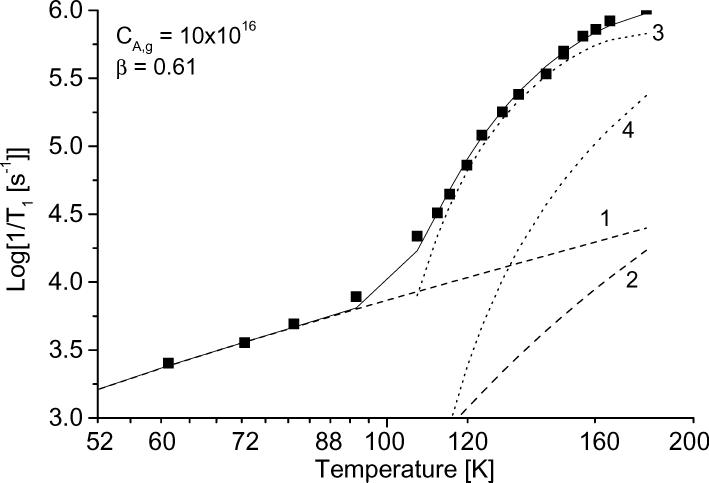
The temperature dependence of the relaxation rates was modeled as the sum of contributions. Figure 10 shows the results of the simulation for tempone in glycerol, water:glycerol, and decalin and for tempo in 3-methylpentane. The contributions from each of the individual processes also are shown. The parameters used for the simulations in Figure 10 are summarized in Table1, along with values for other combinations of nitroxyl and solvent. For all cases studied the contribution from spin rotation is very small. In decalin and 3-methylpentane, which have low glass transition temperatures, the contribution from the tumbling dependent process was significant at lower temperatures than in glycerol or water:glycerol. The contribution from the tumbling-dependent process was calculated only for temperatures in the range in which it was possible to determine τ from the CW lineshape, which resulted in an abrupt change in slope of the calculated lines in Fig. 10 c,d at the lowest temperature where the tumbling-dependent process was included in the simulation.
Figure 10.
Simulation of the temperature dependence of 1/T1 for (a) tempone in glycerol, (b) tempone in water:glycerol, (c) tempone in decalin, and (d) tempo in 3-methylpentane. The solid lines are the sum of contributions from the Raman process (dotted line 1), the local mode (dotted line 2), the modulation of A and g anisotropy (dotted line 3) and spin-rotation (dotted line 4). The parameters used to calculate the contributions from each process are listed in Table 1.
3.6.1 Raman process
The focus of this study is on relaxation rates at temperatures above about 100 K. In this temperature range the Raman process makes significant contributions at lower temperatures and longer τ values. The coefficient from the high-temperature limiting expression for the Raman process (Eq. (2)) was used to compare the dependence of the Raman process on solute and solvent because it reflects the effectiveness of the Raman process in a single variable, independent of the Debye temperature. Values of in 1:1 water glycerol decrease in the order tempone > tempol> CPROXY. In sucrose octaacetate decreases in the order tempone > tempol > CPROXY > TPHIO. An earlier study showed that 1/T1 for tempone at 100 K in a wide range of solvents was faster in solvents such as sucrose octaacetate, decalin, and toluene and slower in water:glycerol [27]. At this temperature a faster relaxation rate implies a larger value of . The trends show that there is more motion in softer glasses and for lower molecular weight solutes, and that these motions increase the effectiveness of the Raman process [10].
3.6.2 Local mode
The relative importance of the local mode increases as the temperature of the glass transition increases (Figure 8a, 10). In glycerol, water:glycerol, or OTP the glass softening temperatures are high enough that there is a well-defined temperature interval in which the contribution to relaxation from the local mode is readily distinguished from the Raman process that dominates at lower temperature and the tumbling-dependent processes that dominates at higher temperatures, so the parameters for the local mode could be determined directly. For decalin, 1-propanol and 3-methylpentane the glass softening temperatures are so low that there is not a well-defined temperature interval in which the local mode dominates. The following approach was used to estimate the contribution from the local mode in decalin, 1-propanol, and 3-methylpentane. Based on the similarity of the Raman process between these solvents and sucrose octaacetate (Figure 5), it was assumed that the contributions from the Raman and local mode processes in sucrose octaacetate could be scaled to match the data in the region where the Raman process dominates and the same scaling factor applied to the contribution from the local mode [10]. In decalin, 1-propanol, and 3-methylpentane the contribution from the local mode is smaller in the temperature regime studied, so the coefficients for the Raman and tumbling-dependent processes are only weakly dependent on the estimated contribution from the local mode.
There are two adjustable parameters in the fit function for the local mode: the energy, Δlocal, and the coefficient Clocal (Eq. 3), and the values obtained by fitting the data are correlated. Because of the overlapping contributions to the relaxation rates it is difficult to uniquely define the two parameters. In the fitting procedure the value of Clocal was constrained to be between 3.5×10⁶ and 4.5×10⁶ based on the values in sorbitol and sucrose octaacetate. The values of Δlocal were adjusted to match the experimental data. With the exception of TPHIO, the values of Δlocal show little variation, but the trend is toward higher values of Δlocal as the molar mass increases.
3.6.3 Tumbling-dependent processes
To find the coefficient CA,g and β for the Cole-Davidson spectral density function, the temperature dependence of 1/T1 was simulated for the full temperature range from glass to slow tumbling fluid, including the contributions from all processes. The coefficients for the Raman and local mode processes were determined in the temperature range where the tumbling processes made negligible contributions. Then, β and CA,g were adjusted to fit the data in the fast tumbling region, keeping Clocal and constant. The values of β obtained by adjusting independently for each data set and the resulting values of CA,g are shown in Table 1. In water:glycerol the β values were between 0.63 and 0.72 for the various isotopes of tempone and tempol and for CTPO. To determine the sensitivity of CA,g to the value of β, an average of β = 0.67 was used to recalculate CA,g for the water:glycerol solutions. The resulting values of CA,g are shown in a separate column in Table 1 and differ by up to 10%. The values of β calculated from 1/T1 (water:glycerol) − 1/T1 (glycerol) (Table 1) tend to be slightly smaller than the values obtained by simulation of the full temperature dependence of 1/T1 which suggests that subtraction of relaxation rates in glycerol may slightly over-estimate the contributions from the Raman and local mode processes.
Literature reports based on dielectric relaxation studies give β = 0.63 at T = −7.5 °C and T = −15.3 °C; β = 0.60 at T = −19.5 °C for water:glycerol mixtures (glycerol content; 50−100%) [46] and β = 0.6 at −40 °C > T > −65.5 °C for glycerol [18]. These values of β are similar to values for nitroxyl solutes in 1:1 water:glycerol (Table 1). There is little temperature dependence of the value of β[46], which suggests that the use of a temperature-independent value of β to analyze the nitroxyl relaxation rates does not introduce a large error. Literature values of β are 0.144 for decalin [41], 0.39 for 3-methylpentane [47], and 1.0 for 1-propanol [18]. The value of β for decalin is among the lowest for a molecular single component supercooled liquid [41]. These β values for the pure solvents are somewhat different from the values of β for the nitroxyl solutes.
An H/D isotope effect on 1/T1 was not observed for tempone in water:glycerol or decalin, consistent with the ratios of relaxation rates in the tumbling region shown in Figure 7. The coefficient CA,g for tempol was about 10 % different from that of tempol-d17, which is attributed to the differences in calculated τ. Based on the hypothesis that the tumbling times of tempol should be similar with or without deuterium, the tumbling times used for estimation for CA,g of tempol was the same as from tempol-d17. However, if the actual experimental tumbling times were used, there was no H/D isotope effect for tempol in water:glycerol. This comparison may indicate that the tumbling times of tempol and tempol-d17 are slightly different or that these differences are within the uncertainty of the data. These results demonstrate that within experimental uncertainty there is no H/D isotope effect on the tumbling-dependent contribution to the relaxation rates for nitroxyl radicals at X-band for η between 10−8 and 10−11 s.
3.7 Comparison of CA,g with Theory
The expected values of the coefficient CA,g (Eq. (5)) for nitroxyls were calculated from Eq. 5-7 and the experimental hyperfine and g-values. Most of the values agree well with the experimental results at X-band (Table 1). The deviation between experiment and theory for CA,g in 1-propanol and OTP are larger than in water:glycerol. The NLSL simulations of the CW lineshapes suggest some deviation from isotropic tumbling for these cases, which may contribute to the discrepancies. The rotation axis to average the larger nitrogen hyperfine Azz with the smaller components along the x and y axes, and thereby impact relaxation, is the x or y axis. The model for CA,g assumes isotropic rotation so anisotropic rotation would be a source of error.
The 14N/15N isotope effect on the contribution to relaxation due to modulation of nitrogen hyperfine anisotropy (Eq. (7)) is predicted to be 1.4. To decrease the impact of errors in τ, relaxation rates for 15N-tempone-d were compared with 14N-tempone-d16 and 15N-tempol-d17 was compared with 14N-tempol-d17. The same tumbling times were used for each nitrogen isotope since the molecular mass difference between them is less than 1%. The 14N/15N ratios for CA,g for tempone or tempol in water:glycerol are 1.2 or 1.3, respectively, which is close to the 1.3 predicted isotope ratio of CA,g for (Table 1). The slightly lower than expected ratio for tempone could result from underestimation of the contribution from the local mode process, underestimation of the spin-rotation term or imperfections in the theory.
For tempone and TPHIO in decalin there was less change in relaxation rate between X-band and Q-band than predicted by theory. The predicted frequency dependence comes from the spectral density function, the increasing importance of g anisotropy at higher fields/frequencies, and the frequency independence of the hyperfine interaction. The smaller than predicted frequency dependence could arise from inadequacies of the spectral density function or an additional contribution to the relaxation.
Robinson and co-workers suggested a contribution to nitroxyl spin lattice relaxation from generalized spin diffusion that involves modulation of the inter- or intra- molecular distance between the electron and a nuclear spin [9]. This process predicts substantial H/D isotope effects. Prior studies found no impact of solvent deuteration on nitroxyl relaxation in fluid solution at X- or S-band [8]. The present study found no evidence of an intramolecular H/D isotope effect, which indicates that a generalized spin diffusion contribution is not significant at X-band for the range of tumbling rates examined. By contrast a substantial H/D isotope effect was observed for spin-lattice relaxation of trityl-CD3 vs. trityl-CH3 and for solvent deuteration at 250 MHz [48]. The relaxation processes for the trityl radicals differ from that for the nitroxyls in two key respects: the modulation of a large anisotropic hyperfine interaction is not present and g values are closer to 2.0023 so spin-orbit coupling is smaller. Thus, the tumbling-dependent processes that dominate for the nitroxyls are not present for trityl. In addition, the H/D isotope effects on the trityl relaxation were much larger at 250 MHz than at X-band [48]. Further studies of nitroxyl relaxation rates will be needed to determine whether H/D isotope effects for nitroxyls are larger at lower frequencies.
4 Summary and Conclusions
Electron spin-lattice relaxation rates, 1/T1, for nitroxyl radicals in viscous solution were studied by long-pulse saturation recovery. Deuteration and nitrogen isotope substitutions of the nitroxyls helped to distinguish the contributions from the Raman process, local mode, and modulation of g and A anisotropy by tumbling. Tumbling correlation times as a function of temperature were obtained by analysis of the CW lineshapes. The Cole-Davidson spectral density function is in better agreement with the dependence of relaxation on tumbling correlation time than the commonly used Bloembergen-Pound-Purcell function.
Acknowledgments
Support from NIH NIBIB grant EB002807 (G.R.E. and S.S.E.) is gratefully acknowledged. SEB, JPB and ASM thank the Australian Research Council Centres of Excellence funding program CE0561607 for financial support.
Footnotes
Publisher's Disclaimer: This is a PDF file of an unedited manuscript that has been accepted for publication. As a service to our customers we are providing this early version of the manuscript. The manuscript will undergo copyediting, typesetting, and review of the resulting proof before it is published in its final citable form. Please note that during the production process errors may be discovered which could affect the content, and all legal disclaimers that apply to the journal pertain.
References
- 1.Berliner LJ. Spin Labeling: Theory and Applications. Academic Press; New York: 1976. [Google Scholar]
- 2.Berliner LJ. Spin Labeling II. Academic Press; New York: 1979. [Google Scholar]
- 3.Berliner LJ. Spin Labeling: The Next Millenium. Plenum; New York: 1998. [Google Scholar]
- 4.Berliner LJ, Eaton GR, Eaton SS. Distance Measurements in Biological Systems by EPR. Kluwer; New York: 2000. [Google Scholar]
- 5.Freed JH. Theory of slow tumbling ESR spectra of nitroxides. In: Berliner LJ, editor. Spin Labeling: Theory and Applications. Academic Press; New York: 1976. pp. 53–132. [Google Scholar]
- 6.Schneider DJ, Freed JH. In: Calculating slow motional magnetic resonance spectra: a user's guide, in Biol. Magn. Reson. L, Berliner J, Reuben J, editors. 1989. pp. 1–76. [Google Scholar]
- 7.Eaton SS, Eaton GR. Relaxation times of organic radicals and transition metal ions. Biol. Magn. Reson. 2000;19:29–154. [Google Scholar]
- 8.Owenius R, Terry GE, Williams MJ, Eaton SS, Eaton GR. Frequency Dependence of Electron Spin Relaxation of Nitroxyl Radicals in Fluid Solution. J. Phys. Chem. B. 2004;108:9475–9481. [Google Scholar]
- 9.Mailer C, Neilson RD, Robinson BH. Explanation of Spin-Lattice Relaxation Rates of Spin Labels Obtained with Multifrequency Saturation Recovery EPR. J. Phys. Chem. A. 2005;109:4049–4061. doi: 10.1021/jp044671l. [DOI] [PubMed] [Google Scholar]
- 10.Sato H, Kathirvelu V, Fielding AJ, Bottle SE, Blinco JP, Micallef AS, Eaton SS, Eaton GR. Impact of molecular size on electron spin relaxation rates of nitroxyl radicals in glassy solvents between 100 and 300 K. Mol. Phys. 2007 in press. [Google Scholar]
- 11.Murphy J. Spin-lattice relaxation due to local vibrations with temperature-independent amplitudes. Phys. Rev. 1966;145:241–247. [Google Scholar]
- 12.Castle JG, Jr., Feldman DW. Temperature dependence of paramagnetic relaxation at point defects in vitreous silica. J. Appl. Phys. 1965;36:124–128. [Google Scholar]
- 13.Atkins PW. Spin-Rotation Interaction, in Electron Spin Relaxation in Liquids. In: Muus LT, Atkins PW, editors. Plenum Press; New York: 1972. pp. 279–312. [Google Scholar]
- 14.Robinson BH, Haas DA, Mailer C. Molecular dynamics in liquids: spin-lattice relaxation of nitroxide spin labels. Science. 1994;263:490–493. doi: 10.1126/science.8290958. [DOI] [PubMed] [Google Scholar]
- 15.Robinson BH, Reese AW, Gibbons E, Mailer C. A unified description of the spin-spin and spin-lattice relaxation rates applied to nitroxide spin labels in viscous liquids. J. Phys. Chem. B. 1999;103:5881–5894. [Google Scholar]
- 16.Andreozzi L, Faetti M, Giordano M, Leporini D. Scaling of the rotational relaxation of tracers in o-terphenyl: a linear and nonlinear ESR study. J. Phys. Chem. B. 1999;103:4097–4103. [Google Scholar]
- 17.Bloembergen N, Purcell EM, Pound RV. Relaxation Effects in Nuclear Resonance Absorption. Phys. Rev. 1948;73:679–712. [Google Scholar]
- 18.Davidson N, Cole RH. Dielectric relaxation in glycerol, propylene glycol, and n-propanol. J. Chem. Phys. 1951;19:1484–1490. [Google Scholar]
- 19.Blochowicz T, Kudik A, Benkhof S, Senker J, Rossler E, Hinze G. The spectral density in simple organic glass formers: comparison of dielectric and spin-lattice relaxation. J. Chem. Phys. 1999;110:12011–12022. [Google Scholar]
- 20.Friedrich A, Doelle A, Zeidler MD. Reorientational dynamics of glycerol derived from temperature-dependent multi-nuclear magnetic resonance relaxation data. Magn. Reson. Chem. 2003;41:813–818. [Google Scholar]
- 21.Ueda T, Nakamura N. 1H MAS NMR study of local structure and dynamics of water molecule in (+−)-[Co(en)3]Cl3-nD2O. J. Phys. Chem. B. 2003;107:13681–13687. [Google Scholar]
- 22.Hwang JS, Al-Janavi YT. Frequency dependent study of the correlation functions in EPR spectroscopy - the Cole Davidson approach. 1. Perdeuterated 2,2,6,6-tetramethyl-4-piperidone N-oxide in toluene. Spect. Chim. Acta A. 2000;56:273–284. doi: 10.1016/s1386-1425(99)00238-3. [DOI] [PubMed] [Google Scholar]
- 23.Hyde JS, Yin J-J, Subczynski WK, Camenisch TG, Ratke JJ, Froncisz W. Spin-labeled EPR T1 Values Using Saturation Recovery from 2 to 35 GHz. J. Phys. Chem. B. 2004;108:9524–9529. [Google Scholar]
- 24.Quine RW, Eaton SS, Eaton GR. Saturation recovery electron paramagnetic resonance spectrometer. Rev. Sci. Instrum. 1992;63:4251–4262. doi: 10.1063/1.5043316. [DOI] [PMC free article] [PubMed] [Google Scholar]
- 25.Poole CP., Jr. Standard Samples and Numbers of Spins, in Electron Spin Resonance: A Comprehensive Treatise on Experimental Techniques. In: Poole CP Jr., editor. Dover; Mineola, N.Y.: 1983. p. 443. [Google Scholar]
- 26.Rinard GA, Quine RW, Eaton SS, Eaton GR, Froncisz W. Relative benefits of overcoupled resonators vs. inherently low-Q resonators for pulsed magnetic resonance. J. Magn. Reson. A. 1994;108:71–81. [Google Scholar]
- 27.Du J-L, Eaton GR, Eaton SS. Temperature, orientation, and solvent dependence of electron spin-lattice relaxation rates for nitroxyl radicals in glassy solvents and doped solids. J. Magn. Reson. A. 1995;115:213–221. [Google Scholar]
- 28.Kathirvelu V, Sato H, Quine RW, Rinard GA, Eaton SS, Eaton GR. EPR Free Induction Decay Coherence Observed after a Single-Pulse in Saturation Recovery Experiments for Samples with Resolved Multi-line CW Spectra. Appl. Magn. Reson. 2007;32:269–281. [Google Scholar]
- 29.Budil DE, Lee S, Saxena S, Freed JH. Nonlinear least-squares analysis of slow-motion EPR spectra in one and two dimensions using a modified Levenberg-Marquardt algorithm. J. Magn. Reson. A. 1996;120:155–189. [Google Scholar]
- 30.Lajzerowicz-Bonneteau J. In: Molecular structure of nitroxides. Spin Labeling: Theory and Applications. Berliner LJ, editor. Academic Press; N. Y.: 1975. pp. 239–249. [Google Scholar]
- 31.von Salis GA, Labhart H. Temperature dependence of the viscosity of organic glasses. J. Phys. Chem. 1968;72:752–754. [Google Scholar]
- 32.Chen YM, Pearlstein AJ. Viscosity-temperature correlation for glycerol-water solutions. Indust. & Engin. Chem. Res. 1987;26:1670–1672. [Google Scholar]
- 33.Ruth AA, Nickel B, Lesche H. Temperature dependence of viscosity and density of glass-forming alkanes. Zeit. fur Phys. Chem. 1992;175:91–108. [Google Scholar]
- 34.Ruth AA, Lesche H, Nickel B. Temperature dependence of viscosity and density of cis-1,4/trans-1,3-dimethylcyclohexand and several other commonly used organic solvents. Zeit. fur Phys. Chem. 2003;217:707–722. [Google Scholar]
- 35.Andreozzi L, Faetti M, Hvala M, Giordana M. Short-time rotational relaxation in supercooled and glassy o-terphenyl: a nonlinear electron spin resonance study by using molecular probes with different symmetries. Philosph. Mag. B. 1999;79:1993–2003. [Google Scholar]
- 36.Roessler E. Indications for a change of diffusion mechanism in supercooled liquids. Phys. Rev. Lett. 1990;65:1595–1598. doi: 10.1103/PhysRevLett.65.1595. [DOI] [PubMed] [Google Scholar]
- 37.Heuberger G, Sillescu H. Size dependence of tracer diffusion in supercooled liquids. J. Phys. Chem. 1996;100:15255–15260. [Google Scholar]
- 38.Andreozzi L, Faetti M, Giordano M. On the scaling in the rotational dynamics of molecular probes in salol and ortho-terphenyl: a possible role of the energy landscape basins. J. Phys. Condens. Matter. 2005;18:931–940. [Google Scholar]
- 39.Shushkakov OA, Dzuba SA, Tsvetkov YD. Barriers for internal rotation of methyl groups screening nitroxide paramagnetic fragments as determined by an electron spin-echo technique. J. Struct. Chem. 1989;30:75–80. [Google Scholar]
- 40.Nakagawa K, Candelaria MB, Chik WWC, Eaton SS, Eaton GR. Electron-spin relaxation times of chromium(V) J. Magn. Reson. 1992;98:81–91. [Google Scholar]
- 41.Duvvuri K, Richert R. Dynamics of glass-forming liquids. VI. Dielectric relaxation study of neat decahydro-naphthalene. J. Chem. Phys. 2002;117:4414–4418. [Google Scholar]
- 42.Murphy SSN. Experimental study of the dynamics of water and the phase behavior of the supercooled aqueous solutions of propylene glycol, glycerol, poly(ethylene glycol)s and poly(vinylpyrrolidone) J. Phys. Chem. B. 2000;104:6955–6962. [Google Scholar]
- 43.Yong L, Harbridge J, Quine RW, Rinard GA, Eaton SS, Eaton GR, Mailer C, Barth E, Halpern HJ. Electron Spin Relaxation of Triarylmethyl Radicals in Fluid Solution. J. Magn. Reson. 2001;152:156–161. doi: 10.1006/jmre.2001.2379. [DOI] [PubMed] [Google Scholar]
- 44.Colmenero J, Alegria A, Alberdi JM, Alvarez F, Frick B. Dynamics of the a relaxation of α glass-forming polymeric system: dielectric, mechanical, nuclear-magnetic-resonance, and neutron-scattering studies. Phys. Rev. B. Cond. Matt. Mat. Phys. 1991;44:7321–7329. doi: 10.1103/physrevb.44.7321. [DOI] [PubMed] [Google Scholar]
- 45.Doelle A. Reorientational dynamics of the model compound 1,2,3,4-tetrahydro-5,6-dimethyl-1,4-methanonaphthalene in neat liquid from temperature-dependent 13C nuclear magnetic relaxation data: spectral densities and correlation functions. J. Phys. Chem. A. 2002;106:11683–11694. [Google Scholar]
- 46.McDuffie GE, Jr., Quinn RG, Litovitz TA. Dielectric properties of glycerol-water mixtures. J. Chem. Phys. 1962;37:239–242. [Google Scholar]
- 47.Shahriari S, Mandanici A, Wang L-M, Richert R. Dynamics of glass-forming liquids. VIII. Dielectric signature of probe rotation and bulk dynamics in branched alkanes. J. Chem. Phys. 2004;121:8960–8967. doi: 10.1063/1.1804944. [DOI] [PubMed] [Google Scholar]
- 48.Owenius R, Eaton GR, Eaton SS. Frequency (250 MHz to 9.2 GHz) and Viscosity Dependence of Electron Spin Relaxation of Triarylmethyl Radicals at Room Temperature. J. Magn. Res. 2005;172:168–175. doi: 10.1016/j.jmr.2004.10.007. [DOI] [PubMed] [Google Scholar]


