Abstract
The performance of reaction-field methods to treat electrostatic interactions is tested in simulations of ions solvated in water. The potential of mean force between sodium chloride pair of ions and between side chains of lysine and aspartate are computed using umbrella sampling and molecular dynamics simulations. It is found that in comparison with lattice sum calculations, the charge-group-based approaches to reaction-field treatments produce a large error in the association energy of the ions that exhibits strong systematic dependence on the size of the simulation box. The atom-based implementation of the reaction field is seen to (i) improve the overall quality of the potential of mean force and (ii) remove the dependence on the size of the simulation box. It is suggested that the atom-based truncation be used in reaction-field simulations of mixed media.
INTRODUCTION
Electrostatic interactions play a critically important role in computer simulations of biomolecular systems.1 The most prevalent approaches to treating electrostatic interactions available today can be grouped into two broad classes. The first class includes treatments in which the interactions are truncated based on the separation between particles or between groups of particles, and are therefore referred to as cutoff methods. In the second class, no truncation is used but instead, interactions among all particles in the simulation box are included as well as interactions with the images of these particles created by the periodic replication of the simulation box throughout the space.2 As the image charges form an infinite lattice, the resulting electrostatics treatments are termed lattice sum methods. The cutoff based methods are much faster than the lattice sum approaches.1, 2 However, they are generally believed to be considerably less accurate,3, 4, 5 although the opinions appear to be split.6
A third, alternative approach to electrostatics is based on adding corrections to the truncated electrostatic potentials that take into account electric fields created by the polarization of vacuum cavities embedded in continuum dielectric media, or the reaction fields (RFs).7, 8, 9, 10 Designed primarily for aqueous solutions, the RF-based methods offer two main advantages over the lattice sum techniques. First, they treat electrostatic interactions as pairwise summations and thus run much faster than the lattice sums. Second, the artificial periodicity in the electrostatic potentials present in the lattice sum methods is largely attenuated in the RF approaches. The importance of the periodicity artifacts in computer simulations has been vigorously debated in the past several years.11
A major drawback of the RF approaches is that they were developed specifically for homogeneous systems such as neat water12 and electrolyte solutions.10, 13 In principle, systems with substantial inhomogeneities, such as solvated solutes for instance, cannot be simulated using these methods. In practice, however, several recent studies have reported satisfactory performance of RF-based simulations as applied to molecular ions,14 DNA∕RNA molecules solvated in water15, 16 and short peptides in aqueous solutions.5, 17, 18, 19, 20 Despite these initial successes, our current understanding of the applicability limits of the RF-based electrostatics schemes in simulations of molecular solutes is still limited. In recent simulations of lipid bilayers21 and DNA solutions22 the reaction-field method showed large discrepancies with the results of the more accurate Ewald summation. This method was also seen to lead to significant errors in simulations of a pair of guanidinium acetate ions,14 where it underestimated the ion association energy, the cost of bringing two ions together, by some 2 kCal∕mol. This is more than 50% of the total ∼3 kCal∕mol association energy predicted for the ions by the Ewald summation! The error is significant and calls for more studies into the applicability of RF-based electrostatics in simulations of solvated systems.
In this paper, we consider solvation of a pair of sodium chloride ions in water as a test system to evaluate the performance of the reaction-field method7 in mixed media. Ions are essential in chemistry and biology. Their accurate description is of paramount importance to ensuring high quality of any modeling efforts related to biological processes. We find that the accuracy of the RF method critically depends on how interactions between ions and water molecules are truncated. Truncation schemes based on charge groups of waters lead to significant systematic errors in the potential of mean force (PMF) of the ions. In line with the results of Rozanska and Chipot14 for guanidinium acetate, we find that the association energy of sodium chloride pairs can be misrepresented by as much as 50% of its value predicted by the more accurate particle-mesh-Ewald (PME) scheme.23 Furthermore, the errors in the association energy are seen to strongly depend on the size of the box in which simulations are performed. This is unlike the behavior observed for the reference PME calculations, which predict binding energy with a 0.2 kCal∕mol accuracy in simulation boxes of varying size. We further find that by treating truncation among ions and water molecules on the per-atom basis (i) brings the binding energy into better agreement with the PME results and (ii) removes the dependence on the simulation box size. To test our findings for a system with more direct relevance to biomolecular simulations, we examined solvation of a pair of aspartic acid and lysine side chains in water. The results of these simulations are consistent with those of sodium chloride: The atom-based RF method produced much better agreement with the PME simulations than did the group-based RF calculations. This work provides a practical recipe for conducting better simulations of ionic solutes in water, using the reaction-field corrections method.
METHODS AND MODELS
Ions, peptides and water molecules were modeled at the atomic level. Atoms not linked by covalent bonds interact with one another through nonbonded dispersion and electrostatic interactions. In theory, these interactions should extend over all pairs of atoms present in a simulated system. In practice, such interactions are truncated at a certain cutoff distance Rc, for the sake of computational efficiency. How this truncation is implemented has a tremendous effect on the properties of the simulated system, especially on the electrostatic potentials.
Implementing truncation of nonbonded interactions
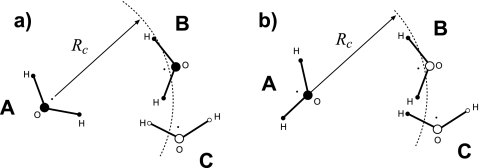
One way to truncate nonbonded interactions is based on the separation among atoms that make up the system of interest. For simple atomic liquids this is the only method possible. For molecular liquids and solutions, truncation based on groups of atoms was suggested as more accurate.24, 25 Typically, groups are composed of several atoms and are designed such that their total charge is zero. Water molecules in the transferable interaction potential model TIP3P,26 for instance, contain three charges in one charge group. There exist several choices for what to call a separation between groups of charges. Geometrical centers of molecules, their centers of mass or position of specific atoms within these molecules, can all be used to measure the distance from one molecule to another. The concepts of atom- and group-based truncations are explained in Fig. 1. The total electrostatic potential of a system simulated using the cutoff-based schemes reads
| (1) |
where NAT is the number of atoms in the system, Vij is the interaction potential between atoms i and j, rij is the distance between these atoms and RIJ is the distance between charge groups to which these atoms belong. Capital characters I and J number charge groups, AT and CG refer to atom-based and group-based truncation schemes, respectively, and H(x) is the Heaviside step function. In the straight cutoff method, atoms interact via Coulomb potentials, Vij=(qiqj∕4πϵ0)(1∕rij), where qi and qj are the charges of atoms i and j. According to Eq. 1, these potentials are abruptly terminated at the cutoff distance r=Rc and thus experience a discontinuity. This is a serious drawback, which also affects electrostatic forces and leads to severe artifacts in molecular dynamics simulations. On the technical side, a great number of numerical schemes have been proposed to remove the discontinuity, the so-called switching∕shifting methods. Their relative strengths and weaknesses in the context of biomolecular simulations were discussed at length.27 On the conceptual side, shifting and switching do not help the fact that a long-range interaction is replaced by a short-range one, and this has dramatic consequences for simulated systems, as has been well documented in literature.3, 4
Figure 1.
Cartoon explaining different truncation schemes of the electrostatic interactions. In the group-based scheme, (a), the interactions between two molecules are zero unless the distance between the “centers” of these molecules is below Rc. Several definitions of the centers can be used. In (a), molecule A interacts with molecule B but not with molecule C. In the atom-based truncation, (b), only the pairs of atoms with separation r≤Rc are considered. In (b), oxygen of molecule A interacts with hydrogens of molecule B but not its oxygen.
The effect of the truncated part of the Coulomb interactions can be approximated using models of continuum electrostatics. By solving Poisson equation for an empty sphere embedded in infinite dielectric continuum of permittivity ϵ, it is possible to find exactly the polarization force acting on a probe charge located at the center of the sphere that is created by a charge at any other point inside the sphere. The polarization, or reaction force can be added to the Coulomb potential through a RF correction. The resulting potential leads to an effective interactions between atoms i and j, . The potential is now continuous at r=Rc but forces are not. Other formulas for the RF corrections have been suggested.28
Computing the potential of mean force
The PMF describes the effective interaction between two solutes immersed in solvent. In this work we compute PMFs for a pair of sodium chloride ions and a pair of molecular ions. Umbrella sampling technique,29 in conjunction with the multiple-histogram analysis method,30, 31 was applied to generate the PMFs. In the simulations of NaCl ions, the umbrella potentials were applied along the z coordinate with the force constant k=1000 kJ∕mol nm2. Twelve windows were considered in total, each applied with a 1 Å step starting at the separation between the ions of 3.5 Å. The sodium ion was constrained around its initial location while the chloride ion was allowed to move along the z axis. Various initial positions were considered, as explained in the main text. One test PME simulation was carried out for a larger number of umbrella windows, 24. It allowed for a longer range of distances to be probed, extending from 2 to 27 Å. Under periodic boundary conditions, the effective interactions between particles are also periodic. By design, the PMF curve is symmetric in the range [0,L], where L is the length of the simulation box along the direction of the PMF coordinate. Due to the symmetry property, the PMF should exhibit a reflection point at r=L∕2, which was 2 nm in the test simulation. Both arms in a symmetrical PMF should be superimposable, if the sampling in the simulations is adequate. We verified that this is the case in the test simulations, confirming good convergence of the data.
Simulations of sodium chloride ions
We use a pair of sodium chloride ions as a test system to study the performance of reaction-field-based methods to compute electrostatic interactions. Sodium and chloride ions are essential to many processes in biology. Due to their widespread use in literature as counter ions in computer simulations of charged molecules, hydrated sodium chloride is one of the best studied ionic systems.13, 32, 33, 34, 35, 36, 37, 38, 39, 40, 41 The model of Åqvist42 was used for the sodium ion and that of Chandrasekhar et al.,43 for the chloride ion. The ions were solvated in rectangular boxes of TIP3P (Ref. 26) water under periodic boundary conditions. Three sizes of the boxes were considered, 2.5×2.5×4, 3×3×4, and 4×4×5 nm3. Three different schemes to treat electrostatic interactions were examined (i) straight cutoffs, (ii) reaction-field corrections,7 and (iii) lattice summation.23 Various sets of cutoff radii and other parameters were used as described in the main text.
All simulations except those using the center of mass and oxygen-centered group-based cutoffs, were performed using the GROMACS software set.44, 45 Covalent bonds of the water molecules were held constant by the SETTLE algorithm.46 The bonds involving hydrogens of the peptide were constrained according to the LINCS protocol.47 The integration time step was 2 fs. Neighbor lists for the nonbonded interactions were updated every ten simulation steps. The simulations were performed under constant temperature conditions at T=300 K. The temperature was controlled by Nosé–Hoover algorithm48 with a 0.05 ps time constant.
For the group-based cutoff simulations in which the center of mass and the position of oxygen within water molecules were used as the charge-group center, in-house software was used, specifically written for this project. The bond lengths of water molecules were constrained according to the noniterative matrix method.49, 50 The positions and velocities of particles were propagated using an implementation of the velocity Verlet algorithm, coupled with the Nosé–Hoover thermostat by Jang and Voth.51, 52 The algorithm labeled VV1 in the original paper was employed. As in the simulations performed by GROMACS, the simulation time step was 2 fs, the temperature was maintained at T=300 K and the thermostat’s coupling constant was 0.05 ps.
Simulations of molecular ions
Side chains of two charged amino acids, lysine, and aspartate, were used as models of molecular ions. To avoid interference from charged termini, neutralizing groups were placed at the N- and C-termini, respectively. The resulting amino acetylated and carboxy-amidated monolysine, Ace-LYS-Nme, and monoaspartate, Ace-ASP-Nme, were built and minimized in vacuum using CHARMM.53 The peptides were then aligned such that the Cα, Cγ, and Cε of LYS lay along the same axis as Cα and C atoms of ASP. Fixing the mutual orientation of the molecules, torsional angle formed by C and Cα on ASP and Cα and C on LYS was set at 150°. All atoms of the lysine peptide were constrained to remain around their initial positions. For the aspartic acid, only z and y coordinates were constrained while umbrella potential was applied along x axis. The setup of the umbrella potential as well as other parameters of the simulations, such as temperature and time step, were identical to those employed in the simulations of NaCl ions. The peptides were modeled using OPLS∕AA force field.54 All simulations were run for 10 ns using GROMACS.44, 45
RESULTS AND DISCUSSION
Potential of mean force of sodium chloride pair of ions
To evaluate the performance of reaction-field-based electrostatics methods, we first computed the PMF between sodium and chloride ions using the most accurate electrostatics scheme currently available, the PME.23 Several tests were performed to ensure that the resulting PMF is sufficiently accurate to serve as reference in our reaction-field-based calculations. First, tests of convergence were run. A set of umbrella sampling simulations of total length 10 ns were performed in a box with dimensions 2.5×2.5×4 nm3. The sodium ion was placed at a reference point x=0.9 nm, y=0.9 nm, and z=0.4 nm. For the chloride ion, the x and y coordinates were constrained around 0.9 nm while umbrella potential was applied along the z axis. The PMF was computed as a running average over time periods of 2, 4, 6, 8, and 10 ns to check how fast convergence occurs. It was seen that starting at 4 ns, all computed PMFs were visually indistinguishable from that obtained for the 10 ns trajectory. We therefore conclude that the relaxation time required for accurate determination of NaCl PMFs using PME is approximately 4 ns. To test the reproducibility of our results, a second trajectory was run in which parameters of the umbrella potential were changed. The resulting PMFs could not be distinguished from those obtained originally.
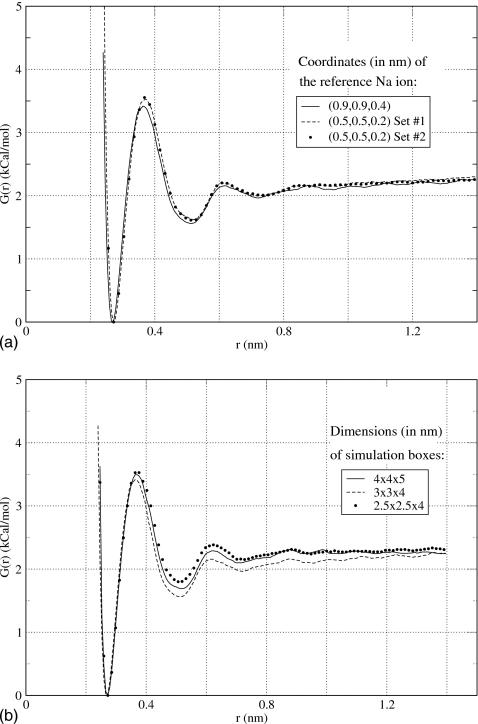
The converged PMF obtained for NaCl ions is shown in Fig. 2a. It has a shape typical for many ionic and neutral small solutes. The global minimum is seen at r∼2.7 Å followed by a maximum at r∼3.7 Å and another minimum at r∼5 Å. Physically, the first minimum corresponds to two ions making a van der Waals contact while the ions are separated by one intervening water molecule at the second minimum. The solvent-separated minimum (SSM) is approximately 1.7 kCal∕mol higher in free energy than the close-contact minimum (CCM). A transition from the SSM to CCM configuration requires clearing a 1.8 kCal∕mol barrier. The energy required to bring two ions together, or the association or binding energy, is ∼2.3 kCal∕mol.
Figure 2.
Potential of mean force obtained for the hydrated sodium chloride ions in the present work using PME method (Ref. 23). In (a), simulation box with dimensions 3×3×4 nm3 was used to compute the PMF along the z axis while constraining Na at two positions, x=0.9 nm, y=0.9 nm, and z=0.4 nm and x=0.5 nm, y=0.5 nm, and z=0.2 nm. The degree of convergence was verified in two independent simulations, Set Nos. 1 and 2. In (b), the dependence of the PMF on the size of the simulation box is tested. Three boxes were considered, 2.5×2.5×4, 3×3×4, and 4×4×5 nm3. The PMFs are seen to be accurate up to 0.2 kCal∕mol.
Although the PMF of NaCl ions in water has been extensively studied in the past 2 decades, there appears to be no general consensus as to its shape. The first simulation to compute the PMF for sodium chloride was reported by Berkowitz et al.32 It predicted two minima with the second minimum lying higher than the first minimum. Subsequent studies both confirmed this shape of the PMF (Refs. 9, 33, 35, 37, 39) as well as questioned it.40, 36, 38 Friedman and Mezei,40 for instance, argued that only one minimum exists, the one that corresponds to the close contact between ions, and the solvent-separated minimum is an artifact of the simulation protocol. Others have found that while two minima do appear in the PMF, the second minimum is more stable (lower in free energy) than the first minimum.36, 38 It should be noted that many studies use different models of ions and water and employ different algorithms to compute PMFs, which may affect the end results. Comparisons with the results of these studies are not always straightforward. In the present work, we see the best agreement with the results of Berkowitz et al.32 and those of Martorana et al.39 Both these studies predict that the CCM and SSM minima are at 2.7 and 5 Å, respectively. The second minimum was seen to be 1.3 kCal∕mol (Ref. 32) and 1.5 kCal∕mol (Ref. 39) higher than the first minimum, which agrees favorably with the value of 1.8 kCal∕mol observed in the present work, considering that different ions and water models were used.
An additional test was performed to determine the dependence of the PMF on the location of the reference Na ion within the simulation box. Theoretically, the results should not depend on where the interactions are probed within the simulation box since the system is completely periodic. In practice, however, this may not be the case. Atomic charges within the PME method are mapped onto a rectangular mesh of points using interpolations. The results of these interpolations may depend on the relative location of the ions and the mesh and thus affect the PMFs. To test the effect of the ions location, a separate simulation was performed in which Na ion was placed at x=0.5 nm, y=0.5 nm, and z=0.2 nm. The results of this simulation are shown in Fig. 2a along with the results of a third simulation, performed using a different umbrella setup, to test the reproducibility. All three PMF curves in Fig. 2a are visually indistinguishable, confirming good convergence and accuracy of our calculations.
Finally, we tested the dependence of the PMF on the size of the simulation box. In addition to the 2.5×2.5×4 nm3 box discussed above, two more boxes with dimensions 3×3×4 and 4×4×5 nm3 were considered. The same protocol was employed to compute PMFs as before. The results shown in Fig. 2b argue that all three PMFs have similar general features. The variation with the size of the simulation box does not exceed 0.2 kCal∕mol anywhere in the plot. It is less than 10% of the total association, or binding energy, and thus can be considered a small systematic error.
Straight cutoffs lead to significant artifacts in the PMF
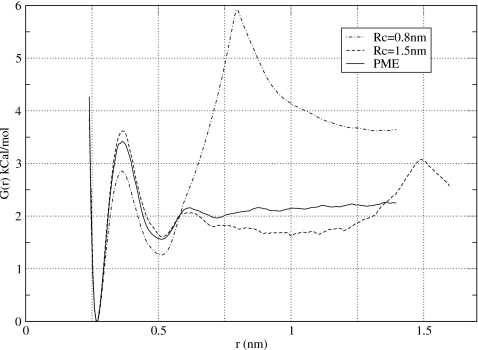
Straight cutoff method continues to be widely used in literature in computer simulations of biomolecules and we therefore tested its performance here for the sake of comparison. We use a cutoff scheme that is based on mutual separation between geometrical centers of two groups of charges. Sodium and chloride ions are point charges so they contain one group each. Water molecules contain three charges and are also treated as one group. Two values of the cutoff distance were used Rc=0.8 nm and Rc=1.5 nm. The resulting PMFs are shown in Fig. 3. The shorter Rc=0.8 nm is seen to lead to severe artifacts. Compared to the PME results, both the first maximum and the second minimum are not well reproduced. Additionally, a strong maximum is seen at the cutoff distance r=0.8 nm. The maximum implies a strong repulsion between particles with opposite charges at large separations r>Rc and thus is completely unphysical. Similar unphysical behavior was reported by Bader and Chandler55 in computer simulations of positively charged iron-based ions, which led to their attraction at large distances. The larger cutoffs are seen to alleviate some of the problems in the cutoff-based electrostatics calculations. The results for Rc=1.5 nm3 show that the short-range behavior of the PMF is much improved. The depth of the SSM, as well as the height of the barrier separating it from the CCM, are now within statistical error of those predicted in the PME simulations. The association energy, however, is still underestimated. At r=1 nm for instance, the difference between the cutoff and PME values is ∼0.4 kCal∕mol, which is beyond the estimated statistical error of 0.2 kCal∕mol. A spurious maximum observed for Rc=0.8 nm persists for Rc=1.5 nm although it becomes much smaller in magnitude. Our conclusion for the cutoff-based calculations is that they are not very reliable at reproducing effective interactions between ions in water, even when a relatively large cutoff radius is used.
Figure 3.
Potential of mean force obtained in this work for NaCl using group-based straight cutoff method. Two values of the cutoff distance were considered, Rc=0.8 nm and 1.5 nm. The distinctive feature of the obtained PMFs is a strong and unphysical maximum at r=Rc. The strength of the maximum is attenuated at larger cutoff radii.
Reaction field corrections improve PMFs but exhibit systematic errors
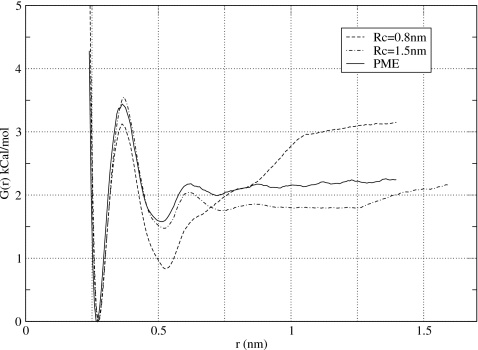
The next tests in computing the PMF of NaCl ions were done using reaction-field corrections to the truncated electrostatic potentials.7 As with the straight cutoff techniques, it was suggested that for molecular systems, group-based truncation of interactions works better.56, 57 To evaluate the effect of reaction fields on the PMF, our simulations with the straight cutoffs were repeated with the reaction-field corrections added. The results of these simulations, using two values of the cutoff radius Rc=0.8 nm and Rc=1.5 nm in a simulation box of 3×3×4 nm3, are shown in Fig. 4. Overall, the RF corrections produce PMFs that are in much better agreement with the PME results than those of the straight cutoff simulations. The peaks at r=Rc that led to the artificial repulsion between ions in the cutoff calculations are clearly gone now. This is in agreement with the observation of Rozanska and Chipot,14 who reported marked improvement in the PMF between guanidinium and acetate ions when reaction-field corrections were applied. Other discrepancies noted for the cutoff scheme, however, still persist. The association energy, for instance, deviates strongly from its PME value, as Fig. 4 shows, by as much as 0.4 kCal∕mol for Rc=1.5 nm and 0.8 kCal∕mol for Rc=0.8 nm, which are statistically significant values. Additionally, the depth of the solvent-separated minimum is underestimated by 0.9 kCal∕mol for Rc=0.8 nm.
Figure 4.
Potential of mean force obtained in this work for NaCl using group-based reaction-field correction method. Two values of the cutoff distance were considered, Rc=0.8 nm and 1.5 nm. Compared to Fig. 3, the unphysical maxima resulting from the potential truncation at r=Rc are gone. Significant residual errors are observed in the association energy of two ions.
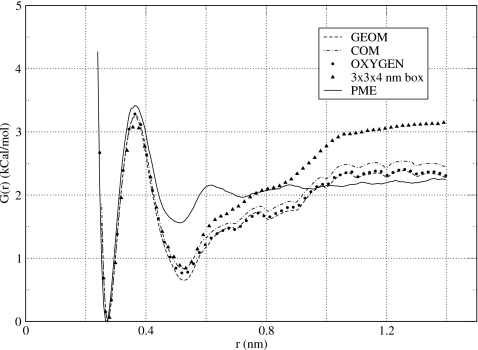
With such large errors present in the group-based reaction-field calculations, a pertinent question to ask is what is their origin? They clearly cannot be removed by simply increasing the cutoff radius, as we have shown. Two other possible reasons for the errors were considered: (i) The dependence on the size of the simulation box and (ii) the effect of varying the location of the center of the charge group. To test whether the PMF depends on the simulation box, a smaller box with dimensions 2.5×2.5×4 nm3 was considered. The results are shown in Fig. 5. The association energy is seen to be close to the value obtained in the PME simulations, having decreased by ∼0.6 kCal∕mol. On the one hand, this may seem as an encouraging result, since better agreement with the more accurate calculation is observed. On the other hand, however, this result demonstrates strong dependence on the simulation box and thus is quite worrying. If the RF-based calculations are to be adopted on a large scale, including systems of different sizes and composition, the dependence on the simulation box is not desirable. As seen in Fig. 5, the size of the simulation box does not improve the solvent-separated minimum in the PMF.
Figure 5.
Potential of mean force obtained in this work for NaCl using group-based reaction-field correction method and cutoff distance Rc=0.8 nm. For a small simulation box 2.5×2.5×4 nm3, three definitions of the charge-group center were used: The center of geometry (GEOM), the center of mass (COM), and the position of the oxygen atom (OXYGEN). For the larger box, 3×3×4 nm3, only the center of geometry was tested. For comparison, the PMF of the PME simulations is shown (independent of the simulation box). The size of the simulation box strongly affects the results of the group-based RF method.
In the calculations presented in Fig. 4, the center of the charge groups, which include entire water molecules, was selected as their geometrical center. Accordingly, the interactions were truncated according to the distance between geometrical centers of waters. Clearly, this is not the only choice. The effect of varying the position of the group center within the straight cutoff scheme and Ewald summation were thoroughly studied previously.58, 59 Strong variations were reported in the electrostatic potentials with small displacement of the group centers within water molecules. In the context of the RF-based electrostatics, several choices for the group center were discussed. The earliest proposal was to use the center of mass of water molecules as their charge-group center.8, 56, 57, 60 Later on, the position of the oxygen atom within the molecule61 and its center of geometry12 were suggested. We evaluated the PMFs using all three definitions of the group center for the simulation box 2.5×2.5×4 nm3. Our results are presented in Fig. 5. Different definitions of the group center are seen to agree with each other to within 0.2 kCal∕mol. As this falls within the statistical error we estimate for the PMF, we conclude that the choice of the charge-group center does not affect effective interactions between ions in any significant manner.
Atom-based corrections remove the dependence on the size of the simulation box
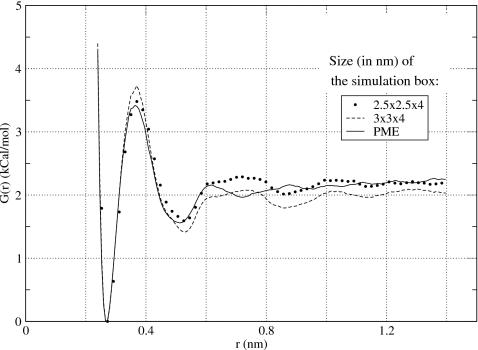
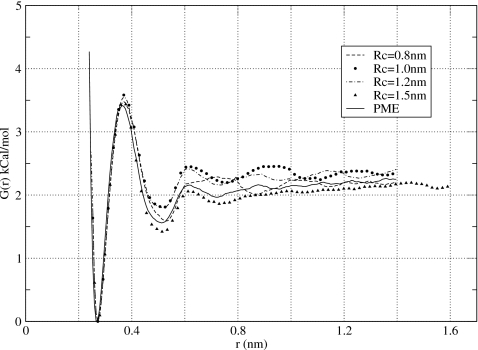
Another test of the reaction-field method was to compute the PMF using atom-based, rather than group-based, truncation. A recent study of Hünenberger and van Gunsteren61 evaluated these two truncation schemes in simulations of liquid water and found that the former produces much better agreement with the Ewald summation for a number of energetic, structural and dynamic properties. Atom-based truncation was also found to be superior in ionic solvation energy calculations.58, 62, 63 In Fig. 6, we show the PMF for NaCl ions computed using the atom-based cutoffs in a simulation box of size 2.5×2.5×4 nm3. Good agreement with the PME calculations is seen throughout the entire physically interesting range of distances, starting from 0.3 nm and ending at 1.4 nm. Both the first maximum and the second minimum in the PMF are well reproduced. The association energy of ions is within statistical error of that seen in the PME simulations. The only noticeable flaw is a small maximum preceding the cutoff distance Rc=0.8 nm and a small minimum following immediately after it. The magnitude of these extrema are very small, however, well within the statistical error. Data presented in Fig. 6 for a larger simulation box 3×3×4 nm3 show that the PMF computed using atom-based cutoffs depends only weakly on the size of the simulation box. The curves obtained in the two simulations differ no more than 0.2 kCal∕mol and, therefore, are within the statistical error of this work. That there is no variation present in the PMF of different simulation boxes is extremely important as it ensures reproducibly of results obtained in different simulations. Our final test was to investigate the dependence of the PMF on the cutoff distance Rc. Four values in increasing order were considered 0.8, 1.0, 1.2, and 1.5 nm. The resulting PMFs are shown in Fig. 7. The small artifact at around r=Rc persists for longer cutoffs but diminishes in magnitude. Starting at Rc=1.2 nm it is hardly noticeable. For the longest cutoff distance considered, Rc=1.5 nm, the PMF computed using atom-based reaction-field method is identical to that calculated by PME. This is in stark contrast to the results obtained using group-based cutoffs, see Fig. 4, and those obtained without reaction-field corrections, see Fig. 3.
Figure 6.
Potential of mean force obtained in this work for NaCl using atom-based reaction-field method with the cutoff distance Rc=0.8 nm. Simulations in two boxes, 2.5×2.5×4 and 3×3×4 nm3, are compared to the PME results. Boxes of different size produce statistically identical results.
Figure 7.
Potential of mean force obtained in this work for NaCl using atom-based reaction-field correction method and four cutoff distances Rc=0.8, 1.0, 1.2, and 1.5 nm. Reasonably good agreement is observed for all four curves with the PME results.
Rationalizing the effect of group-based truncation on PMF
Different effective interactions G(r) arise for ions because of different mean forces, F(r)=−(∂G(r)∕∂r), acting between them when they are constrained to a mutual separation r. We show below that the different forces generated in the atom-based and group-based RF schemes, and therefore different PMFs, can be rationalized in terms of how these methods treat charges around cutoff distance RC. We begin by introducing the charge distributions perspective on CG truncation, as discussed by Hummer et al.58 Let us consider a central charge q and its interactions with surrounding water molecules as shown in Fig. 8a. In the group-based truncation, the interaction partners of q are sorted according to the position of their group-charge center, say the oxygen atom for definitiveness. There are some water molecules in this setup, B, whose hydrogens are separated by distances r>RC from charge q but still interact with it, while hydrogens of other water molecules, A, are at r<RC from the charge but do not interact with it. Hummer et al.58 pointed out that this results in incomplete compensation of positive and negative charge around RC relative to the atom-based truncation. Since oxygen atoms carry negative charge and hydrogen atoms are positively charged, the result is a buildup of negative charge before RC and of positive charge immediately after it, as shown in Fig. 8b. The charge buildup is completely unphysical and depends on the water orientations relative to q. Importantly, it does not vanish for large RC (greater than the correlation length) where waters are oriented randomly and the total charge density seen at q should be zero.
Figure 8.
Cartoon explaining how excess force on charged particles is created in the group-based cutoff truncation. In (a), a central charge q sees hydrogen charges of water molecule B, r>RC, but not those of molecule A, r<RC, if cutoff is based on the position of the oxygen atoms. The result is a buildup of negative charge just before RC and positive charge immediately after it (Ref. 58). In homogeneous media, the extra charge forms a dipole layer, which due to its symmetry exerts no force on the central particle, as shown in (b). Inhomogeneities, such as another ion q′ shown in (c), break the spherical symmetry thus inducing a net force on q.
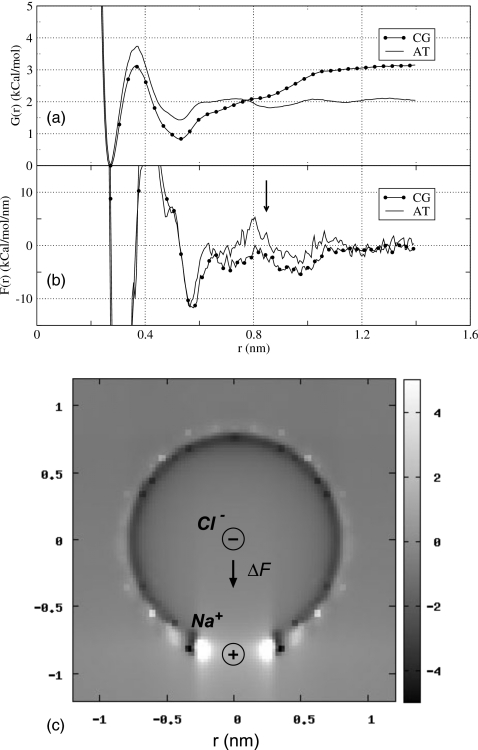
The excess charge density δρ forms a dipole layer around the central charge that creates additional potential at q.58 The effect of this potential is non-negligible, but due to its spherical symmetry, it exerts no net force on q, as illustrated in Fig. 8b. Nonzero force on q may arise only if the symmetry of δρ is broken, as in the presence of inhomogeneities for instance. How such inhomogeneities may arise is illustrated in Fig. 8c, which shows that by placing another charge q′ at a distance r∼RC from the central ion q, one creates a hole in the q’s excessive charge layer thus destroying its symmetry. It is easy to see from Fig. 8c that the forces originating from patches of the layer below and above q are uncompensated and do not add up to zero ΔF≠0. The magnitude of ΔF depends critically on the precise charge distribution around q′ and thus on its size and the distance r. Positive and negative charges experience forces acting in opposite directions. If we denote by δF(r) the electrostatic force contribution in CG scheme due to δρ, the difference in mean forces observed in CG and AT simulations can be expressed as ΔF(r)=⟨Ftot(r)⟩CG−⟨Ftot(r)⟩AT+⟨δF(r)⟩CG, where brackets ⟨…⟩ indicate ensemble average and Ftot(r) is the total force in AT truncation, including electrostatic and van der Waals components, experienced by one of the ions when the other ion is fixed at a distance r apart. The observed ΔF(r) is influenced by two factors: (i) The actual difference in forces δF(r) averaged over the CG ensemble, and (ii) the difference resulting from averaging Ftot(r) in different ensembles, ⟨ΔF(r)⟩ens=⟨Ftot(r)⟩CG−⟨Ftot(r)⟩AT. δF(r) here describes the direct effect of using group-based truncation while ⟨ΔF(r)⟩ens results indirectly, through induced perturbations to water structure. We evaluate the magnitude of these two effects in our simulations of NaCl ions separately. The PMFs obtained in atom-based and group-based simulations and the mean forces they produce, F(r)=−(∂G(r)∕∂r), are plotted in Figs. 9a, 9b, respectively. The forces show largest deviation at around cutoff radius r∼8 nm. We focus on two interionic distances to analyze the effects of CG truncation.
Figure 9.
Comparison between potential of mean force, (a), and average force acting on Cl ion, (b), computed in our simulations of NaCl solvation using atom-based (AT) and group-based (CG) reaction-field methods. At r∼0.85 nm, the effective force computed by the group-based method is lower than that obtained in the atom-based method, indicating enhanced attraction between the ions. In (c), the artifactual charge density (arbitrary units) around Cl ion resulting from the use of the group-based cutoff with RC=0.8 nm. The separation between the ions is r=0.85 nm. The estimated net force of this distribution on Cl is negative, indicating additional attraction between Na and Cl.
First, we consider a distance r0=0.85 nm, where the two truncation schemes predict qualitatively different behavior for the effective interionic interaction. The AT scheme generates a net positive force F(r0)∼2.0 kCal∕mol nm, implying repulsion between the ions, while the CG method indicates attraction with a net negative force F(r0)∼−2.3 kCal∕mol nm. On balance, the CG scheme produces an additional attractive force of magnitude ΔF(r0)∼−4.3 kCal∕mol nm between the ions. Because of the numerical differentiation, this number is approximate. We examined the CG trajectory to determine the excess charge density δρ for the chloride ion. The system is cylindrically symmetric so δρ can be averaged radially. Figure 9c shows a radial cross section of δρ in arbitrary units. The density is nonzero only close to r=RC, as expected. Also as expected, negative charge is clustered just below RC and positive charge—above it. The general shape of the density map is consistent with that hypothesized in Fig. 8c: Sodium ion perturbs the charge layer and creates a hole in it. The sodium ion strongly orders water molecules in its first solvation shell, which affects how these molecules are sorted for the chloride ion. The result is a complicated charge density δρ with two large maxima close to Na. Positive charges next to Na exert negative forces on Cl, thus creating additional attraction between Na and Cl, in agreement with Fig. 9b. The numerical value of the direct force ⟨δF(r0)⟩CG=−0.3 kCal∕mol nm is an order of magnitude smaller, however, than the total estimated force difference −4.3 kCal∕mol nm and thus cannot explain the observed difference between atom-based and group-based PMFs.
The second component of the total force difference, ⟨ΔF(r)⟩ens=−4.0 kCal∕mol nm, is much larger, and therefore more important. It is derived from the averaging of Ftot(r0)=Fel(r0)+FvdW(r0) in AT and CG ensembles, where Fel(r0) and FvdW(r0) denote electrostatic and van der Waals forces acting on Cl ion, respectively. We evaluated the contributions of these forces numerically and found that the van der Waals component is dominant, ΔFel(r0)=−0.1 kCal∕mol nm and ΔFvdW(r0)=−3.9 kCal∕mol nm. In TIP3P water model, only the oxygen atoms interact with the ions through dispersion forces, and it therefore must be the change in the distribution of these atoms around ions, triggered by the group-based truncation, that causes an additional attractive force between them. We examined distribution of oxygen atoms around Na and Cl ions in AT and CG trajectories and found that in the latter, the water molecules have a tendency to solvate Na ions better than they do Cl ions. Water molecules close to both ions are seen to be moving out of the first solvation shell of Cl and into the first and second solvation shells of Na. This creates a disbalance in the repulsive forces acting on Cl, leading to a net negative force. The result is an additional attraction between Na and Cl. It is clear from this analysis that at r0=0.85 nm, the origin of the additional attraction observed in CG simulations is water redistribution around solvated ions. To determine whether this solvation tendency is a property specific to pairs of ions or it applies to each ion separately, we performed additional simulations, in which solvation of single Cl and Na ions in water boxes was considered. We used the same protocol as in the simulations of the NaCl system. PMFs were computed between an ion, Na or Cl, and the oxygen of a designated water molecule at a distance r. We found that the difference in the PMFs obtained in AT and CG simulations can be explained in terms of δρ. A water fixed at a distance r=RC=0.8 nm from the chloride ion, for instance, creates δρ that exerts a negative electrostatic force on Cl, resulting in a hindered solvation of the ion. Similarly for Na, the CG truncation creates an additional attractive force between water and the ion, leading to the ion’s enhanced solvation. An important conclusion from these observations is that the CG solvation effects that define the interion PMF at r∼RC, are set for each ion independently.
Next, in order to determine whether the mechanism uncovered for r=r0=0.85 nm is universal, we analyzed a shorter distance r=r1=0.5 nm. Unlike the larger distance r=r0, where an additional attraction between ions is seen, the shorter distance r=r1 produces an additional repulsion, as shown in Fig. 9a. The total force difference ΔF(r1)=2 kCal∕mol nm was found to consist of ⟨ΔF(r1)⟩ens=3.9 kCal∕mol nm and ⟨δF(r1)⟩CG=−1.9 kCal∕mol nm. Two conclusions follow immediately from this result. First, the direct force ⟨δF(r1)⟩CG is not predictive of the nature of the additional force acting between ions. The total force is repulsive while the direct contribution is attractive. Second, direct and structure-mediated effects of δρ are of the same magnitude. There is not a single term dominating the sum and therefore an interplay between various contributions determines the net effect of the group-based truncation. This latter circumstance precludes a simple interpretation of the CG effects for r=0.5 nm, similar to that discussed for r=0.85 nm.
In conclusion, we find that the mechanism by which the CG truncation affects effective interionic interactions is complex and strongly dependent on the ionic separation r. The root cause is the additional force acting on charged particles due to the specific way in which their interaction partners are sorted. A simple interpretation is possible for r∼RC, where the main effect is through modulation of the water structure around solvated ions. At r<RC, total force difference acting on Na and Cl ions is a result of a subtle interplay between structural effects and the difference in electrostatic forces caused by the group-based truncation.
Tests for a pair of charged aspartate-lysine side chains
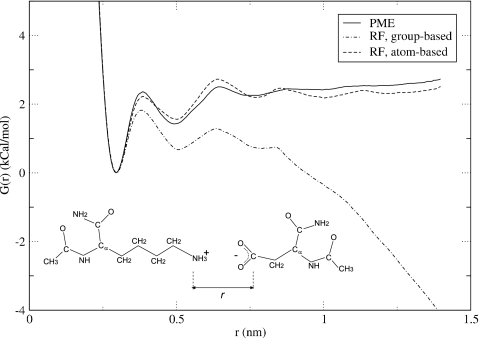
Our simulations of NaCl ions suggest that group-based reaction-field electrostatics may lead to erroneous association energy by as much as 50% of its magnitude. In this section we attempt to estimate the magnitude of these errors in the context of biomolecular simulations. To this end, potential of mean force was determined for a pair of lysine and aspartic acid side chains, as function of the distance separating them. The details of the performed simulations are discussed in Sec. 2.
A schematic representation of the studied configuration is shown in Fig. 10. All atoms of LYS side chain were constrained to lie around their initial values. In the aspartic acid ion, the atoms were constrained in the y and z directions while the umbrella potential was applied along x axis. The PMFs were computed using PME electrostatics as well as group- and atom-based reaction-field methods. A cutoff of 0.8 nm was employed in all three simulations. In the group-based RF runs, the geometrical centers of the groups were treated as the charge-group centers. For water molecules, these were their geometrical centers. For the peptides, the decomposition of all atoms into neutral groups was adopted that comes standard with GROMACS.44 In total, there were ten charge groups in lysine and seven charge groups in aspartate molecule. In the atom-based calculations, only the atoms of waters were treated with the atomic cutoffs while the group-based treatment was retained for peptides’ atoms.
Figure 10.
Potential of mean force obtained in this work for a pair of LYS-ASP molecular ions in water. Data for atom- and group-based reaction-field simulations are shown. The atom-based approach leads to a very good agreement with the PME results.
As seen in Fig. 10, the potential of mean force between LYS and ASP side chains conforms to the general shape of a typical interionic free energy profile. The main, close-contact minimum is seen as the most stable configuration. Two other minima are observed, which represent configurations mediated by solvent. It should be noted that, unlike in the ion calculations discussed in Secs. 1, 2, 3, the curve shown in Fig. 10 certainly does not represent a full effective interaction between charged lysine and aspartate. Rather it is a projection of this interaction, which is multidimensional by definition, on a particular reaction coordinate. The particular shape of the PMF curve will certainly depend on the choice of the reaction coordinate, but for the purpose of evaluating the performance of various interaction schemes, it seems reasonable to examine only one of them. Still, it is possible that the performance will depend on the choice of the reaction coordinate. Comparing the curves shown in Fig. 10, it is clear that the group-based RF method produces very wrong results. Starting at ∼0.7 nm, the two molecular ions begin to strongly repel each other. As a consequence, configurations with large separations r≥0.9 nm become more stable than the close-contact states. This is in complete contradiction to what the PME calculations predict. The PMF curve obtained using atom-based cutoffs, on the other hand, is in a remarkably good agreement with the PME calculations. All important areas of the PMF, including minima and barriers are very well reproduced. Although our simulations fall short of a systematic comparison between the two electrostatics methods for the LYS-ASP pair, for the set of parameters and peptide configurations that were employed, we conclude that the reaction-field method with the atom-based cutoffs performs as well as does the PME method.
CONCLUSIONS
In this work we studied the performance of reaction-field-based methods of electrostatics at describing effective interactions between two ions solvated in water. We found large systematic errors associated with the cutoff treatment of the electrostatic interactions based on groups of charged particles. The errors show strong dependence on the size of the simulation box and were seen in both simple single-particle ions NaCl as well as in more complex molecular ions modeled by the side chains of lysine and aspartate amino acids. We ascribe the discrepancy between potentials of mean force computed by Rozanska and Chipot14 for a pair of guanidinium-acetate using group-based reaction-field method and Ewald summation to this systematic error.
The atom-based truncation of electrostatic potentials in the reaction-field method is seen to remove the systematic error in the PMF. In the calculations on NaCl ions, no dependence on the size of the simulation box was seen and only weak dependence on the cutoff radius was observed. The PMF of the lysine-aspartate pair showed very good agreement with the PME results. We argue that the atom-based cutoff is a better option for conducting molecular simulations of systems containing ions when using reaction-field corrections method. One disadvantage of this truncation scheme is its high computational cost compared to the group-based truncation. In our simulations of the sodium chloride ions with 0.8 nm cutoff radius in a simulations box with dimensions 2.5×2.5×4 nm3, the atom-based method was seen to run three times slower than the group-based method, 15 ns per day versus 45 ns, respectively. The atom-based RF calculations, however, still run 2.7 times faster than the PME simulations, 5.5 ns per day. The relative speed up certainly depends on the size of the simulation box, but for the systems considered in this work, the atom-based reaction field is competitive with the PME method.
ACKNOWLEDGMENTS
Support of the National Institute of Health, Grant No. 1R01GM083600-02, is gratefully acknowledged.
References
- Koehl P., Curr. Opin. Struct. Biol. 10.1016/j.sbi.2006.03.001 16, 142 (2006). [DOI] [PubMed] [Google Scholar]
- van Gunsteren W. F., Bakowies D., Baron R., Chandrasekhar I., Christen M., Daura X., Gee P., Geerke D. P., Glattli A., Hunenberger P., Kastenholz M. A., Ostenbrink C., Schenk M., Trzesniak D., van der Vegt N. F. A., and Hu H. B., Angew. Chem., Int. Ed. 10.1002/anie.200502655 45, 4064 (2006). [DOI] [PubMed] [Google Scholar]
- Schreiber H. and Steinhauser O., Biochemistry 10.1021/bi00140a022 31, 5856 (1992). [DOI] [PubMed] [Google Scholar]
- Monticelli L. and Colombo G., Theor. Chem. Acc. 112, 145 (2004). [Google Scholar]
- Baumketner A. and Shea J. E., J. Phys. Chem. B 10.1021/jp051325a 109, 21322 (2005). [DOI] [PubMed] [Google Scholar]
- Beck D., Armen R., and Daggett V., Biochemistry 10.1021/bi0486381 44, 609 (2005). [DOI] [PubMed] [Google Scholar]
- Barker J. A. and Watts R. O., Mol. Phys. 10.1080/00268977300102101 26, 789 (1973). [DOI] [Google Scholar]
- Barker J. A., Mol. Phys. 10.1080/00268979400101781 83, 1057 (1994). [DOI] [Google Scholar]
- Hummer G., Soumpasis D., and Neumann M., Mol. Phys. 10.1080/00268979200102751 77, 769 (1992). [DOI] [Google Scholar]
- Tironi I. G., Sperb R., Smith P. E., and van Gunsteren W. F., J. Chem. Phys. 10.1063/1.469273 102, 5451 (1995). [DOI] [Google Scholar]
- Kastenholz M. A. and Hünenberger P. H., J. Phys. Chem. B 10.1021/jp0350924 108, 774 (2004). [DOI] [Google Scholar]
- van der Spoel D., van Maaren P. J., and Berendsen H. J. C., J. Chem. Phys. 10.1063/1.476482 108, 10220 (1998). [DOI] [Google Scholar]
- Hummer G., Soumpasis D., and Neumann M., Mol. Phys. 10.1080/00268979400100771 81, 1155 (1994). [DOI] [Google Scholar]
- Rozanska X. and Chipot C., J. Chem. Phys. 10.1063/1.481604 112, 9691 (2000). [DOI] [Google Scholar]
- Nina M. and Simonson T., J. Phys. Chem. B 10.1021/jp013855m 106, 3696 (2002). [DOI] [Google Scholar]
- Bonvin A. M. J. J., Sunnerhagen M., Otting G., and van Gunsteren W. F., J. Mol. Biol. 10.1006/jmbi.1998.2034 282, 859 (1998). [DOI] [PubMed] [Google Scholar]
- Gnanakaran S., Nussinov R., and Garcia A. E., J. Am. Chem. Soc. 10.1021/ja0548337 128, 2158 (2006). [DOI] [PubMed] [Google Scholar]
- Mu Y. G., Nordenskiold L., and Tam J. P., Biophys. J. 10.1529/biophysj.105.076406 90, 3983 (2006). [DOI] [PMC free article] [PubMed] [Google Scholar]
- Verli H., Calazans A., Brindeiro R., Tanuri A., and Guimaraes J. A., J. Mol. Graphics Modell. 26, 62 (2007). [DOI] [PubMed] [Google Scholar]
- Soares T., Christen M., Hu K. F., and van Gunsteren W. F., Tetrahedron 10.1016/j.tet.2004.06.062 60, 7775 (2004). [DOI] [Google Scholar]
- Patra M., Karttunen M., Hyvonen M. T., Falck E., and Vattulainen I., J. Phys. Chem. B 10.1021/jp031281a 108, 4485 (2004). [DOI] [Google Scholar]
- Kraütler V. and Hunenberger P. H., Mol. Simul. 34, 491 (2008). [Google Scholar]
- Essmann U., Perera L., Berkowitz M. L., Darden T., Lee H., and Pedersen L. G., J. Chem. Phys. 10.1063/1.470117 103, 8577 (1995). [DOI] [Google Scholar]
- van Gunsteren W. F. and Berendsen J. J. C., Angew. Chem., Int. Ed. Engl. 10.1002/anie.199009921 29, 992 (1990). [DOI] [Google Scholar]
- Leach A. R., Molecular Modeling: Principles and Applications (Pearson, New York, 2001). [Google Scholar]
- Jorgensen W. L., Chandrasekhar J., Madura J. D., Impey R. W., and Klein M. L., J. Chem. Phys. 10.1063/1.445869 79, 926 (1983). [DOI] [Google Scholar]
- Steinbach P. J. and Brooks B. R., J. Comput. Chem. 10.1002/jcc.540150702 15, 667 (1994). [DOI] [Google Scholar]
- Hummer G., Soumpasis D., and Neumann M., J. Phys.: Condens. Matter 10.1088/0953-8984/6/23A/018 6, A141 (1994). [DOI] [Google Scholar]
- Torrie G. M. and Valleau J. P., J. Comput. Phys. 10.1016/0021-9991(77)90121-8 23, 187 (1977). [DOI] [Google Scholar]
- Ferrenberg A. M. and Swendsen R. H., Phys. Rev. Lett. 10.1103/PhysRevLett.61.2635 61, 2635 (1988). [DOI] [PubMed] [Google Scholar]
- Ferrenberg A. M. and Swendsen R. H., Phys. Rev. Lett. 10.1103/PhysRevLett.63.1195 63, 1195 (1989). [DOI] [PubMed] [Google Scholar]
- Berkowitz M., Karim O. A., McCammon J. A., and Rossky P. J., Chem. Phys. Lett. 10.1016/0009-2614(84)85660-2 105, 577 (1984). [DOI] [Google Scholar]
- Vaneerden J., Briels W. J., Harkema S., and Feil D., Chem. Phys. Lett. 10.1016/0009-2614(89)85222-4 164, 370 (1989). [DOI] [Google Scholar]
- Rashin A. A., J. Phys. Chem. 10.1021/j100348a051 93, 4664 (1989). [DOI] [Google Scholar]
- Dang L. X., Rice J. E., and Kollman P. A., J. Chem. Phys. 10.1063/1.459714 93, 7528 (1990). [DOI] [Google Scholar]
- Guardia E., Rey R., and Padro J., Chem. Phys. 10.1016/0301-0104(91)87019-R 155, 187 (1991). [DOI] [Google Scholar]
- Smith D. E. and Dang L. X., J. Chem. Phys. 10.1063/1.466363 100, 3757 (1994). [DOI] [Google Scholar]
- Resat H., Mezei M., and McCammon J., J. Phys. Chem. 10.1021/jp951496n 100, 1426 (1996). [DOI] [Google Scholar]
- Martorana V., La Fata L., Bulone D., and San Biagio P. L., Chem. Phys. Lett. 329, 221 (2000). [Google Scholar]
- Friedman R. A. and Mezei M., J. Chem. Phys. 10.1063/1.469418 102, 419 (1995). [DOI] [Google Scholar]
- Pratt L. R., Hummer G., and Garcia A. E., Biophys. Chem. 10.1016/0301-4622(94)00057-3 51, 147 (1994). [DOI] [PubMed] [Google Scholar]
- Åqvist J., J. Phys. Chem. 10.1021/j100384a009 94, 8021 (1990). [DOI] [Google Scholar]
- Chandrasekhar J., Spellmeyer J., and Jorgensen W. L., J. Am. Chem. Soc. 10.1021/ja00316a012 106, 903 (1984). [DOI] [Google Scholar]
- Lindahl E., Hess B., and van der Spoel D., J. Mol. Model. 7, 306 (2001). [Google Scholar]
- Berendsen H. J. C., van der Spoel D., and van Drunen R., Comput. Phys. Commun. 10.1016/0010-4655(95)00042-E 91, 43 (1995). [DOI] [Google Scholar]
- Miyamoto S. and Kollman P. A., J. Comput. Chem. 10.1002/jcc.540130805 13, 952 (1992). [DOI] [Google Scholar]
- Hess B., Bekker H., Berendsen H. J. C., and Fraaije J. G. E. M., J. Comput. Chem. 18, 1463 (1997). [DOI] [Google Scholar]
- Nosé S., Prog. Theor. Phys. 10.1143/PTP.103.1 103, 1 (1991). [DOI] [Google Scholar]
- Yoneya M., Berendsen H. J. C., and Hirasawa K., Mol. Simul. 13, 395 (1994). [Google Scholar]
- Slusher J. T. and Cummings P. T., Mol. Simul. 18, 213 (1996). [Google Scholar]
- Jang S. and Voth G. A., J. Chem. Phys. 10.1063/1.475247 107, 9514 (1997). [DOI] [Google Scholar]
- Yamamoto T., J. Chem. Phys. 10.1063/1.2202355 124, 217101 (2006). [DOI] [PubMed] [Google Scholar]
- Brooks B. R., Bruccoleri R. E., Olafson B. D., States D. J., Swaminathan S., and Karplus M., J. Comput. Chem. 10.1002/jcc.540040211 4, 187 (1983). [DOI] [Google Scholar]
- Kaminski G. A., Friesner R. A., Tirado-Rives J., and Jorgensen W. L., J. Phys. Chem. B 10.1021/jp003919d 105, 6474 (2001). [DOI] [Google Scholar]
- Bader J. S. and Chandler D., J. Phys. Chem. 96, 6423 (1992). [Google Scholar]
- Neumann M., J. Chem. Phys. 10.1063/1.448553 82, 5663 (1985). [DOI] [Google Scholar]
- Neumann M., J. Chem. Phys. 10.1063/1.451198 85, 1567 (1986). [DOI] [Google Scholar]
- Hummer G., Pratt L. R., Garcia A. E., Berne B. J., and Rick S. W., J. Phys. Chem. B 10.1021/jp964037a 101, 3017 (1997). [DOI] [Google Scholar]
- Ashbaugh H. S. and Wood R. H., J. Chem. Phys. 10.1063/1.473800 106, 8135 (1997). [DOI] [Google Scholar]
- Chipot C., Millot C., Maigret B., and Kollman P. A., J. Chem. Phys. 10.1063/1.468222 101, 7953 (1994). [DOI] [Google Scholar]
- Hunenberger P. H. and van Gunsteren W. F., J. Chem. Phys. 10.1063/1.476022 108, 6117 (1998). [DOI] [Google Scholar]
- Hummer G., Pratt L. R., and Garcia A. E., J. Phys. Chem. 10.1021/jp951011v 100, 1206 (1996). [DOI] [Google Scholar]
- Kastenholz M. A. and Huenenberger P. H., J. Chem. Phys. 124, 224501 (2006). [DOI] [PubMed] [Google Scholar]


