

Abstract
Matrix assisted laser desorption ionization (MALDI) mass spectrum images are created from an array of mass spectra collected over a tissue surface. We have increased the mass range of proteins that can be detected in tissue sections from kidneys of different rodent species, by a modification of the sandwich technique which involves co-crystallizing matrix with analyte. A tissue section is placed upon a drop of sinapinic acid matrix dissolved in 90% ethanol and 0.5% Triton X-100. Once the matrix has dried, a seed layer of sinapinic crystals is added as a dispersion in xylene. Additional layers of sinapinic acid are added as solutions in 90% ethanol followed by 50% acetonitrile. Numerous peaks with signal to noise ratio of four or greater are observed between 25 kDa to 50 kDa. This represents approximately 10 times as many peaks as are detected using traditional matrix spotting and spraying.
Keywords: Triton X-100, Matrix Assisted Laser Desorption Ionization-Time-of-Flight, MALDI-TOF, tissue imaging
Introduction
A matrix assisted laser desorption ionization (MALDI) tissue image is a three dimensional array of data with the plane of the tissue section representing the XY dimensions, and thousands of MALDI spectra acquired across the surface of the tissue representing the Z dimension [2]. Volumes, or m/z values, are extracted from the data set to create images of user defined m/z ranges [2]. One of the greatest challenges of this technique is ensuring matrix molecules co-crystallize with tissue proteins so that proteins can be ionized by the laser. Much of the pioneering work in MALDI-TOF MS tissue protein imaging was performed in the laboratory of Richard Caprioli [3-7]. The Caprioli laboratory has also produced fine images of small mass peptides and low mass proteins in rat kidneys [4, 8]. In spite of excellent progress in the past ten years, the available MALDI tissue imaging technologies have not been able to resolve m/z consistent with many protein products of transcripts which our laboratory such as the annexins [9], which range in mass from 35 to 39 kDa. Since the protein products of transcripts of interest to us are seldom less than 25 kDa, we developed a technique that would allow us to detect proteins of higher molecular mass.
One of the first methods of matrix application is spray coating with a nebulizer (Figure 1A) [10]. A more recent development employs acoustics to eject droplets of matrix onto the tissue [11]. These methods yield excellent results in the 2-25 kDa range, and an excellent signal from a ∼66 kDa, consistent in mass with serum albumin. Other signals, between 25-65 kDa, could not be distinguished from noise. Matrix spraying facilitates high spatial resolution [12] while matrix spotting confines delocalization to the dimensions of the matrix spot [11]. We sought to optimize spatial resolution, while minimizing delocalization, by utilizing a series of fixation steps derived from previous reports [10, 13].
Figure 1.
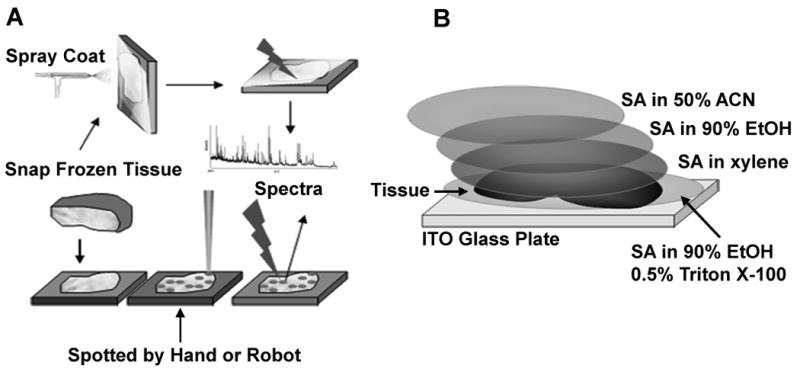
Traditional method and the modified sandwich method for tissue imaging. Snap frozen tissue is cut in 10-20 μm slices and mounted on a conductive MALDI plate. A. Sinapinic acid (SA) sprayed with a nebulizer or spotted either by hand or with a robot 10. B. In the modified sandwich method a 14 μm slice of frozen tissue is processed as illustrated and described in detail in the text.
Triton X-100, 4-(1,1,3,3-Tetramethylbutyl)phenyl-polyethylene glycol, is a widely used non-ionic surfactant used for recovery of membrane components under mild non-denaturing conditions; it is also compatible with MALDI-TOF MS at a concentration of 1% [14]. Others have used acid-cleavable detergents to improve resolution of membrane proteins in non-tissue imaging MALDI-TOF MS [15-17]. We have developed a variation of the sandwich matrix application for MALDI-TOF MS tissue imaging that allows excellent additional coverage in the 25-50 kDa range. Use of Triton X-100 aids in detection of higher m/z proteins in tissue.
Materials and Methods
Materials
Indium tin oxide coated glass slides (45×45×1.1 mm, 70-100Ω) were supplied by Delta Technologies (Stillwater, MN). Protein calibration standards [equine cytochrome C (12,361 Da), equine myoglobin (16,952 Da), bovine trypsinogen (23,982 Da), myoglobin dimer (33,904 Da)], and sinapinic acid (SA) were supplied by Sigma-Aldrich (St. Louis, MO). Triton X-100 was supplied by BioRad (Hercules, CA). Reagent grade ethanol (90% ethanol and 10% isopropanol) was supplied by VWR (West Chester, PA). Histology grade xylene and trifluoroacetic acid were supplied by EMD Biosciences (San Diego, CA).
Tissue harvesting
Mice and rats were euthanized by CO2 asphyxiation, and their kidneys were quickly removed and cut longitudinally. Kidneys were snap frozen on aluminum foil boats floating in liquid nitrogen or in polypropylene tubes dropped into liquid nitrogen. Care was taken to ensure that liquid nitrogen never came into contact with the tissue. Tissue was stored at −80°C until use.
Matrix solutions
Four SA matrix solutions (20 mg/ml) were used. “SA/EtOH/T” contained 90% reagent grade ethanol, 0.1% trifluoroacetic acid (TFA), 0.5% Triton X-100, and brought to volume with water. “SA/xylene” contained SA dispersed in histology grade xylene produced by sonication at maximum power in a Branson 2210 water bath sonicator for five minutes. “SA/EtOH” contained 90% reagent grade ethanol, and 0.1% TFA in water. “SA/ACN” contained 50% acetonitrile (ACN) and 0.1% TFA in water.
Tissue preparation
Kidneys were transported from the -80°C freezer to a Leica CM 1850 cryostat (Leica Microsystems AG, Welzlar, Germany) on dry ice. Forceps used to handle the tissue were stored on dry ice. Kidneys were mounted on cryostat chucks with Optimum cutting temperature (OCT) mounting medium (Leica Microsystems AG, Welzlar, Germany). Care was taken to ensure that OCT was not present on the tissue section because it too forms crystals with SA and contributes to the background MALDI signal. Organs were allowed to equilibrate to -17°C. After equilibration, 12 to 14 μm sections were cut.
The matrix application strategy is illustrated in Figure 1B. When a slice without major wrinkles was obtained, a drop of SA/EtOH/T was placed on the slide. Dry ice chilled forceps were used to place the tissue section on top of the drop of SA/EtOH/T solution. The amount of SA/EtOH/T was sufficient for a drop the same size as the tissue section, or slightly bigger; approximately 30 μl for a kidney section from a 200-250g rat. Slides were transferred to a vacuum desiccator and dried under house vacuum. Once dry, a drop of the SA/xylene suspension was placed on top of the tissue section. The amount added was enough to cover the surface just before surface tension failed to contain the liquid on the surface, approximately 30 μl for rat kidney sections. Vacuum was applied until dryness. When dry, SA/EtOH was added to cover the top and dried under vacuum. SA/ACN was added as the final top layer of matrix. Again the amount added was judged by surface tension, i.e. as much solution as could be added before flowing off the tissue section. On occasion, this caused the tissue sections to detach from the plate. Detached tissue sections were secured to the plate with 0.5-2 μl of a 25% v/v solution of OCT mounting medium dissolved in distilled water. Four 2 μl drops of calibration standard were placed on the MALDI plate at four corners of the tissue section or the array of tissue sections to be imaged. Adjacent slices were cut and stained with hematoxylin and eosin (H&E).
Instrument Settings
Images were acquired with an Applied Biosystems Voyager DE STR MALDI mass spectrometer (Applied Biosystems, Framingham, MA) in the linear mode. The accelerating voltage was 25,000 V, the guide wire voltage was 0.3% and the grid voltage was 90% of the accelerating voltage. The delay time was 800 nsec.
Image Acquisition
MALDI mass spectrometry images were acquired using MMSIT software (Novartis, Basel, Switzerland; www.MALDI-msi.org) [2]. To compare various matrix coating techniques, four tissue sections from a mouse kidney were arranged on a MALDI plate in a square shape. Single slices of rat kidneys per plate were used once initial matrix solutions were optimized with mouse kidneys. Four drops of calibration standard were placed around the samples. Spectra, composed of 25 shots each (or 150 total laser shots), were collected from the four calibration spots and averaged to create a calibration file. Calibration files were constructed using at least three of these standards. The accuracy of the calibration file was confirmed to be within 200 ppm of the expected values before image acquisition was started.
Image Processing
BioMAP software (Novartis, Basel, Switzerland) was used to analyze the image files created by MMSIT. After acquisition, if the difference in the observed values of the calibration standards was, on average, greater than 250 ppm, the image was rejected. Images of m/z were created by selecting an m/z region from a whole tissue average spectrum. The mean intensity of this region was calculated after baseline correction and exported to a new window. BioMAP performs this operation on a pixel-by-pixel basis. Pixels containing a threshold intensity less than 50 arbitrary units were discarded. Intensity scales used for presentation were determined by plotting the number of pixels as a function of bins of signal intensity, e.g. from 0 to 300 in bins every 10 intensity units.
Analysis
The whole tissue averaged spectra were exported from BioMAP as text files and imported into Voyager Data Explorer for further processing. Advanced baseline correction was performed, followed by peaks being defined with a signal to noise ratio (S/N) of ≥3 or ≥ 4 as noted in text. Noise was filtered using the “default” and “noise removal” options as noted. Statistical analysis was performed by 2-way ANOVA with Microsoft Excel. The caveats are that the data may not be parametric and population variance may not be equal.
Results and Discussion
Spray coating mouse kidney sections failed to yield robust signals, Figure 2A. Placing mouse kidney sections on a layer of dry sinapinic acid followed by spraying or spotting matrix on top of the tissue improved the signal (data not shown). Placing mouse kidney sections on top of sinapinic acid dissolved in 90% ethanol (SA/EtOH) and SA/EtOH supplemented with 0.5% Triton X-100 (SA/EtOH/T), considerably improved the signal (Figure 2B and C, respectively). Triton X-100 was added to the bottom layer because it has been reported to enhance MALDI signals from whole cell lysates [14]. Our results indicate a significant improvement, consistent with these previous findings. Similar results were achieved with 3-[3-(1,1-bisalkyloxyethyl)pyridin-1-yl]propane-1-sulfonate (PPS) [16] (not shown). Rather than adding additional SA/EtOH/T to the top layer of the tissue section, SA was added as a dispersion in the lipid disruptor/dehydrating agent xylene (SA/xylene) as another way of seeding matrix crystals on a tissue section [11, 18]. Although, wrinkling occasionally occurred when the second top layer of SA/ACN was added, when the first top layer of SA/ACN was replaced with SA/EtOH, wrinkling ceased to be a problem, without diminishing the signal intensity, Figure 2D. It should be noted that SA crystals do not properly form when ethanol is used as a solvent system. The final layer of SA/ACN is necessary to form SA/analyte crystals that yield a robust signal. A small peak around 15.8 kDa (black traces of Figure 2A-2C) suggests movement of tissue constituents by a percolating liquid, or leaching. Leaching of other proteins was generally not observed.
Figure 2.

Key points in the development of the enhanced method. A. High m/z signals are not obtained with spray coating 14 μm mouse kidney slices. The top spectrum is the average from the entire kidney section. A spectrum from analyte that leached from the kidney with the matrix is also shown. B. Mouse kidney sections (14 μm) placed upon a drop of SA/EtOH yield a better signal. C. Triton X-100 (SA/EtOH/T) in the bottom layer further improves the signal from mouse kidney sections. D. Replacement of SA/ACN with SA/EtOH as the 2nd top layer.
To test the hypothesis that protein solubility in EtOH/T was responsible for the leaching of proteins of the tissue, rat kidney sections were extracted with EtOH/T using a sonicating water bath. Three proteins at 5.5, 6.8, and 7.7 kDa were soluble in EtOH/T. Smaller analytes in the 2-3 kDa range were also observed. Unexpectedly, the 15.8 kDa protein was not soluble in EtOH/T. In summary, only one rat kidney protein in the 7-50 kDa range is soluble in EtOH/T, and only one tends to leach out during matrix application.
Triton X-100 increased the total number of peaks with S/N ≥ 3 (p<0.00005), whereas xylene caused a slight but significant (p<0.05) suppression in the total number of peaks in the whole section average spectrum of a mouse kidney, Table 1. The number of peaks above 20 kDa in a whole kidney section average spectrum were also increased by Triton X-100 (p<0.00005; Table 1) and slightly suppressed by xylene (p<0.01).
Table 1. Influence of preparation components on the number of proteins detected in mouse kidney cortex.
| Method | # Total Peaks | # Peaks > 20 kDa |
|---|---|---|
| Control | 134 ± 8 | 42 ± 4 |
| Triton X-100 alone | 165 ± 5 | 68 ± 4 |
| Xylene alone | 122 ± 4 | 31 ± 5 |
| Triton X-100 and Xylene | 151 ± 4 | 52 ± 5 |
Values are means ± standard error, with S/N ≥3 (n=6).
Only one protein in the 7-50 kDa range is detectable as being soluble in EtOH/T. We have ample evidence that numerous proteins are soluble in 50% acetonitrile and 0.1% TFA. The essence of the modified sandwich strategy is to seed SA crystals as densely as possible throughout the tissue section before SA/ACN is added. Densely packed seed crystals quicken crystallization and minimize analyte diffusion. Thus the decreased analyte diffusion outweighs the slight decrease in the total number of peaks detected.
The beneficial effect of Triton X-100 in Table 1 can be explained by previous work demonstrating found that Triton X-100 increased the signal from higher mass proteins [14]. These authors speculated that Triton X-100 clears the cell lysate and breaks up larger agglomerate micelles, containing hydrophobic proteins, into smaller detergent containing micelles [14]. Hydrophobic proteins were speculated to have become supersaturated, preferentially forming crystals with matrix over hydrophilic proteins [14].
While the explanation of why Triton X-100 enhances the MALDI signal offered by Bornsen [14] is insightful, explaining why the modified sandwich method works remains a great challenge. We hypothesize that the extracellular matrix (collagen, laminins, fibronectin, etc) plays an important role in facilitating the preservation of tissue structure when it is placed on the drop of SA/EtOH/T. The extracellular matrix is intimately connected to cytoskeletal proteins by proteins such as the integrins. We anticipate that water soluble proteins are precipitated with surrounding water insoluble cytoskeletal and extraceullular proteins when surrounding water is replaced with SA/EtOH/T. The extracellular matrix and cytoskeletal proteins are thus hypothesized to hold the tissue section in a porous structure when it is placed on top of SA/EtOH/T and in this manner tissue structure should influence the quality of the image. Spectra illustrated in Figure 3 substantiate this view. The 20-50 kDa region of the spectrum of rat brain, lung, and heart are compared. The heart is without question a force-bearing organ with extensive networks of actin and myosin attached to an extracellular matrix. The heart yields the best higher m/z signal of all of the rat organs that have been profiled. Moreover, overall signal intensity across the entire m/z range is superior from heart tissue. In contrast, the overall signal intensities obtained from brain and lung are suppressed relative to the heart. Although the lung is also a force-bearing organ, it also contains alveoli that are filled with air. However, the alveoli likely collapse when the lung section is placed on top of SA/EtOH/T, and consequently the signal from high m/z proteins in the lung is poorer than other rat organs that have been profiled using the modified sandwich technique. Finally, while the intensity of the ubiquitous 42 kDa protein tends not to be as strong in the brain as it is in the heart, the overall quality of this higher m/z signal is very good. Interestingly, although the brain does not bear any force, it does possess an intricate network of extracellular matrix proteins, especially myelin (myelin sheaths incorporate a high content of actin filaments and microtubules), and glial/neuronal adhesion molecules that are essential to maintain appropriate intercellular communication. As such, based upon our observations, one would anticipate such a tissue matrix to be amenable to the improved tissue preparation protocol described herein.
Figure 3. Comparison of high m/z signal intensity in rat heart, lung and brain.

MALDI spectra derived from a rat kidney section impregnated with matrix via the modified sandwich technique are shown in Figure 4. While others have performed MALDI on stained tissue sections [7, 19-21], this is not possible with the current technique. Figure 4B shows part of a BioMAP graphics user interface used to align the H&E stained tissue section with the total ion current (TIC) of the MALDI image. Note that while it is obvious that the two slices came from close regions of the same kidney, there are some regions in which there are H&E stained tissue (black) but not MALDI image (yellow), and vice versa. Also note that in most regions there is overlap (green). Regions of interest (ROI) were defined as the: medulla (med), inner stripe of the outer medulla (ISOM), outer stripe of the outer medulla (OSOM), and cortex, Figure 4A. These ROI were copied and pasted onto the MALDI image. Spectra from these regions were averaged and exported as text files to be processed in Voyager Data Explorer. Advanced baseline corrections were performed and a “noise removal” filter applied. Higher m/z portions of the spectrum are compared in Figure 4E.
Figure 4.
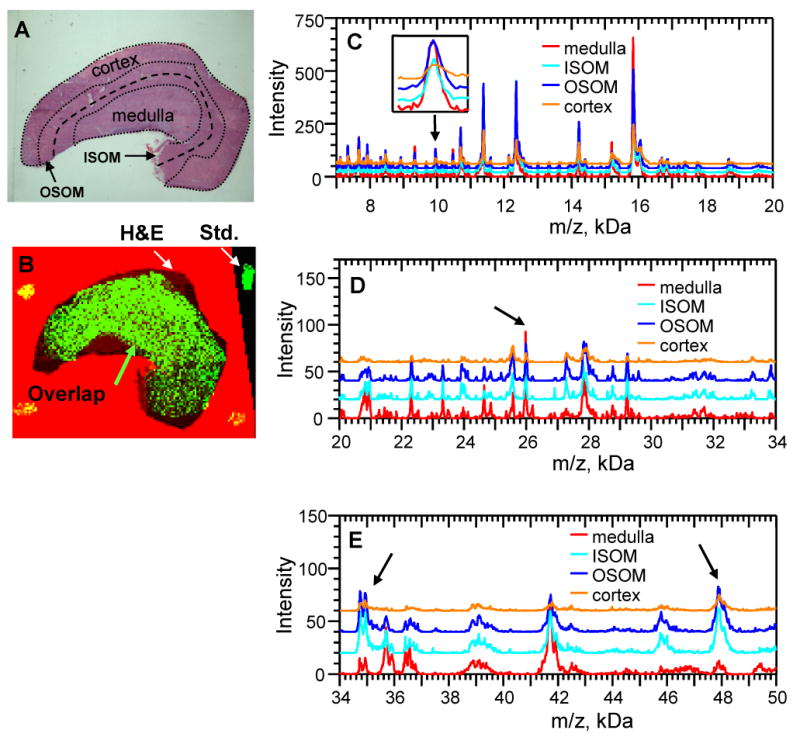
Regional spectra from the rat kidney. A. An H&E stained slice adjacent to the one used for mass spectral imaging (ISOM, inner stripe of the outer medulla; OSOM, outer stripe of the outer medulla). B. The H&E stained image (black) aligned with the total ion current (TIC), with overlap shown in green. C-E. Composite spectra of the regions in panel A. Arrows mark peaks chosen for imaging in Figures 5 and 6.
The number of peaks per kidney region with S/N ≥ 4 (default noise filter) from a section impregnated with matrix using the modified sandwich method were also determined. These were then compared with those found in a rat kidney section spotted with matrix [4], as shown in Table 2. A representative kidney section spotted with matrix was used for comparison; a >10 fold increase of signal was seen in the number of proteins with a molecular mass greater than 25 kDa.
Table 2. Peaks with S/N ≥ 4 in four regions of the rat kidney.
| Method | Mass Range | Medulla | ISOM | OSOM | Cortex |
|---|---|---|---|---|---|
| Current Modified Sandwich | 7-50 kDa | 135 | 177 | 148 | 108 |
| 25-50 kDa | 27 | 53 | 36 | 18 | |
| Traditional Matrix Spotting | 7-70 kDa | 105 | 100 | 111 | 119 |
| 25-70 kDa | 0 | 0 | 1 | 1 |
Spectra from entire regions, as indicated, were averaged in BioMAP, imported into Data Explorer as ascii files, and processed as indicated in the text. Peaks were defined based on a S/N ≥ 4.
Image processing is a task where the field of MALDI-TOF MS tissue imaging lacks standards, although some proposals have been presented [22]. Others have addressed noisy spectra of poor quality by digitally sampling each matrix spot 20 times to create an average spectrum for that pixel/matrix spot [22]. Pending some universal consensus or standard, we present here raw MALDI-TOF MS images of low, medium and high m/z protein signals (Figures 5 and 6). The 9950 and 25,980 Da peaks appear to be slightly more intense in the medulla region, Figure 4C and 4D. More signal originates from the MALDI image in Figure 5, i.e. more white pixels as opposed to dark green. The 47,900 and 34,940 Da peaks are more prominent in ISOM and the OSOM, Figure 4E. Although the 34,940 Da protein is found in the medulla, the intensity in individual pixels is not as great as that found in the ISOM and OSOM. The 47,900 Da protein is localized more to the ISOM and OSOM, Figure 6.
Figure 5.
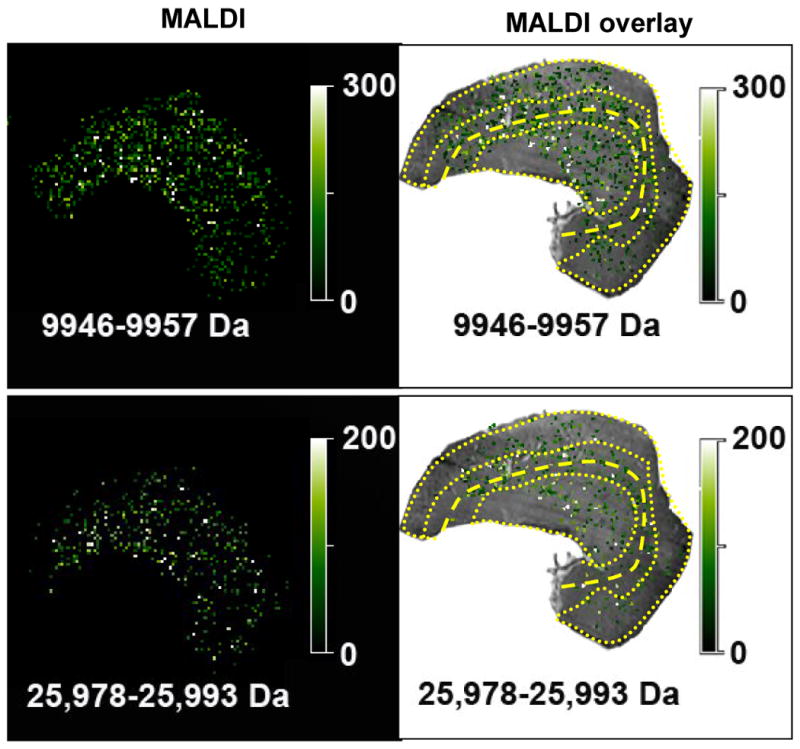
MALDI and MALDI overlay images of the proteins indicated by arrows in Figure 4C & 4D.
Figure 6.
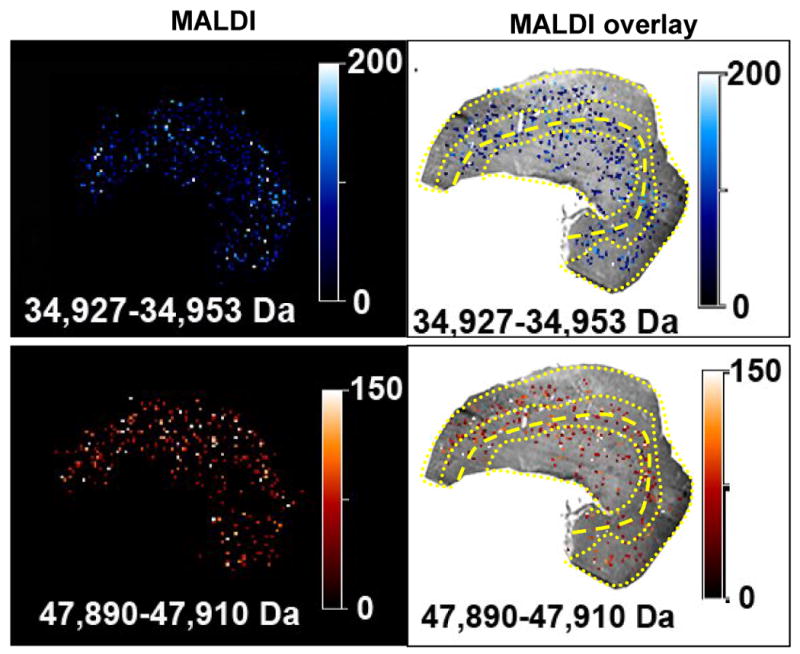
MALDI and MALDI overlay images of the proteins indicated by arrows in Figure 4E.
Other interesting methods that may be very compatible with our method are matrix coating by sublimation [18] and matrix coating by an ink jet sprayer [23]. It should be noted that the enhanced method resembles other methods utilizing multiple steps of matrix deposition, one of them being a seed layer [24]. Another powerful method uses matrix solutions that fix the tissue at the same time enabling immunohistochemistry subsequent to tissue imaging [13]. While the modified sandwich method uses matrix solutions intended to precipitate proteins or fix tissue sections, it differs from this method in that matrix is impregnated throughout the tissue section, making removal and maintaining histology impossible. With the recent report of a production of a high resolution MALDI mass spectrometer [12] there will be an increased requirement for a method of matrix impregnation that allows for robust signals at high m/z ranges, at step sizes as small as 7 μm [12].
Several methodologies are being used to identify proteins observed in MALDI tissue images. The simplest method is to resolve proteins in the tissue used for the MALDI image by SDS PAGE, excise the appropriate bands, digest with trypsin, and sequence by LC MS/MS [4]. Our own group has successfully identified several of the higher m/z proteins by this approach (unpublished data). This method is satisfactory when the expected m/z with annotated post-translational processing is similar or identical to the m/z observed in tissue images. Chromatographic techniques have also been used to isolate proteins responsible for m/z signals observed in MALDI images [8]. This approach can be particularly unambiguous when the protein extracted from the tissue can be ionized by MALDI to yield the same m/z as observed in the tissue section. Our group has also used a knowledge-based approach to enrich for a particular protein with the same mass as the observed m/z in a tissue image. This method has the potential to be expedient and can often identify other m/z signals observed in the tissue image (unpublished data).
Conclusion
Traditional techniques of matrix application for imaging mass spectrometry have yielded robust signals below 25 kDa, with the occasional detection of serum albumin at 66 kDa. Our modified sandwich method provides robust and enhanced signals above 25 kDa with the potential to go above 100 kDa.
Acknowledgments
We thank various members of the Arizona Proteomics Consortium including Dr. Todd Mize and Ms. Andrea Hunt for technical support. We also thank Dr. Pierre Chaurand and other members of the Caprioli laboratory at Vanderbilt University for their initial assistance in MALDI tissue imaging. This study was supported by a GM070890 (SSL) and Philip Morris External Research Program (TJM and SSL). The authors also acknowledge support by NIEHS Center Grant P30 ES06694.
Abbreviations
- MALDI-TOF
matrix assisted laser desorption ionization-time of flight
- Triton X-100
4-(1,1,3,3-Tetramethylbutyl)phenyl-polyethylene glycol
- SA
sinapinic acid
- ROI
region of interest
- EtOH
ethanol
- ACN
acetonitrile
- S/N
signal to noise ratio
- m/z
mass to charge ratio
Footnotes
A Preliminary account of this work was presented at the 2006 Annual Meeting of the ASMS [1].
Publisher's Disclaimer: This is a PDF file of an unedited manuscript that has been accepted for publication. As a service to our customers we are providing this early version of the manuscript. The manuscript will undergo copyediting, typesetting, and review of the resulting proof before it is published in its final form. Please note that during the production process errors may be discovered which could affect the content, and all legal disclaimers that apply to the journal pertain.
References
- 1.Leinweber BD, Monks TJ, Lau SS. The Ethanol Triton X-100 Sandwich Method Yields High Resolution and m/z MALDI Mass Spectral Images on Tissue. J Am Soc Mass Spectrom. 2006;17(5) 1:111S. [Google Scholar]
- 2.Stoeckli M, Farmer TB, Caprioli RM. Automated mass spectrometry imaging with a matrix-assisted laser desorption ionization time-of-flight instrument. J Am Soc Mass Spectrom. 1999;10(1):67–71. doi: 10.1016/S1044-0305(98)00126-3. [DOI] [PubMed] [Google Scholar]
- 3.Caprioli RM, Farmer TB, Gile J. Molecular imaging of biological samples: localization of peptides and proteins using MALDI-TOF MS. Anal Chem. 1997;69(23):4751–60. doi: 10.1021/ac970888i. [DOI] [PubMed] [Google Scholar]
- 4.Chaurand P, Norris JL, Cornett DS, Mobley JA, Caprioli RM. New developments in profiling and imaging of proteins from tissue sections by MALDI mass spectrometry. J Proteome Res. 2006;5(11):2889–900. doi: 10.1021/pr060346u. [DOI] [PubMed] [Google Scholar]
- 5.Chaurand P, Schwartz SA, Reyzer ML, Caprioli RM. Imaging mass spectrometry: principles and potentials. Toxicol Pathol. 2005;33(1):92–101. doi: 10.1080/01926230590881862. [DOI] [PubMed] [Google Scholar]
- 6.Chaurand P, Stoeckli M, Caprioli RM. Direct profiling of proteins in biological tissue sections by MALDI mass spectrometry. Anal Chem. 1999;71(23):5263–70. doi: 10.1021/ac990781q. [DOI] [PubMed] [Google Scholar]
- 7.Cornett DS, Mobley JA, Dias EC, Andersson M, Arteaga CL, Sanders ME, Caprioli RM. A novel histology directed strategy for MALDI-MS tissue profiling that improves throughput and cellular specificity in human breast cancer. Mol Cell Proteomics. 2006;5(10):1975–83. doi: 10.1074/mcp.M600119-MCP200. [DOI] [PubMed] [Google Scholar]
- 8.Meistermann H, Norris JL, Aerni HR, Cornett DS, Friedlein A, Erskine AR, Augustin A, De Vera Mudry MC, Ruepp S, Suter L, Langen H, Caprioli RM, Ducret A. Biomarker discovery by imaging mass spectrometry: Transthyretin is a biomarker for gentamicin-induced nephrotoxicity in rat. Mol Cell Proteomics. 2006;5(10):1876–86. doi: 10.1074/mcp.M500399-MCP200. [DOI] [PubMed] [Google Scholar]
- 9.Patel SK, Ma N, Monks TJ, Lau SS. Changes in gene expression during chemical-induced nephrocarcinogenicity in the Eker rat. Mol Carcinog. 2003;38(3):141–54. doi: 10.1002/mc.10153. [DOI] [PubMed] [Google Scholar]
- 10.Schwartz SA, Reyzer ML, Caprioli RM. Direct tissue analysis using matrix-assisted laser desorption/ionization mass spectrometry: practical aspects of sample preparation. J Mass Spectrom. 2003;38(7):699–708. doi: 10.1002/jms.505. [DOI] [PubMed] [Google Scholar]
- 11.Aerni HR, Cornett DS, Caprioli RM. Automated acoustic matrix deposition for MALDI sample preparation. Anal Chem. 2006;78(3):827–34. doi: 10.1021/ac051534r. [DOI] [PubMed] [Google Scholar]
- 12.Chaurand P, Schriver KE, Caprioli RM. Instrument design and characterization for high resolution MALDI-MS imaging of tissue sections. J Mass Spectrom. 2007;42(4):476–89. doi: 10.1002/jms.1180. [DOI] [PubMed] [Google Scholar]
- 13.Agar NY, Yang HW, Carroll RS, Black PM, Agar JN. Matrix Solution Fixation: Histology-Compatible Tissue Preparation for MALDI Mass Spectrometry Imaging. Anal Chem. 2007;79(19):7416–23. doi: 10.1021/ac071460e. [DOI] [PubMed] [Google Scholar]
- 14.Bornsen K, Gass M, Bruin G, von Adrichem J, Biro M, Kresbach G, Ehrat M. Influence of solvents and detergents on matrix-assisted laser desorption/ionization mass spectrometry measurements of proteins and oligonucleotides. Rapid Commun Mass Spectrom. 1997;11(6):603–9. doi: 10.1002/(SICI)1097-0231(199704)11:6<603::AID-RCM879>3.0.CO;2-U. [DOI] [PubMed] [Google Scholar]
- 15.Norris JL, Hangauer MJ, Porter NA, Caprioli RM. Nonacid cleavable detergents applied to MALDI mass spectrometry profiling of whole cells. J Mass Spectrom. 2005;40(10):1319–26. doi: 10.1002/jms.914. [DOI] [PubMed] [Google Scholar]
- 16.Norris JL, Porter NA, Caprioli RM. Mass spectrometry of intracellular and membrane proteins using cleavable detergents. Anal Chem. 2003;75(23):6642–7. doi: 10.1021/ac034802z. [DOI] [PubMed] [Google Scholar]
- 17.Norris JL, Porter NA, Caprioli RM. Combination detergent/MALDI matrix: functional cleavable detergents for mass spectrometry. Anal Chem. 2005;77(15):5036–40. doi: 10.1021/ac050460g. [DOI] [PubMed] [Google Scholar]
- 18.Hankin JA, Barkley RM, Murphy RC. Sublimation as a method of matrix application for mass spectrometric imaging. J Am Soc Mass Spectrom. 2007;18(9):1646–52. doi: 10.1016/j.jasms.2007.06.010. [DOI] [PMC free article] [PubMed] [Google Scholar]
- 19.Chaurand P, Schwartz SA, Billheimer D, Xu BJ, Crecelius A, Caprioli RM. Integrating histology and imaging mass spectrometry. Anal Chem. 2004;76(4):1145–55. doi: 10.1021/ac0351264. [DOI] [PubMed] [Google Scholar]
- 20.Chaurand P, Schwartz SA, Capriolo RM. Profiling and imaging proteins in tissue sections by MS. Anal Chem. 2004;76(5):87A–93A. [PubMed] [Google Scholar]
- 21.Johnson MD, Floyd JL, Caprioli RM. Proteomics in diagnostic neuropathology. J Neuropathol Exp Neurol. 2006;65(9):837–45. doi: 10.1097/01.jnen.0000235116.67558.24. [DOI] [PubMed] [Google Scholar]
- 22.Norris JL, Cornett DS, Mobley JA, Andersson M, Seeley EH, Chaurand P, Caprioli RM. Processing MALDI Mass Spectra to Improve Mass Spectral Direct Tissue Analysis. Int J Mass Spectrom. 2007;260(23):212–221. doi: 10.1016/j.ijms.2006.10.005. [DOI] [PMC free article] [PubMed] [Google Scholar]
- 23.Baluya DL, Garrett TJ, Yost RA. Automated MALDI matrix deposition method with inkjet printing for imaging mass spectrometry. Anal Chem. 2007;79(17):6862–7. doi: 10.1021/ac070958d. [DOI] [PubMed] [Google Scholar]
- 24.Sugiura Y, Shimma S, Setou M. Two-step matrix application technique to improve ionization efficiency for matrix-assisted laser desorption/ionization in imaging mass spectrometry. Anal Chem. 2006;78(24):8227–35. doi: 10.1021/ac060974v. [DOI] [PubMed] [Google Scholar]