

Abstract
We examined the effects of viewing high-arousal pictures on regional brain activations elicited by a cognitive control task in participants with high-functioning autism and neurotypical controls. Specifically, using event-related functional magnetic resonance imaging, we assessed the effects of brief presentations of highly arousing pictures (i.e., both very pleasant and very unpleasant) on the processing of stimuli requiring cognitive control. Similar to previous findings, when stimuli with high cognitive control demands were preceded by low-arousal pictures, individuals with autism demonstrated regional brain activations that were comparable to neurotypical control individuals. When the presentation of the cognitive control stimuli was preceded by high-arousal pictures, however, the control group was characterized by relatively greater activation in the right lateral midfrontal cortex in response to cognitive control stimuli. In contrast, preceding high-arousal stimuli did not modulate activity elicited in this region by cognitive control stimuli in the autism group. Differential modulation of right lateral midfrontal activation by high-arousal stimuli in autism is consistent with the “inefficiency model” of brain functioning in autism spectrum disorders, and contributes to a growing body of evidence that autism may be characterized by anomalous sensitivity of cognitive control brain regions to social-emotional context.
Keywords: Autism, Cognitive Control, Attention, Arousal, Functional Magnetic Resonance Imaging, fMRI
1. Introduction
Autism is a complex and pervasive neurodevelopmental disorder characterized by impairments in social interaction, impairments in communication, and restricted and repetitive behaviors and interests (American Psychiatric Association., 1994). Although to date the majority of functional magnetic resonance imaging (fMRI) research has focused on deficits in processing social information, including studies of imitation (Williams et al., 2006), judging intentions based on the eyes (Baron-Cohen et al., 1999), mentalizing (Castelli et al., 2002), grasping the intentions of others (Pelphrey et al., 2005), and theory of mind (Happe et al., 1996), there has been recent renewed interest in the functional brain correlates of the symptom domain of restricted and repetitive behaviors in autism.
Restricted repetitive behaviors in autism may reflect poor cognitive control abilities (i.e., so-called “executive” abilities) that interfere with behavioral modulation (Turner, 1997, 1999; Hughes et al., 1994; Ozonoff et al., 1991; Lopez et al., 2005). The link between deficits in cognitive control and restricted repetitive behaviors in autism is supported by a number of factors, including: (1) the co-occurrence of impaired cognitive control and restricted repetitive behaviors in other forms of psychopathology (Frith and Done, 1990); (2) associations between performance on tasks designed to tap cognitive control abilities and severity of specific classes of restricted repetitive behavior symptoms in autism (Frith, 1989; Wing and Gould, 1979; Turner, 1997, 1999); and (3) deficits in autism on neuropsychological tasks measuring executive functioning, particularly in the domain of planning, cognitive flexibility, and cognitive switching (see, Hill, 2004 for a review).
Symptoms of restricted repetitive behaviors in autism have been conceptualized within the broad framework of autism as a disorder of the frontostriatal system (Bradshaw, 2001; Russell, 1997), and neuroimaging data provide direct validation of frontostriatal dysfunction in this disorder. Prefrontal hypoactivation in individuals with autism has been demonstrated using “theory of mind” tasks (the left inferior frontal gyrus and right insula in Baron-Cohen et al., 1999), visual searches for embedded figures (the right inferior and right middle frontal gyri in Ring et al., 1999), selective attention paradigms (the left inferior and left middle frontal gyri in Belmonte and Yurgelun-Todd, 2003), target detection tasks (the right inferior frontal gyrus, left anterior cingulate, and right midfrontal gyrus in Gomot et al., 2006; right dorsolateral prefrontal cortex, left insula, and left basal ganglia in Shafritz et al., in press), and a “go-no-go” task (right insula/inferior frontal gyrus in Kana et al., 2007) (but see Schmitz et al., 2006; Just et al., 2006 for exceptions).
Our research group recently employed a variant of the Attention Network Test (ANT, Fan and Posner, 2004; Fan et al., 2002), a task originally designed to assess the integrity of attentional and executive networks, to investigate the neural mediators of cognitive control in autism (Dichter and Belger, 2007). We examined one sub-domain of cognitive control, the inhibition of responding to interfering visual information, with the so-called “executive attention” component of the ANT. This task requires participants to indicate the orientation of a centrally-presented arrow in the presence of flanking congruent or incongruent arrows, with the latter condition imposing higher cognitive control demands. The incongruent condition has been shown to recruit the lateral midfrontal cortex, the anterior cingulate and the inferior frontal gyrus (MacDonald et al., 2000; Fan et al., 2005; Bush et al., 2000) and orienting to this task has been shown to activate parietal regions (Fan et al., 2005). We found that although activation of these brain regions in response to the original version of this task that employed arrow stimuli was not different in autism, activation of the cognitive control network was markedly diminished in the autism group when the arrow stimuli were replaced by gaze stimuli in the visual display, suggesting that these cognitive control regions may be hypoactive under social-cognitive demands relevant to this disorder.
Although the Dichter and Belger (2007) study was not designed to test the mechanism of hypoactivation of cognitive control brain structures in response to social stimuli, in light of recent evidence that viewing social-cognitive stimuli activates brain regions that mediate arousal in autism (Dalton et al., 2005), we speculated that cognitive control brain regions are hypoactive not only under social-cognitive conditions, but more broadly under conditions of increased emotional arousal in autism. The present study sought to investigate this premise by assessing BOLD responses with fMRI when cognitive control stimuli are preceded by pictures selected to induce high levels of arousal. High-and low-arousal pictures were selected from the International Affective Picture System (IAPS, Lang et al., 1997), a set of pictures that have been normed on the dimensions of pleasure an arousal, because of evidence of a positive linear relation between the arousing quality of IAPS pictures and brain systems mediating arousal (Sabatinelli et al., 2005).
The ANT was originally designed to measure the efficiency of three attentional networks, namely a cognitive control network mediating conflict resolution and error detection, an orienting network that directs and enhances the processing system, and an alerting network that prepares the system by maintaining cognitive activation (Fan et al., 2002). Recent research has investigated interactions among these three networks. Relevant in the present context, studies of the effects of alerting on cognitive control have documented decreased activation of portions of the frontal lobes during periods of heightened alertness (Cohen et al., 1988), a phenomenon subsequently termed “clearing of consciousness” (Posner, 1994). Behavioral evidence of this phenomenon in non-clinical populations is provided by studies documenting a larger incongruency effect when ANT visual conflict stimuli were preceded by a visual alerting cue (Fan et al., 2002) or an auditory alerting tone (Callejas et al., 2005), suggesting an enhancement of the effect of flanker interference during conditions of increased arousal. Because of these findings documenting the modulatory effects of arousal on frontal lobe activity during cognitive control conditions, our hypotheses focused on modulation of frontal lobe activation induced by viewing high-arousal pictures immediately prior to viewing cognitive control stimuli.
Consistent with prior our findings (Dichter and Belger, 2007), we hypothesized that diagnostic groups would not differ in regional brain activations in response to incongruent stimuli preceded by low-arousal pictures. However, based on behavioral evidence, reviewed above, of a larger incongruency effect in nonclinical contexts when these visual conflict stimuli are preceded by arousing cues (Fan et al., 2002; Callejas et al., 2005), we hypothesized that when the incongruent arrows were preceded by high-arousal pictures, the resulting state of increased arousal would prompt greater incongruency effects in lateral midfrontal regions in the control group.
However, based on our prior findings that brain regions mediating cognitive control show hypoactivation in autism when stimuli are faces (Dichter and Belger, 2007) and evidence that viewing faces recruits brain regions mediating arousal in autism (Dalton et al., 2005), we hypothesized that the autism group would demonstrate frontal hypoactivation in the high-arousal incongruent condition. The conceptual basis of this hypothesis is the so-called “inefficiency model of autism” that suggests that individuals with autism are impaired with respect to updating the scope and focus of selective attention (Burack et al., 1997). We hypothesized that such inefficient attentional allocation would be particularly evident in autistic participants when cognitive control stimuli were immediately preceded by stimuli designed to increase physiologic arousal.
2. Method
2.1 Participants
Twenty-two right-handed male neurotypical control participants (25.1 ± 6.0 years old, range=18.5-38.9) were recruited from the community and screened against major psychiatric illness, developmental disability, and neurological problems. The autism group consisted of twelve right-handed males (23.2 ± 5.8 years old, range=18.9-35.8) identified as high-functioning who were recruited through the North Carolina Neurodevelopmental Disorders Research Center Subject Registry and the Treatment and Education of Autistic and Related Communication Handicapped Children (TEACCH) program in Chapel Hill, North Carolina, USA. Participants consented to a protocol approved by the local Human Investigations Committees and met criteria for DSM-IV Asperger’s Disorder or High Functioning Autism. All participants with autism had Verbal IQ and Performance IQ ≥ 80 on the Weschler Abbreviated Scale of Intelligence (WASI, Weschler, 1999). Exclusion criteria included a prior history of gestational age <34 weeks, birth weight <2000 grams, intraventricular hemorrhage, history of known medical condition associated with autism including Fragile X syndrome, tuberous sclerosis, neurofibromatosis, phenylketouria, epilepsy and gross brain injury, or MRI contraindications. Participants were paid $40 for completing the imaging portion of the study. Because gender modulates regional brain activation in response to viewing affective pictures (Sabatinelli et al., 2004), for this preliminary investigation we recruited only male participants.
For the autism group, the average (SD) intelligence quotient (IQ) scores as measured by the WASI were: full scale = 106.9 (19.2), verbal = 104.9 (19.2) and performance = 107.6 (18.4). Average (SD) ADI-R algorithmic scores were: 18.7 (5.4) for the Reciprocal Social Interaction Domain, 15.9 (4.8) for the Communication Domain, 5.3 (1.9) for the Restricted, Repetitive, and Stereotyped Patterns of Behavior Domain, and 3.0 (1.9) for the Onset Domain. Average (SD) ADOS-G algorithmic scores were 4.3 (2.0) for the communication domain, 7.5 (3.0) for the social interaction domain, 1.2 (0.7) for the imagination/creativity domain. Diagnoses were based on a history of clinical diagnosis of autism, parental interview (Autism Diagnostic Interview-Revised [ADI-R]; Lord et al., 1994), and proband assessment (Autism Diagnostic Observation Schedule [ADOS]; Lord et al., 2000). Standard clinical ADI-R and ADOS algorithm cutoffs were employed.
Intelligence scores were collected from 15 of the 22 neurotypical participants. For these participants, average (SD) WASI IQ scores were: full scale = 109.8 (16.6), verbal = 108.9 (17.5) and performance = 108.4 (13.9). Intelligence scores did not differ between the autism group and the subset of the control group with available WASI scores, P’s> 0.50. The seven control participants without WASI scores were all university graduates or undergraduate students at the time of study participation.
2.2 fMRI Task
Participants performed an event-related reaction time flanker task modeled after the ANT developed by Fan and colleagues (2002). The fMRI session consisted of 10 task runs (6 min 12 sec each) with stimuli presented centrally against a white background. The baseline frequent condition (87% of trails) consisted of arrows flanked by horizontal lines (“neutral arrows”). Infrequent trials included either arrows flanked by same-direction arrows (‘congruent arrows’, 6.5% of the trials) or arrows flanked by opposite-direction arrows (‘incongruent arrows’, 6.5% of the trials).
Infrequent trials were presented every 6-8 trials (i.e., every 12-16 s) to adequately observe the full deployment of the hemodynamic response for each event. Each trial began with the tachistoscopic presentation of a low- or high-arousal picture for 200 ms. This brief duration selected to preclude saccadic eye movements and resulting gaze fixation differences between diagnostic groups. At the offset of the picture, an arrow stimulus was presented for 1700 ms or until the participant made a response, whichever came first. During the interval between trials, a variable-duration fixation cross was presented such that stimulus onset asynchrony (SOA) between arrow trials was held constant at 2000 ms. Participants made a response using their right hand via a button box press as quickly as possible to indicate the direction (left or right) of the central arrow stimulus.
High- and low-arousal pictures were drawn from the IAPS and were altered to be equivalent in luminosity using a custom MATLAB routine. Pictures were selected on the basis of normative male ratings of pleasure and arousal (Lang et al., 1999). We employed 38 “high-arousal” pictures (e.g., erotic pictures) and 67 “low-arousal” pictures (e.g., common household objects) 1. “High-arousal” pictures had normative arousal ratings (9 = most arousing, 1 = least arousing) of greater than 6.5 (mean [SD] = 7.1. [1.9]) and varied with respect to normative pleasure ratings (9 = most pleasant; 1 = most unpleasant, mean [SD] = 6.5. [1.9]). “Low-arousal” pictures had normative arousal ratings of less than 3.0 (mean [SD] = 2.5. [0.3]) and were mostly neutral with respect to normative pleasure ratings (mean [SD] = 5.0. [0.6]). High- and low-arousal pictures were equated on content (i.e., a relatively equal proportion of the high- and low-arousal pictures contained scenes, objects, animals, or faces). Twelve of the 38 high-arousal pictures contained faces. Nineteen of the 66 low-arousal pictures contained faces. Pictures were selected without replacement before being selected again to minimize repeated viewing of the same pictures.
Immediately prior to the scanning session, participants were trained on the task. All stimuli were presented using CIGAL presentation software and displayed to participants in the scanner through magnet-compatible goggles (Resonance Technology, Inc., Northridge CA). Accuracy and reaction time data were acquired for all responses. After the scanning session was complete, participants viewed the pictures again, outside the scanner, and rated them on the dimensions of pleasure and arousal.
2.3 Imaging Methods
Scanning was performed on a General Electric Health Technologies, 3 Tesla Signa Excite HD scanner system with 50-mT/m gradients (General Electric, Waukesha, Wisconsin, USA). An eight-channel head coil was used for parallel imaging. The participant’s head was immobilized using a vacuum cushion and tape. Sixty-eight high resolution images were acquired using a 3D fast SPGR pulse sequence (TR = 500 ms; TE = 20 ms; FOV = 24 cm; image matrix = 2562; voxel size = 0.9375 × 0.9375 × 1.9 mm) and used for coregistration with the functional data. These structural images were aligned in the near axial plane defined by the anterior and posterior commissures. Whole brain functional images were acquired using a gradient-recalled inward spiral pulse sequence (Glover and Law, 2001) sensitive to blood oxygenation level dependent (BOLD) contrast (TR, 1500 ms; TE, 35 ms; FOV, 24 cm; image matrix, 642; α = 62°; voxel size, 3.75 × 3.75 × 3.8 mm; 34 axial slices). These functional images were co-planar with the structural images. A semi-automated high-order shimming program ensured global field homogeneity. Runs began with 4 discarded RF excitations to allow for steady state equilibrium.
2.4 Imaging Data Analysis
Our data analysis strategy was consistent with prior work from our research group (e.g., Dichter and Belger, 2007; Yucel et al., 2007; Dolcos et al., 2007) and utilized an epochal, rather than General Linear Model (GLM)-based, approach. Although both approaches are valid and have methodological strengths and weaknesses, an epochal analysis strategy is well-suited to extracting condition-specific activation timecourses. Our data analysis procedures consisted of four components, all described in greater detail below. First, standard preprocessing steps were performed. Second, a whole-brain voxel-based analysis allowed for an exploratory examination of regional activation patterns for each condition. Third, random-effects contrast analyses allowed for within-groups examinations of differential activation patterns in response to specific condition contrasts. Fourth, regional hemodynamic response (HDR) timecourses corresponding to the random-effects contrasts detected in the preceding steps were extracted to conduct between-groups tests. This analysis strategy allowed for examinations of within-groups activation patterns as well as between-groups tests of condition-specific timecourse amplitudes and voxel counts.
Prior to statistical analyses, head motion was analyzed by center of mass measurements in three orthogonal planes. Imaging epochs with mean intensities greater than three standard deviations of the average intensity in a run were excluded from analyses. Data from two autism participants were excluded from further analyses due to excessive motion.
Image preprocessing was performed with custom programs and SPM modules (Wellcome Department of Cognitive Neurology, London). Functional images were corrected for time of acquisition within a TR and head motion, and were co-registered and normalized into a standard stereotaxic space (Montreal Neurological Institute) for intersubject comparisons. Head motion was detected by center of mass measurements. No subject had greater than a 3-mm deviation in the center-of-mass in any plane. A smoothing filter of 8 mm full-width at half-maximum (FWHM) was applied following normalization. These normalized and smoothed data were used in the analysis procedures described below. Only epochs during which participants made a correct button-press were included in analyses.
Whole-brain, voxel-based analyses consisted of both group-averaged activation maps in response to individual conditions as well as random-effects contrast maps. Group-averaged activation maps were computed by excising from the continuous time series of volumes the epoch of image volumes beginning one image before (-1.5 s) and nine images after (13.5 sec) the onset of each event. Next, the average intensity of the HDR for each condition was derived in the following steps: (1) The single trial epochs for each participant were averaged separately for each condition, and BOLD-intensity signal values within the averaged epochs were converted to percent signal change; (2) The waveforms for each voxel were correlated with an empirically-derived hemodynamic function (Kirino et al., 2000; McCarthy et al., 1997) and t-statistics were calculated for these correlation coefficients, providing whole-brain t-maps in MNI space; (3) The t-maps were used to calculate an average t-map across participants and a t-statistic was then computed at each voxel, with activations thresholded at a False Discovery Rate (FDR) (Genovese et al., 2002) of P < 0.001.
The individual t-maps created in the preceding steps were then subjected to a random-effects contrast analyses that assessed the significance of differences across participants. Random-effects contrasts were restricted to (i.e., were masked by) voxels where a significant, FDR-corrected HDR was evoked by either condition composing the contrast. In other words, the differences in HDR amplitudes between conditions were only evaluated for those voxels in which at least one condition evoked a significant HDR. The threshold for significance in the HDR peak was set at P < 0.01 (two-tailed) and a minimal spatial extent of eight uninterpolated voxels. Amplitude response timecourses were derived by averaging BOLD activations from voxels identified to be active by the random effects analysis described above.
2.5 Behavioral Analyses
Consistent with other research groups (Fan et al., 2002), accuracy and reaction time of both diagnostic groups in response to the neutral and congruent arrows were nearly identical in both the high- and low- arousal conditions (all P’s > 0.80). Thus, to simplify the interpretation of results and to remain consistent with the central imaging analysis contrasts, the neutral arrow condition is not included in behavioral analyses.
The following analyses were performed separately on accuracy and reaction time data: First, omnibus 2 (Group: Neurotypical, Autism) × 2 (Picture Category: High-Arousal, Low-Arousal) × 2 (Congruency: Congruent, Incongruent) repeated measures ANOVAs were performed; next, 2 (Group: Neurotypical, Autism) × 2 (Congruency: Congruent, Incongruent) repeated measures ANOVAs were performed separately within both levels of the Picture condition. Finally, between groups t-tests were performed within each Congruency × Arousal condition as well as within-groups t-tests to assess for congruency effects within each Group × Arousal condition. In order to present all trends evident in the data, all statistical tests reflect uncorrected significance probabilities.
3. Results
3.1 Self-report Responses to Pictures: Arousal and Pleasure Ratings
Table 1 depicts the mean arousal and pleasure-displeasure ratings of IAPS pictures used in the present study for both diagnostic groups. A 2 (Group: Neurotypical, Autism) × 2 (Picture Category: High-Arousal, Low-Arousal) repeated measures ANOVA conducted on arousal ratings revealed a main effect of Picture Category, multivariate F(1,30)=67.47, P < 0.0001, reflecting that, not surprisingly, both groups rated high-arousal pictures to be more arousing than the low-arousal pictures, but no main effect of Group or interaction with Group, P’s > 0.10. T-tests revealed that diagnostic groups did not differ in arousal ratings for both picture categories (all P’s > 0.05).
Table 1.
Mean arousal and pleasure ratings of IAPS pictures for both diagnostic groups.
| Neurotypical (n=23) | Autism (n=10) | |
|---|---|---|
| Arousal rating | ||
| Arousing Pictures | 3.73 (1.76) | 4.31 (1.65) |
| Unarousing Pictures | 0.90 (0.78) | 1.69 (1.46) |
|
| ||
| Pleasure rating | ||
| Arousing Pictures | 1.02 (0.61) | 0.19 (1.24) |
| Unarousing Pictures | 0.21 (0.61) | 0.46 (0.81) |
The range and direction of the ratings are as follows: pleasure ratings = -4 (extremely unpleasant) to +4 (extremely pleasant), arousal ratings = 0 (not at all aroused) to +8 (extremely aroused). Standard deviations are in parentheses.
A 2 (Group: Neurotypical, Autism) × 2 (Picture Category: High-Arousal, Low-Arousal) repeated measures ANOVA conducted on Pleasure ratings revealed no main effect of Picture Category or Group, P’s >0.15, but, surprisingly, a Picture Category × Group interaction, multivariate F (1,30)=7.32, P < 0.05, reflecting a greater difference in Pleasure ratings between picture categories in the neurotypical group relative to the autism group. T-tests revealed that diagnostic groups did not differ in pleasure ratings for both picture categories (all P’s > 0.05).
3.2 Behavioral Performance
Figures 2 and 3 illustrate accuracy (i.e., percent correct) and reaction time (RT) data, respectively, in response to the cognitive control stimuli subdivided by affective picture category.
Figure 2.

Accuracy data for cognitive control stimuli subdivided by picture category collected during the fMRI task. Errors bars represent group standard errors of the mean.
Figure 3.
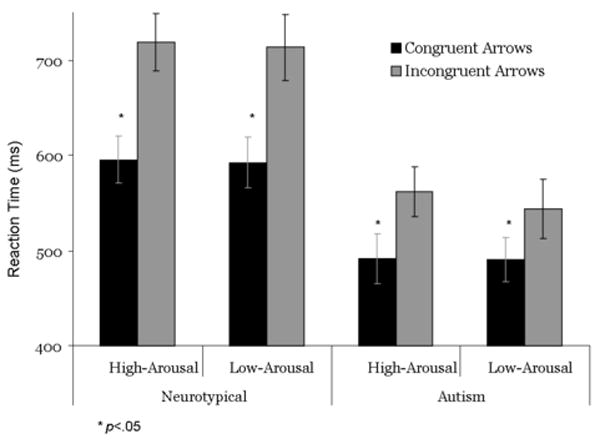
Reaction time data for cognitive control stimuli subdivided by picture category collected during the fMRI task. Errors bars represent group standard errors of the mean. All between-groups t-tests were significant, p < .05.
3.2.1 Accuracy
The three-way mixed ANOVA indicated a main effect of Congruency, multivariate F(1,30)=11.97, P <0.002, reflecting that, as expected, both groups were less accurate to incongruent relative to congruent trials, but no other main effects or interactions, P’s > 0.30. The two-way mixed ANOVAs performed within the Arousing picture condition revealed a main effect of Congruency, multivariate F(1,30)=12.91, P <0.002, but no main effect or interaction with Group, P’s>0.68; within the Unarousing picture condition, there was a main effect of Congruency, multivariate F(1,30)=10.03, P <0.004, but no main effect or interaction with Group, P’s>0.40. Between groups t-tests revealed no significant differences between diagnostic groups within any of the stimulus categories, and within-groups t-tests revealed significant effects of Congruency within each Group X Arousal condition, t’s (30) > 3.5, P’s <0.002, reflecting less accuracy to incongruent relative to congruent arrows in both Arousal conditions for both groups.
3.2.2 Reaction Time
The three-way mixed ANOVA indicated a main effect of Congruency, multivariate F(1,30)=39.49, P <0.0001, reflecting that both groups were slower to incongruent than congruent trials, a Group × Congruency interaction, multivariate F(1,30)=4.28, P < 0.05, reflecting that the effect of Congruency was greater for the neurotypical group than the autism group, and a main effect of Group, F(1,30) = 8.80, P<0.006, reflecting that the neurotypical group took longer to respond over all stimulus categories, but no other significant main effects of interactions. The two-way mixed ANOVAs performed on stimuli within the Arousing picture condition also revealed main effects of Group, F(1,30) = 9.25, P<0.005 and Congruency, multivariate F(1,30)=46.95, P <0.0001, but no Congruency × Group interaction, P>0.07; similarly, within the Unarousing picture condition, there were main effects of Group, F(1,30) = 8.63, P<0.008 and Congruency, multivariate F(1,30)=33.39, P<0.0001, as well as a Congruency × Group interaction, F(1,30) = 4.55, P<0.05. Between-groups t-tests revealed significant differences between diagnostic groups within all of the stimulus categories, t’s (30) > 2.37, P’s<0.05, reflecting that the autism group responded more quickly overall than the neurotypical group. Within-groups t-tests revealed significant effects of Congruency within each Group × Arousal condition, t’s (30) > 6.28, P’s <0.0001, reflecting longer reaction times to incongruent relative to congruent arrows in both Arousal conditions for both groups.
3.3 Imaging Data
Analyses of functional imaging data included only epochs corresponding to correct responses (there were no differences overall with respect to accuracy between diagnostic groups (Neurotypical percentage mean (SD) = 91.1 (9.9), Autism mean percentage (SD) = 88.3 (13.9), P >0.50).
First, to examine responses to the high-arousal pictures, we first examined activation to the contrast of high-arousal and low-arousal pictures that preceded congruent arrows. No voxels within the amygdala (defined by the location of voxels in standard space) revealed group differences in this contrast, thus we examined this contrast across all participants in both diagnostic groups. Figure 4 reveals that, across all participants (N=32), bilateral amygdala activation was evident for this contrast.
Figure 4.
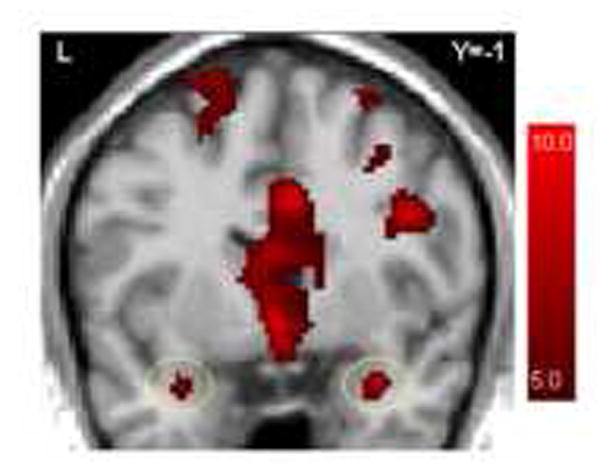
Averaged brain activation maps for all participants for the contrast of high-arousal versus low-arousal pictures that preceded congruent arrows (p<.0001, uncorrected). The circled regions indicate bilateral amygdala activation.
Figure 5 illustrates t-maps for incongruent stimuli preceded by low-arousal pictures for the neurotypical control (top) and autism (bottom) group. The figure shows that for both diagnostic groups, the incongruent-arrow stimuli recruited frontal regions associated with target detection, response selection, and action, including the dorsal anterior cingulate gyrus and the lateral midfrontal gyrus.
Figure 5.

Group averaged brain activation maps for incongruent arrow trials preceded low-arousal pictures (p<.0001, uncorrected). Areas of activation include the dorsal anterior cingulate gyrus (ACGd; left figures) and the right lateral midfrontal gyrus (MFG, right figures).
To investigate the effects of viewing high-arousal pictures immediately prior to responding to the cognitive control task, we analyzed the effects of picture arousal on brain regions recruited in response to the incongruent-arrow condition. The top of Figure 6 illustrates random effects contrast maps of responses to incongruent arrows trials preceded by high-arousal stimuli relative to incongruent-arrows trials preceded by low-arousal stimuli for neurotypical control (left) and autism (right) participants. This figure reveals that neurotypical participants recruited the lateral midfrontal cortex to a greater extent in response to the incongruent trials when preceded by arousing pictures. Each cluster of high-arousal > low-arousal activation in response to incongruent arrow trials for both diagnostic groups was localized and the anatomical label and Talairach coordinates are reported in Table 2.
Figure 6.
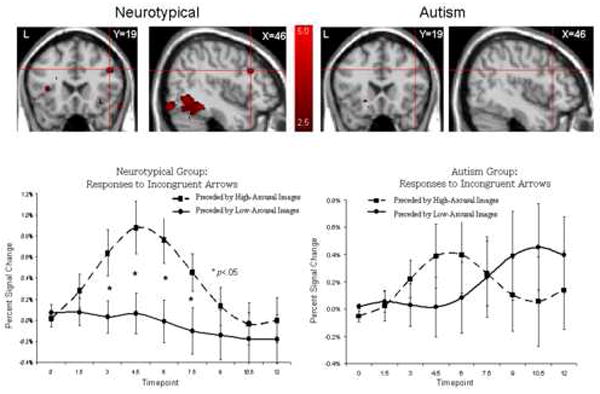
Top: Random effects contrasts (p < .01) comparing incongruent arrow trials preceded by high-arousal and low-arousal pictures for the neurotypical (left) and autism (right) groups. Bottom: Activation responses from voxels in the right midfrontal cortex denoted by the red crosshairs (Brodmann’s area 9) for the neurotypical (left) and autism (right) groups.
Table 2.
Summary of observed regions of arousing > unarousing activation in response to incongruent arrow stimuli for both diagnostic groups.
| Neurotypical Group: | ||||
|---|---|---|---|---|
| X | Y | Z | Side | Region |
| 2 | -30 | 28 | R | Cingulate Gyrus |
| 33 | -36 | -16 | R | Fusiform Gyrus |
| -40 | 30 | 13 | L | Inferior Frontal Gyrus |
| 36 | 7 | 29 | R | Inferior Frontal Gyrus |
| 54 | -65 | 0 | R | Inferior Temporal Gyrus |
| -9 | -90 | -10 | L | Lingual Gyrus |
| -5 | 50 | -5 | L | Medial Frontal Gyrus |
| -16 | 44 | 13 | L | Medial Frontal Gyrus |
| 47 | 18 | 29 | R | Middle Frontal Gyrus |
| -40 | -51 | 8 | L | Middle Temporal Gyrus |
| 36 | -68 | 24 | R | Middle Temporal Gyrus |
| -47 | -15 | 57 | L | Postcentral Gyrus |
| -19 | -50 | 47 | L | Precuneus |
| 29 | -60 | 35 | R | Precuneus |
| -29 | 52 | 33 | L | Superior Frontal Gyrus |
| 29 | 60 | -3 | R | Superior Frontal Gyrus |
| Autism Group: | ||||
|
| ||||
| -54 | -65 | 12 | L | Middle Temporal Gyrus |
| -54 | 30 | 10 | L | Inferior Frontal Gyrus |
| 57 | 31 | 16 | R | Inferior Frontal Gyrus |
X, Y, and Z refer to the stereotaxic coordinates of the center of the ROI activation. R: right hemisphere; L: left hemisphere.
The bottom of Figure 6 illustrates the timecourses of average BOLD HDRs from the right mid-frontal cortex for these two conditions. To evaluate statistically the apparent group difference in differential response to incongruent arrow trials preceded by high-arousal and low-arousal pictures in the right lateral midfrontal cortex, we computed a Group × Arousal repeated-measures ANOVA on average amplitude activation values. These were derived by averaging BOLD activations at the peak of the HDR (i.e., 4.5 – 6.0 seconds after the onset of the incongruent arrows) in response to incongruent arrow stimuli preceded by arousing pictures and incongruent arrow stimuli preceded by unarousing pictures from voxels identified to be active in the neurotypical group by the random effects analysis described above. Because there was no statistically significant effect of arousal in the autism group in this region, and because all functional data were transformed to the same normalized space, to generate average HDR’s for the autism group we queried voxels showing an effect in the neurotypical group. The Group × Arousal repeated-measures ANOVA reveal a main effect of Arousal, multivariate F(1,30)=4.25, P<0.05, no main effect of Group, F(1,30)=0.60, P>0.40, and an Arousal × Group interaction, multivariate F(1,30)=4.18, P<0.05. This critical interaction indicates that the effect of viewing high-arousal pictures that immediately preceded incongruent arrows in a functionally-defined region of the right lateral midfrontal gyrus is greater in the neurotypical group than in the autism group. This was the only region that showed a significant Group × Arousal interaction on average amplitude activation values.
3.4 Relations with ADI-R/ADOS scores
Correlations conducted within the autism group between algorithmic domains of the ADI and ADOS-G and average (arousing-unarousing) incongruent HDR differences at the peak of the HDR response revealed no significant correlations (all P’s>0.10).
4. Discussion
The goal of the present investigation was to examine whether arousal alters the behavioral and neural correlates of cognitive control, and whether this mechanism is altered in autism. We evaluated the response of a cognitive control brain network in individuals with autism and neurotypical participants when stimuli requiring cognitive control were immediately preceded by briefly presented pictorial stimuli deigned to elicit high and low levels of arousal. We adapted our task from the component of the Attention Network Test (ANT, Fan and Posner, 2004; Fan et al., 2002) designed to assess the anterior/executive system and employed high- and low-arousal pictures selected from the IAPS.
Behavioral results indicated that for both diagnostic groups, arousal ratings of IAPS pictures followed the pattern of the a priori arousal categories, as high-arousal pictures were judged to be more arousing than low-arousal pictures, and diagnostic groups did not differ in pleasure or arousal ratings of both picture categories. Mean pleasure ratings of arousing and unarousing pictures revealed a larger range in neurotypical group (i.e., 0.21-1.02) than the autism (i.e., 0.19-0.46) group; however, this was not reflected in any significant group differences with respect to pleasure or arousal ratings. Moreover, the hypothesized effects of these pictures on cognitive control were contingent on the arousing properties of the pictures. We acknowledge that we did not acquire peripheral measures of arousal (such as skin conductance) and thus cannot conclusively confirm that the pictures induced the posited high- and low-arousal states, and future studies should include such peripheral measures to validate the proposed manipulation. However, we note that other research groups have found relations between arousal ratings of IAPS pictures and behavioral (i.e., voluntary viewing time) and psychophysiological (i.e., skin conductance and cortical event-related potential) indices of arousal (Lang et al., 1998), and thus the link between subjective ratings and behavioral and psychophysiological indices of arousal are well established.
Behavioral responses acquired during the imaging task replicated the incongruency effect on both accuracy and reaction time measures such that incongruent trials resulted in longer reaction times and more errors. Although diagnostic groups did not differ with respect to accuracy, the effects of incongruency on reaction time were greater for the neurotypical group than the autism group, an effect that may reflect, at least in part, the finding that the neurotypical group took longer to respond overall. This pattern of results in consistent with evidence of quicker responding in autism in a variety of contexts (e.g., Mottron et al., 2006; Shah and Frith, 1983; Plaisted et al., 1998). Of central relevance in the present context, however, is the replication of the well-established accuracy and reaction time cost of responding to incongruent relative to congruent arrows and the finding that this pattern was not moderated by viewing high-arousal pictures immediately prior.
Functional brain imaging data replicated our previous results (Dichter and Belger, 2007) and the findings of other research groups (MacDonald et al., 2000; Fan et al., 2005; Bush et al., 2000) indicating that incongruent arrow stimuli activated portions of the lateral midfrontal cortex and the anterior cingulate gyrus. Furthermore, we replicated our prior findings that activation of these regions in individuals with autism is comparable to neurotypical control participants, suggesting that individuals with autism recruit cognitive control brain structures under “baseline” conditions.
The central goal of this investigation was to analyze the modulation of frontal “cognitive control” brain activation by arousal. In the neurotypical group, when incongruent arrow stimuli were preceded by briefly presented pictures designed to induce high arousal, activation of the right lateral midfrontal gyrus increased relative to incongruent stimuli preceded by low-arousal pictures. This is the first study to our knowledge that has investigated the effects of arousal on frontal lobe activation during the “executive attention” portion of the ANT, and is consistent with prior behavioral results indicating larger congruency effects when conflict stimuli are preceded by alerting cues (Fan et al., 2002) or tones (Callejas et al., 2005). As described by Posner (1994), the influence of alertness on the cognitive control system results in a subjective “clearing of consciousness” that appears to be accompanied by an increase in activation of the right frontal lobes (see also Cohen et al., 1988). Our finding of increased right midfrontal activation in this context is consistent with the model that resolving incongruency requires greater right frontal involvement under high-arousal conditions.
In striking contrast to results in the neurotypical group, the autism group did not demonstrate increased activation in response to incongruent arrow stimuli preceded by high-arousal pictures relative to those preceded by low-arousal pictures within the right midfrontal gyrus. This finding suggests that autism may be characterized by anomalous interactions between brain regions mediating alerting and cognitive control functions. Findings from a number of research groups have suggested that autism may be characterized by “inefficiency” selective attention domains, including both neuropsychological profiles (Minshew and Goldstein, 2001; Tager-Flusberg, 1985, 1991) and neural processing (Belmonte and Yurgelun-Todd, 2003; Baron-Cohen and Belmonte, 2005). This inefficiency model has been interpreted to reflect difficulty updating the scope and focus of attention and an inability to rapidly reorient attention (Burack et al., 1997; Goldstein et al., 2001). This model has also been posited to account for differences with respect to anomalous psychophysiological responses despite intact behavioral responses in autism (e.g., Ciesielski et al., 1990; Courchesne et al., 1989; for a review, see Belmonte and Yurgelun-Todd, 2003). These patterns of results suggest an overall disruption of cognitive control by arousal in autism.
We also note that the neurotypical group activated the fusiform gyrus to a greater extent to the incongruent arrows preceded by arousing, relative to unarousing, stimuli, although the Group × Arousal interaction on this region was not significant in this relatively small sample. Hypoactivation of the fusiform gyrus has been implicated in numerous studies of category-specific face processing in autism (Hubl et al., 2003; Pierce et al., 2001; Schultz et al., 2000), and the suggestion of (non-significant) fusiform gyrus hypoactivation in autism in the present context in consistent with a larger literature suggesting an ‘efficiency’ brain model of autism.
Findings also suggest the possibility that autism may be characterized by changes in latency to physiologic response in addition to differences in response magnitude, particularly in light of electrophysiological evidence that autism is characterized by delayed responses to certain classes of stimuli (e.g., Webb et al., 2006). Our epochal analysis strategy was based on an empirically-derived hemodynamic function (Kirino et al., 2000; McCarthy et al., 1997). However, the hemodynamic response functions depicted in Figure 6 are model-free; that is, once functional regions of interest had been derived, average timecourses were extracted that were not contingent on a particular response function. Visual inspection of Figure 6 suggests that the peak response to the incongruent condition proceeded by arousing stimuli may be slightly delayed in the autism group (i.e., between 4.5-6.0 seconds) relative to the control group (i.e., 4.5 seconds). However, the absolute magnitude of the peak response in the neurotypical group is relatively double the peak response in the autism group, indicating that amplitude differences between groups are a more robust effect in this context.
An additional interpretation of our findings may be that the autism group did not experience a comparable degree of cognitive conflict induced by the incongruent arrows, attenuation the effects of high-arousal stimuli on this task condition. This possible interpretation would be consistent with reports of superior visual detection abilities in certain contexts in individuals with autism (e.g., Plaisted et al., 1998; Shah and Frith, 1983). However, in both the current study and our previous study employing this flanker task (Dichter and Belger, 2007), the autism group demonstrated comparable regional BOLD responses to the incongruent arrow stimuli. Therefore, we interpret the current neuroimaging results to reflect differential effects of the high-arousal pictures on brain regions mediating responses to the incongruent arrows.
Anomalous recruitment of right lateral midfrontal activation during a cognitive control task in a high-arousal context are consistent with an inefficiency model of information processing in autism and corroborates our own data suggesting that autism is characterized by hypoactivation of cognitive control brain structures when task demands require inhibiting processing of complex and/or social information (Dichter and Belger, 2007). Indeed, we have interpreted our prior results of hypoactivation to social cognitive control possibly to reflect heightened arousal in response to social stimuli, and the present data are consistent with a model of cognitive control in autism characterized by intact brain functioning in less demanding contexts, but failure during more complex and/or more arousing situations.
We note a number of caveats in interpreting the present results. First, this initial study was designed to maximize regional brain activations in response to high-arousal and low-arousal pictures, and thus pictures were selected based on extreme normative ratings of arousal. To systematically assess the effects of arousal on brain responses to incongruency, future research should employ stimuli that vary systematically on this dimension. Second, as previously noted, we did not collect peripheral measures of arousal to validate our manipulation of arousal. Finally, the relatively small size of our autism sample combined with the fact that all autism participants were high-functioning limited our potential to detect relations between regional brain activation values and severity of core autism symptomatology as measured by the ADI-R and ADOS-G. Despite these potential limitations, the present study suggests that frontal mediation of cognitive control is impaired under conditions of heightened arousal in autism. This finding adds to the growing body of research designed to explain the boundary conditions of poor cognitive control that is characteristic of this neurodevelopmental disorder.
Figure 1.
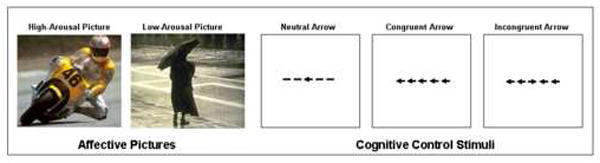
Stimuli used in the present study. Participants viewed centrally-presented arrow stimuli that appeared for 1700 ms or until a button-press was made. Participants pressed one button to indicate that the central stimulus pointed to the left, and another to indicate that it pointed to the right. The arrow stimuli were preceded by 200 ms presentations of arousing or unarousing pictures.
Acknowledgments
The authors would like to thank Josh Bizzell, Syam Gadde and Cy Kim for assistance with image analysis and MRI technologists Susan Music and Natalie Goutkin for assistance with data acquisition. We wish to thank Dr. Grace Baranek, Marisa Houser, Raechel Kiska, Margaret DeRamus, and Dr. Allen Song for assistance with several aspects of this research. This research was supported by the North Carolina Studies to Advance Autism Research and Treatment Center, Grant 1 U54 MH66418 from the National Institutes of Health. Gabriel Dichter was supported by Postdoctoral Research in Neurodevelopmental Disorders, NICHD T32-HD40127, and a career development award from UNC-Chapel Hill, NIH/NCRR K12 RR023248.
Footnotes
Arousing pictures: IAPS numbers 1050, 1120, 1300, 1931, 5621, 5629, 5950, 6230, 6260, 8170, 8185, 8485, 8501, 4002, 4180, 4210, 4220, 4232, 4250, 4290, 4300, 4311, 4607, 4647, 4652, 4659, 4664, 4670, 4681, 4683, 4694, 4695, 4800, 6350, 8030, 8080, 8260, and 8400.
Unarousing pictures: IAPS numbers 5020, 5030, 5130, 5731, 5740, 5800, 7004, 7006, 7009, 7010, 7020, 7025, 7031, 7035, 7040, 7041, 7050, 7080, 7090, 7110, 7140, 7150, 7175, 7185, 7187, 7217, 7224, 7233, 7235, 7491, 7705, 7950, 9360, 2000, 2010, 2038, 2104, 2190, 2200, 2210, 2214, 2320, 2370, 2393, 2440, 2480, 2495, 2501, 2570, 2580, 2630, 2840, 2850, 2870, 2880, 4500, 4510, 4531, 4532, 4536, 4538, 4571, 4572, 5000, 8465, and 9210.
Publisher's Disclaimer: This is a PDF file of an unedited manuscript that has been accepted for publication. As a service to our customers we are providing this early version of the manuscript. The manuscript will undergo copyediting, typesetting, and review of the resulting proof before it is published in its final citable form. Please note that during the production process errors may be discovered which could affect the content, and all legal disclaimers that apply to the journal pertain.
References
- American Psychiatric Association. Diagnostic and statistical manual of mental disorders : DSM-IV. 4. Washington, DC: American Psychiatric Association; 1994. [Google Scholar]
- Baron-Cohen S, Belmonte MK. Autism: a window onto the development of the social and the analytic brain. Annual Review of Neuroscience. 2005;28:109–126. doi: 10.1146/annurev.neuro.27.070203.144137. [DOI] [PubMed] [Google Scholar]
- Baron-Cohen S, Ring HA, Wheelwright S, Bullmore ET, Brammer MJ, Simmons A, Williams SC. Social intelligence in the normal and autistic brain: an fMRI study. European Journal of Neuroscience. 1999;11(6):1891–1898. doi: 10.1046/j.1460-9568.1999.00621.x. [DOI] [PubMed] [Google Scholar]
- Belmonte MK, Yurgelun-Todd DA. Functional anatomy of impaired selective attention and compensatory processing in autism. Brain Research Research. 2003;17(3):651–664. doi: 10.1016/s0926-6410(03)00189-7. [DOI] [PubMed] [Google Scholar]
- Bradshaw JL. Developmental disorders of the frontostriatal system: neuropsychological, neuropsychiatric, and evolutionary perspectives. East Sussex, Philadelphia, Pa: Psychology Press Ltd.; Taylor & Francis Inc; 2001. [Google Scholar]
- Burack JA, Enns JT, Stauder JEA, Mottron L, Randolph B. Attention and autism: behavioral and electrophysiological evidence. In: Cohen DJ, Volkmar F, editors. Handbook of Autism and Pervasive Developmental Disorders. 2. New York: Wiley; 1997. pp. 226–247. [Google Scholar]
- Bush G, Luu P, Posner MI. Cognitive and emotional influences in anterior cingulate cortex. Trends in Cognitive Science. 2000;4(6):215–222. doi: 10.1016/s1364-6613(00)01483-2. [DOI] [PubMed] [Google Scholar]
- Callejas A, Lupianez J, Funes MJ, Tudela P. Modulations among the alerting, orienting and executive control networks. Experimental Brain Research. 2005;167(1):27–37. doi: 10.1007/s00221-005-2365-z. [DOI] [PubMed] [Google Scholar]
- Castelli F, Frith C, Happe F, Frith U. Autism, Asperger syndrome and brain mechanisms for the attribution of mental states to animated shapes. Brain. 2002;125(Pt 8):1839–1849. doi: 10.1093/brain/awf189. [DOI] [PubMed] [Google Scholar]
- Ciesielski KT, Courchesne E, Elmasian R. Effects of focused selective attention tasks on event-related potentials in autistic and normal individuals. Electroencephalogr Clin Neurophysiol. 1990;75(3):207–220. doi: 10.1016/0013-4694(90)90174-i. [DOI] [PubMed] [Google Scholar]
- Cohen RM, Semple WE, Gross M, Holcomb HJ, Dowling SM, Nordahl TE. Functional localization of sustained attention. Neuropsychiatry, Neuropsychology, & Behavioral Neurology. 1988;1:3–20. [Google Scholar]
- Courchesne E, Lincoln AJ, Yeung-Courchesne R, Elmasian R, Grillon C. Pathophysiologic findings in nonretarded autism and receptive developmental language disorder. J Autism Dev Disord. 1989;19(1):1–17. doi: 10.1007/BF02212714. [DOI] [PubMed] [Google Scholar]
- Dalton KM, Nacewicz BM, Johnstone T, Schaefer HS, Gernsbacher MA, Goldsmith HH, Alexander AL, Davidson RJ. Gaze fixation and the neural circuitry of face processing in autism. Nature Neuroscience. 2005;8(4):519–526. doi: 10.1038/nn1421. [DOI] [PMC free article] [PubMed] [Google Scholar]
- Dichter GS, Belger A. Social stimuli interfere with cognitive control in autism. Neuroimage. 2007;35(3):1219–1230. doi: 10.1016/j.neuroimage.2006.12.038. [DOI] [PMC free article] [PubMed] [Google Scholar]
- Dolcos F, Miller B, Kragel P, Jha A, McCarthy G. Regional brain differences in the effect of distraction during the delay interval of a working memory task. Brain Research. 2007;1152:171–181. doi: 10.1016/j.brainres.2007.03.059. [DOI] [PMC free article] [PubMed] [Google Scholar]
- Fan J, McCandliss BD, Fossella J, Flombaum JI, Posner MI. The activation of attentional networks. Neuroimage. 2005;26(2):471–479. doi: 10.1016/j.neuroimage.2005.02.004. [DOI] [PubMed] [Google Scholar]
- Fan J, McCandliss BD, Sommer T, Raz A, Posner MI. Testing the efficiency and independence of attentional networks. Journal of Cognitive Neuroscience. 2002;14(3):340–347. doi: 10.1162/089892902317361886. [DOI] [PubMed] [Google Scholar]
- Fan J, Posner M. Human attentional networks. Psychiatry Prax. 2004;31(Suppl 2):S210–214. doi: 10.1055/s-2004-828484. [DOI] [PubMed] [Google Scholar]
- Frith C, Done DJ. Stereotyped behavior in madness and in health. In: Cooper SJ, Dourish CT, editors. Neurobiology of stereotyped behavior. Oxford: Clarendon Press; 1990. [Google Scholar]
- Frith U. Autism Explaining the enigma. Oxford: Blackwell; 1989. [Google Scholar]
- Genovese CR, Lazar NA, Nichols T. Thresholding of statistical maps in functional neuroimaging using the false discovery rate. Neuroimage. 2002;15(4):870–878. doi: 10.1006/nimg.2001.1037. [DOI] [PubMed] [Google Scholar]
- Glover GH, Law CS. Spiral-in/out BOLD fMRI for increased SNR and reduced susceptibility artifacts. Magn Reson Med. 2001;46(3):515–522. doi: 10.1002/mrm.1222. [DOI] [PubMed] [Google Scholar]
- Goldstein G, Johnson CR, Minshew NJ. Attentional processes in autism. Journal of Autism & Developmental Disorders. 2001;31(4):433–440. doi: 10.1023/a:1010620820786. [DOI] [PubMed] [Google Scholar]
- Gomot M, Bernard FA, Davis MH, Belmonte MK, Ashwin C, Bullmore ET, Baron-Cohen S. Change detection in children with autism: An auditory event-related fMRI study. Neuroimage. 2006 doi: 10.1016/j.neuroimage.2005.07.027. [DOI] [PubMed] [Google Scholar]
- Happe F, Ehlers S, Fletcher P, Frith U, Johansson M, Gillberg C, Dolan R, Frackowiak R, Frith C. ‘Theory of mind’ in the brain. Evidence from a PET scan study of Asperger syndrome. Neuroreport. 1996;8(1):197–201. doi: 10.1097/00001756-199612200-00040. [DOI] [PubMed] [Google Scholar]
- Hill EL. Executive dysfunction in autism. Trends in Cognitive Science. 2004;8(1):26–32. doi: 10.1016/j.tics.2003.11.003. [DOI] [PubMed] [Google Scholar]
- Hubl D, Bolte S, Feineis-Matthews S, Lanfermann H, Federspiel A, Strik W, Poustka F, Dierks T. Functional imbalance of visual pathways indicates alternative face processing strategies in autism. Neurology. 2003;61(9):1232–1237. doi: 10.1212/01.wnl.0000091862.22033.1a. [DOI] [PubMed] [Google Scholar]
- Hughes C, Russell J, Robbins TW. Evidence for executive dysfunction in autism. Neuropsychologia. 1994;32(4):477–492. doi: 10.1016/0028-3932(94)90092-2. [DOI] [PubMed] [Google Scholar]
- Just MA, Cherkassky VL, Keller TA, Kana RK, Minshew NJ. Functional and Anatomical Cortical Underconnectivity in Autism: Evidence from an fMRI Study of an Executive Function Task and Corpus Callosum Morphometry. Cereb Cortex. 2006 doi: 10.1093/cercor/bhl006. [DOI] [PMC free article] [PubMed] [Google Scholar]
- Kana RK, Keller TA, Minshew NJ, Just MA. Inhibitory control in high-functioning autism: decreased activation and underconnectivity in inhibition networks. Biological Psychiatry. 2007;62(3):198–206. doi: 10.1016/j.biopsych.2006.08.004. [DOI] [PMC free article] [PubMed] [Google Scholar]
- Kirino E, Belger A, Goldman-Rakic P, McCarthy G. Prefrontal activation evoked by infrequent target and novel stimuli in a visual target detection task: an event-related functional magnetic resonance imaging study. J Neurosci. 2000;20(17):6612–6618. doi: 10.1523/JNEUROSCI.20-17-06612.2000. [DOI] [PMC free article] [PubMed] [Google Scholar]
- Lang PJ, Bradley MM, Cuthbert BN. International Affective Picture System (IAPS): Technical manual and affective ratings. 1997 Unpublished manuscript. [Google Scholar]
- Lang PJ, Bradley MM, Cuthbert BN. Emotion, motivation, and anxiety: Brain mechanisms and psychophysiology. Biological Psychiatry. 1998;44(12):1248–1263. doi: 10.1016/s0006-3223(98)00275-3. [DOI] [PubMed] [Google Scholar]
- Lang PJ, Bradley MM, Cuthbert BN. International Affective Picture System (IAPS): Instruction Manual and Affective Ratings, Technical Report A-4. Gainesville, Florida: The Center for Research in Psychophysiology; 1999. [Google Scholar]
- Lopez BR, Lincoln AJ, Ozonoff S, Lai Z. Examining the Relationship between Executive Functions and Restricted, Repetitive Symptoms of Autistic Disorder. Journal of Autism & Developmental Disorders. 2005;35(4):445–460. doi: 10.1007/s10803-005-5035-x. [DOI] [PubMed] [Google Scholar]
- Lord C, Risi S, Lambrecht L, Cook EH, Jr, Leventhal BL, DiLavore PC, Pickles A, Rutter M. The autism diagnostic observation schedule-generic: a standard measure of social and communication deficits associated with the spectrum of autism. Journal of Autism & Developmental Disorders. 2000;30(3):205–223. [PubMed] [Google Scholar]
- Lord C, Rutter M, Le Couteur A. Autism Diagnostic Interview - Revised: A revised version of a diagnostic interview for caregivers of individuals with possible pervasive developmental disorders. Journal of Autism & Developmental Disorders. 1994;24:659–685. doi: 10.1007/BF02172145. [DOI] [PubMed] [Google Scholar]
- MacDonald AW, 3rd, Cohen JD, Stenger VA, Carter CS. Dissociating the role of the dorsolateral prefrontal and anterior cingulate cortex in cognitive control. Science. 2000;288(5472):1835–1838. doi: 10.1126/science.288.5472.1835. [DOI] [PubMed] [Google Scholar]
- McCarthy G, Luby M, Gore J, Goldman-Rakic P. Infrequent events transiently activate human prefrontal and parietal cortex as measured by functional MRI. Journal of Neurophysiology. 1997;77(3):1630–1634. doi: 10.1152/jn.1997.77.3.1630. [DOI] [PubMed] [Google Scholar]
- Minshew NJ, Goldstein G. The pattern of intact and impaired memory functions in autism. Journal of Child Psychology & Psychiatry. 2001;42(8):1095–1101. doi: 10.1111/1469-7610.00808. [DOI] [PubMed] [Google Scholar]
- Mottron L, Dawson M, Soulieres I, Hubert B, Burack J. Enhanced perceptual functioning in autism: an update, and eight principles of autistic perception. J Autism Dev Disord. 2006;36(1):27–43. doi: 10.1007/s10803-005-0040-7. [DOI] [PubMed] [Google Scholar]
- Ozonoff S, Pennington BF, Rogers SJ. Executive function deficits in high-functioning autistic individuals: relationship to theory of mind. Journal of Child Psychology & Psychiatry. 1991;32(7):1081–1105. doi: 10.1111/j.1469-7610.1991.tb00351.x. [DOI] [PubMed] [Google Scholar]
- Pelphrey KA, Morris JP, McCarthy G. Neural basis of eye gaze processing deficits in autism. Brain. 2005 doi: 10.1093/brain/awh404. [DOI] [PubMed] [Google Scholar]
- Pierce K, Muller RA, Ambrose J, Allen G, Courchesne E. Face processing occurs outside the fusiform ‘face area’ in autism: evidence from functional MRI. Brain. 2001;124(Pt 10):2059–2073. doi: 10.1093/brain/124.10.2059. [DOI] [PubMed] [Google Scholar]
- Plaisted K, O’Riordan M, Baron-Cohen S. Enhanced visual search for a conjunctive target in autism: a research note. Journal of Child Psychology & Psychiatry. 1998;39(5):777–783. [PubMed] [Google Scholar]
- Posner MI. Attention: the mechanisms of consciousness. Proceedings of the National Academy of Science USA. 1994;91(16):7398–7403. doi: 10.1073/pnas.91.16.7398. [DOI] [PMC free article] [PubMed] [Google Scholar]
- Ring HA, Baron-Cohen S, Wheelwright S, Williams SC, Brammer M, Andrew C, Bullmore ET. Cerebral correlates of preserved cognitive skills in autism: a functional MRI study of embedded figures task performance. Brain. 1999;122(Pt 7):1305–1315. doi: 10.1093/brain/122.7.1305. [DOI] [PubMed] [Google Scholar]
- Russell J. Autism as an executive disorder. Oxford; New York: Oxford University Press; 1997. [Google Scholar]
- Sabatinelli D, Bradley MM, Fitzsimmons JR, Lang PJ. Parallel amygdala and inferotemporal activation reflect emotional intensity and fear relevance. Neuroimage. 2005;24(4):1265–1270. doi: 10.1016/j.neuroimage.2004.12.015. [DOI] [PubMed] [Google Scholar]
- Sabatinelli D, Flaisch T, Bradley MM, Fitzsimmons JR, Lang PJ. Affective picture perception: gender differences in visual cortex? Neuroreport. 2004;15(7):1109–1112. doi: 10.1097/00001756-200405190-00005. [DOI] [PubMed] [Google Scholar]
- Schmitz N, Rubia K, Daly E, Smith A, Williams S, Murphy DG. Neural correlates of executive function in autistic spectrum disorders. Biol Psychiatry. 2006;59(1):7–16. doi: 10.1016/j.biopsych.2005.06.007. [DOI] [PubMed] [Google Scholar]
- Schultz RT, Gauthier I, Klin A, Fulbright RK, Anderson AW, Volkmar F, Skudlarski P, Lacadie C, Cohen DJ, Gore JC. Abnormal ventral temporal cortical activity during face discrimination among individuals with autism and Asperger syndrome. Archives of General Psychiatry. 2000;57(4):331–340. doi: 10.1001/archpsyc.57.4.331. [DOI] [PubMed] [Google Scholar]
- Shafritz K, Dichter GS, Baranek G, Belger A. The Neural Circuitry Mediating Cognitive Flexibility Deficits In Autism. Biological Psychiatry. doi: 10.1016/j.biopsych.2007.06.028. in press. [DOI] [PMC free article] [PubMed] [Google Scholar]
- Shah A, Frith U. An islet of ability in autistic children: a research note. Journal of Child Psychology & Psychiatry. 1983;24(4):613–620. doi: 10.1111/j.1469-7610.1983.tb00137.x. [DOI] [PubMed] [Google Scholar]
- Tager-Flusberg H. The conceptual basis for referential word meaning in children with autism. Child Development. 1985;56(5):1167–1178. doi: 10.1111/j.1467-8624.1985.tb00185.x. [DOI] [PubMed] [Google Scholar]
- Tager-Flusberg H. Semantic processing in the free recall of autistic children: Further evidence of a cognitive deficit. British Journal of Developmental Psychology. 1991;9:417–430. [Google Scholar]
- Turner M. Towards an Executive Dysfunction Account of Repetitive Behaviour in Autism. In: Russell J, editor. Autism as an executive disorder. Oxford; New York: Oxford University Press; 1997. pp. 57–100. [Google Scholar]
- Turner M. Annotation: Repetitive behaviour in autism: a review of psychological research. Journal of Child Psychology & Psychiatry. 1999;40(6):839–849. [PubMed] [Google Scholar]
- Webb SJ, Dawson G, Bernier R, Panagiotides H. ERP evidence of atypical face processing in young children with autism. Journal of Autism & Developmental Disorders. 2006;36(7):881–890. doi: 10.1007/s10803-006-0126-x. [DOI] [PMC free article] [PubMed] [Google Scholar]
- Weschler D. Weschler Abbreviated Scale of Intelligence (WASI) San Antonio, TX: Harcourt Assessment; 1999. [Google Scholar]
- Williams JH, Waiter GD, Gilchrist A, Perrett DI, Murray AD, Whiten A. Neural mechanisms of imitation and ‘mirror neuron’ functioning in autistic spectrum disorder. Neuropsychologia. 2006;44(4):610–621. doi: 10.1016/j.neuropsychologia.2005.06.010. [DOI] [PubMed] [Google Scholar]
- Wing L, Gould J. Severe impairments of social interaction and associated abnormalities in children: epidemiology and classification. J Autism Dev Disord. 1979;9(1):11–29. doi: 10.1007/BF01531288. [DOI] [PubMed] [Google Scholar]
- Yucel G, McCarthy G, Belger A. fMRI reveals that involuntary visual deviance processing is resource limited. Neuroimage. 2007;34(3):1245–1252. doi: 10.1016/j.neuroimage.2006.08.050. [DOI] [PubMed] [Google Scholar]