

Abstract
Analysis of genome-wide oscillations in transcription reveals that the cell is an oscillator and an attractor and that the maintenance of a stable phenotype requires that maximums in expression in clusters of transcripts must be poised at antipodal phases around the steady state—this is the dynamic architecture of phenotype. Plots of the path through concentration phase space taken by all of the transcripts of Saccharomyces cerevisiae yield a simple three-dimensional surface. How this surface might change as period lengthens or as a cell differentiates is at the center of current work. We have shown that changes in gene expression in response to mutation or perturbation by drugs occur through a folding or unfolding of the surface described by this circle of transcripts and we suggest that the path from this 40-minute oscillation to the cell cycle and circadian rhythms takes place through a series of period-two or period-three bifurcations. These foldings in the surface of the putative attractor result in an increasingly dense set of nested trajectories in the concentrations of message and protein. Evolutionary advantage might accrue to an organism that could change period by changes in just one or a few genes as day length increased from 4 hours in the prebiotic Earth, through 8 hours during the expansion of photoautotrophs, to the present 24 hours.
Introduction
Recently, we described the first example of period-doubling behavior in the genome-wide transcriptional oscillation seen in yeast cultures growing at high cell densities and exhibiting continuous gated synchrony (Li and Klevecz 2006). We showed that this behavior was closely modeled by a simple modification of the Rossler attractor (Rossler 1976). From the dynamic systems perspective, we can take this rigorous model for describing the global behavior of the timekeeping oscillator and begin to build a gene-by-gene or regulon-by-regulon dynamic systems network. The model also immediately offers an accessible graphical representation of the genome-scale changes that can lead from a high-frequency timekeeper to the cell cycle and circadian rhythms. Cell-to-cell signaling in continuous cultures of the budding yeast S. cerevisiae leads to mutual entrainment or synchronization that is manifested as an oscillation in redox state and a genome-wide oscillation in transcription and metabolism (Klevecz et al. 2004; Tu et al. 2005; Murray et al. 2007). In turn, this transcriptional redox attractor cycle (TRAC) times, or gates, DNA replication and other cell cycle events. In this regard, the cell cycle is a developmental process timed by the TRAC. DNA replication is restricted to the reductive phase of the cycle and is initiated as levels of hydrogen sulfide rise. This is seen as an evolutionarily important mechanism for preventing oxidative damage to DNA during replication (Klevecz et al. 2004). Both exposure to drugs known to alter circadian rhythms and deletions of known clock genes in S. cerevisiae yield an increase in the period of the TRAC that follows a bifurcation path from 40 minutes to 3–4 hours. This finding resonates with an earlier observation of a 3–4-hour oscillation that gated cell cycle events in higher organisms (Klevecz 1976). We suggest that the genome-wide oscillation discovered in yeast is a primordial oscillator and that the differentiation pathway to multiple phenotypes is through a process characterized by period doubling and period-three bifurcations.
Several independent lines of evidence argue that the time sense in biological systems is not dissectible from the dynamic architecture of a cellular phenotype. Experimental evidence from expression arrays, metabalome analyses, and limited green fluorescent protein (GFP)-tagged proteins pushes us to conclude that “everything” oscillates. For those few constituents that cannot be shown to oscillate, we will point to dynamic systems theory, which says that as more things oscillate in a coupled system, the likelihood that everything oscillates becomes a certainty (Hess and Boiteux 1971). Finally, there is a strong evolutionary argument for expecting that the clock started out as a high-frequency oscillator. Circadian rhythms are always about 1 day, but the length of 1 day was not always 24 hours (Klevecz 1984).
When the Day was Eight Hours Long
All heavenly bodies, from the most massive type-O and -B stars to the smallest asteroids, form and rotate with periods that are at the limit of their rotational instability, which ranges, depending on composition, from 80 minutes to 4 hours. The Earth was no exception. Early in the Earth's history, an impact with a massive planetoid created the Moon and resulted in the transfer of angular momentum from the Earth's rotation to the orbit of the Moon. The Earth slowed its rotation and the separation between the Earth and the Moon increased. Geophysical calculations put the period of the Earth's rotation at 8 hours 3.4 billion years ago (Turcotte et al. 1977), a time when photoautotrophs were plentiful and mixed colonies of Cyanobacteria were forming stromatolites. From this point onward, geophysical calculations are not needed to determine the period of the Earth's rotation because day length was recorded in daily growth rings that resulted from the swimming and settling of the algal colonies that comprise stromatolites (Panella 1972). Because tidal and annual rhythms are visible in cross-sections of stromatolites, it is possible to calculate that there were slightly more than 1000 days per year 3 billion years ago, yielding a day length of 8–9 hours. Because of the nearness of the Moon and the lack of a significant atmosphere, the day was punctuated by boiling and condensing tides and intense ultraviolet radiation. If ever there was a need for the progenitors of Synechoccocus to coordinate with the external environment, this was it. In such a world, with shallow seas, sensing and coordinating ones chemistry with the tides might well have been as important as circadian coordination. The evidence for changes in day length becomes quite plentiful beginning 600–800 million years ago, as metazoans expanded. Devonian and Ordovician corals and bivalves recorded the later recession of the Moon and the slowing of the Earth's rotation in daily periodicities in growth patterns. Wells (1963) was the first to realize that the history of the Earth's rotational period and the evolution of the Earth-Moon system could be charted by counting the number of daily increments per annual series added to skeletons of living and fossil corals. He found that whereas living corals add 365 daily increments per year, Devonian fossils added 400, yielding a day length at that time of 21.9 hours. Measurements from the Cambrian, 600 million years ago, give a day length of about 20.6 hours (Wells 1963).
On the basis of paleontological observations of growth ring differences: the existence of ultradian, often quantal, rhythmic expression in unicellular eukaryotes, simple metazoans, and mammalian cells in culture; and the clustering of period mutants in Drosophila, Chlamydomonas, and Neurospora, it is plausible to think that modern circadian rhythms have evolved from their initial primordial 4- or 8-hour period to their present length through a path similar to the TRAC oscillations seen in yeast. Let us first discuss the evidence for the existence of a 3–4 hour periodicity underlying circadian rhythms in modern higher organisms (Fig. 1) and then treat the molecular and dynamic details of period changes from 40 minutes to 4 hours as displayed in the yeast gated synchrony system.
Figure 1.
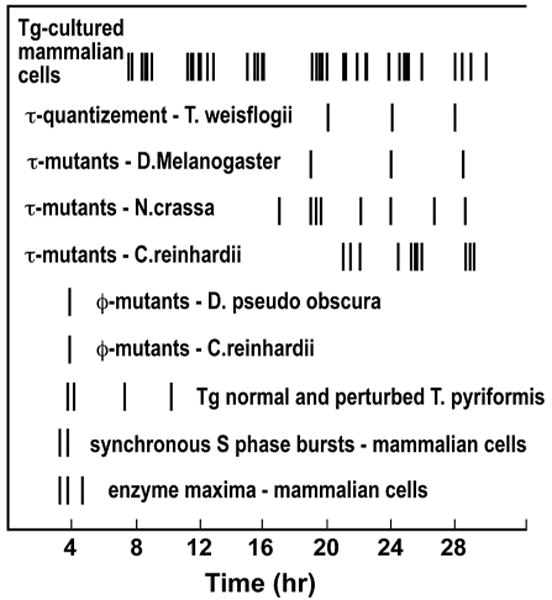
Expression of a fundamental oscillator underlying cell cycle and circadian rhythms. Each line represents a peak of occurrence. Starting from the top of the figure, (Line 1) Quantized variation in generation times (Tg) of cultured mammalian cell lines. Generation times were determined from the published data on cells that were synchronized by mitotic selection or from time-lapse analyses of intermitotic times of random cultures. The list is not exhaustive, but it represents a sampling of papers published since 1961 in which the stated generation time could be directly confirmed in the data. Wherever possible, modal generation times were obtained, and reports stating only population doubling time were excluded (Klevecz 1976). (Line 2) Polymodal distribution of generation times in the marine diatom Thalassiosira weisflogii growing in the circadian mode (Chisholm and Costello 1980). (Line 3) Long- and short-period mutants of Drosophila melanogaster isolated by Konopka and Benzer (1971). (Line 4) τ mutants of Neurospora crassa studied by Feldman and coworkers (Feldman and Hoyle 1973; Feldman et al. 1979; Feldman and Dunlap 1982). (Line 5) Phototaxic τ mutant of Chlamydomonas reinhardii picked and isolated by Bruce (1972) from cultures treated with nitrosoguanidine. (Line 6) Phase angle (Φ) early-eclosion mutants selected by Pittendrigh (1967) by continuous selection through 50 generations for early emerging Drosophila pseudoobscura. (Line 7) Φ mutants of C. reinhardii isolated by Bruce (1972) from cultures treated and selected for period changes. (Line 8) Oscillatory variations in generation times of Tetrahymena pyriformis perturbed by continuous incubation in low levels of actinomycin D. Normal generation time in these cultures is 4–4.5 hours (Jauker and Cleffmann 1970). (Line 9) Interval between synchronous bursts in DNA synthesis in S phase of mammalian cells (Klevecz 1969; Klevecz and Kapp 1973; Collins 1978; Kapp et al. 1979; Holmquist et al. 1982) scored from a maximum slope of thymidine incorporation rate between peaks. (Line 10) Intervals between peaks in maximum enzyme activity or levels in the cell cycle of synchronous hamster cells in culture (Klevecz et al. 1984).
Quantized Generation Times, Period Mutant Clusters, and the Folding of the TRAC
Before the development of methods for examining genome-wide expression, clues to the dynamic structure of the cell could only be assessed by measurement of small subsets of cellular constituents from synchronous systems (Klevecz and Ruddle 1968) or by intentional perturbation and measurement of the phase-response curves of events such as DNA replication and cell division to the perturbation (Klevecz et al. 1984). These early studies provided a sketch of the dynamic architecture of phenotype and offered a rigorous alternative to simple branched sequential models based on mutational analysis of the cell cycle (Hartwell et al. 1974). Quantized generation times, together with perturbation analyses, formed the experimental foundation of efforts to synthesize a model of the cell cycle in which such disparate concepts as checkpoints and limit cycles or complex attractors were fused (Shymko et al. 1984). The basic idea was that checkpoints represent subthreshold oscillations in an attractor that underlies the cell cycle (Klevecz et al. 1984). The oscillator that gave rise to gated cell divisions in mammalian cells was shown to be phase-responsive and temperature-compensated (Klevecz et al. 1978; Klevecz and King 1982). The quantized generation time model was extended to other cell types and to gating of circadian rhythm-based cell division in plants, dinoflagellates, and a variety of mammalian cells in culture. One prediction of the attractor models was that all cell cycle events would be gated by the attractor, and this period would be an integral submultiple of the cell cycle or circadian rhythm it timed.
Quantized generation times were the first direct evidence of a cellular clock, but the more recent findings that the continuous culture system in yeast appears to be timed by a similar oscillator that can be tuned or driven to “fold” (i.e., undergo a series of period-two or period-three bifurcations) and that cell cycle events in S. cerevisiae appear to be gated by this transcriptional cycle suggest that a similar phenomenon, although on a different timescale, is operating in all systems from yeast to mammalian cells. This realization has opened a new and experimentally more accessible path to investigations of synchronous gating and the role of oscillations in generating and maintaining a stable phenotype.
From Molecular Constraints to a Primordial Clock: The Path from 40 Minutes to 4 Hours
The time required for a prokaryotic replication fork to go from origin to terminus is 40 minutes. This too seems to be constant in a large variety of prokaryotic cells and is thought to be the minimum length of time required to accurately replicate a chromosome containing the minimum amount of information necessary to create a cell (Donachie 1968; Bipatnath et al. 1998; Nordstrom and Dasgupta 2006). Primitive prokaryotes must have faced the challenge of coordinating this molecular constraint with the external environment. We think that the yeast-gated synchrony system, with its ability to alter period length in response to mutations, drug treatments, or media differences, offers a glimpse into this primordial past.
The case for the origin of eukaryotic cells by fusion of symbionts has been made in a general way by Margulis (1993). More specifically, Searcy et al. (1981) suggested that the earliest eukaryote consisted of an Archaeal host capable of producing H2S from environmental sulphate and a proteobacterial H2S oxidizing endosymbiont engulfed by phagocytosis (Searcy et al. 1981; Searcy 2003). One could suppose that this is expressed today in the time sharing and phase separation seen in the shift between the oxidative and reductive phases in S. cerevisiae. This approximately 40-minute cycle has been seen in essentially every simple unicellular eukaryote examined. The stability and reproducibility of the oscillation have made it possible to pursue the question of whether there is a genome-wide oscillation in transcription and, furthermore, to explore the extent to which models of genetic regulatory circuits, based on large arrays of coupled chaotic attractors, are predictive of the dynamics of phenotypic organization (Klevecz et al. 1992; Bolen et al. 1993).
Microarray analysis from a yeast continuous synchrony culture system (using our standard wild-type strain, IFO0233) shows a genome-wide oscillation in transcription (Fig. 2A). Maximums in transcript levels occur at three nearly equally spaced intervals in this approximately 40-minute cycle of respiration and reduction (Fig. 2B). Two temporal clusters (4679 of 5329) are maximally expressed during the reductive phase of the cycle, whereas a third cluster (650) is maximally expressed during the respiratory phase (Fig. 2C). Transcription is organized functionally into redox-state superclusters with genes known to be important in respiration or reduction being synthesized in opposite phases of the cycle. As we demonstrate, there is a phase lag between the synthesis of the transcript and its translation into protein, such that each phase set of transcripts includes transcripts for genes that might be expected to function maximally in the next phase of the cycle (R.R. Klevecz, unpubl.). Most recently, analysis by fast Fourier transforms, singular value decomposition, and self-organizing maps of data obtained using Affymetrix expression arrays on samples taken every 4 minutes through 3 or 4 cycles from the gated synchrony system found evidence for a genome-wide oscillation and a 40-minute period in more than 95% of genes scored as present in all samples (Li and Klevecz 2006).
Figure 2.
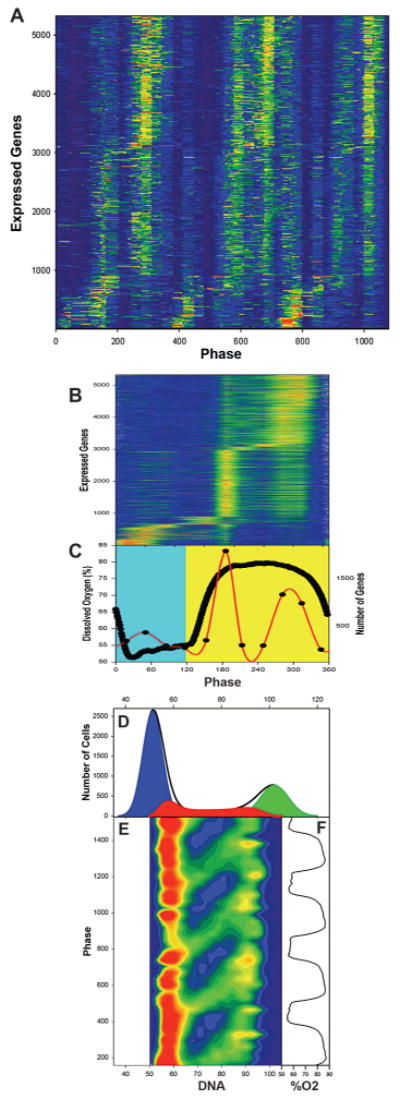
Genome-wide oscillations gate S phase. (A) Color contour (intensity) maps of the expression levels of the 5329 expressed genes are shown for 32 RNA samples through three cycles of the dissolved oxygen (DO) oscillation. To get a measure of the experiment to experiment reproducibility, the first ten samples were taken from a different experiment from those in samples 11–32. (Orange) High levels of expression; (blue) low levels of expression. Genes were scored as present based on the Affymetrix default settings and were included in the analysis if they were scored as present in each of the three cycles for at least 1 of the 32 samples. Values shown here were scaled by dividing the average expression level for each gene into each of the time-series samples for that gene. Transcripts were ordered according to their phase of maximum expression in the average of three replicates. Samples are identified according to their phase in the cycle (0–360°/cycle). (B) Consensus expression levels from three cycles of the TRAC oscillation. Sample phases are shown in reference to the DO curve (thick black line, C). Color scale: (orange-red) >1.6; (dark blue) <0.8. (C) Summary of the results for the time of maximum expression (red line) for the transcripts of A. The reductive phase is taken to be the period of minimal oxygen consumption (maximum DO, yellow background) in the interval between the minimum DO levels, and the respiratory phase is shown against a blue background. (D) Low cytometric analysis of S-phase gating in the reductive phase of the cycle. (E) An example of one-dimensional frequency histogram of DNA content. DNA content of the population for 39 samples taken at 4-minute intervals through four cycles of the TRAC have been stacked with respect to the time in the DO oscillation at which they were sampled as indicated in F. In the resulting two-dimensional color map, with red indicating more cells and blue representing fewer cells, the track of cells through S phase appears as a series of green bands moving left to right and upward on the diagonal. (Red) 350 cells; (light green) 200 cells; (dark blue) 0. (Reprinted, with permission, from Klevecz et al. 2004 [©Elsevier].)
Many of these results have been repeated for a CEN.PK strain that has a 4–5-hour respiratory cycle at lower glucose levels (Tu et al. 2005). Moreover, Murray et al. (2007), using the gated synchrony system with a 40-minute cycle, showed that metabolites are almost universally oscillatory. Currently, the TRAC is thought to be synchronized by a mechanism involving respiratory inhibition by the release of small bursts of H2S and carbon flux tuning mediated by acetaldehyde (Murray et al. 2003). Although these two compounds seem to be sufficient to explain the synchronization of the respiratory/reductive cycle, approximately equal numbers of cells are gated into S phase in each turn of the TRAC (Figs. 2D,E) and the length of the cell cycle is increased over its minimum, suggesting that other signaling pathways, including those that involve quorum-sensing molecules, may have a role in coordinating the respiratory/transcriptional cycle with the cell cycle to achieve sustained oscillations in the population. The role of cell-to-cell signaling and the distinction between quorum sensing and quorum conflicts in regulating growth rate has been analyzed dynamically in a series of computer simulations from this laboratory (Klevecz et al. 1992).
Gating of Cells from G1 into S Phase by the TRAC
Although the respiratory oscillation has been investigated in a number of laboratories, its relationship to the cell cycle and to the gating of cells into S phase and mitosis was largely unexplored. On the basis of knowledge that the population doubling time in continuous cultures was greater than 8 hours, it was assumed that the respiratory oscillation was entirely uncoupled from the cell cycle. If the approximately 40-minute cycle is the fundamental timekeeping oscillator, then gene expression for the majority of the genes of yeast would show oscillations with an approximately 40-minute period, or an integral multiple of that period. Moreover, if transcription is regulated coordinately with the oscillation, then cell cycle events might be similarly timed. In Figure 3 (top), a sketch of the relationship between the TRAC and the cell cycle is shown for a TRAC oscillation with a 40-minute period. As the period of the TRAC increases, the number of TRAC cycles per cell cycle would decrease, because the average generation time in the population as a whole is fixed by dilution rate. With decreasing numbers of TRAC cycles per cell cycle, the fraction of cells gated into S phase should increase. As Figure 3 (bottom) shows, this was found to be the case for IFO0233 wild-type cells with a 40-minute oscillation and also for CEN.PK cells growing with about 2; 2.5; and about 4-hour TRAC oscillations. The value in which 70% of cells were gated into S phase was taken from an IFO0233 culture that was synchronized by transiently lowering the pH of the medium to 2.
Figure 3.
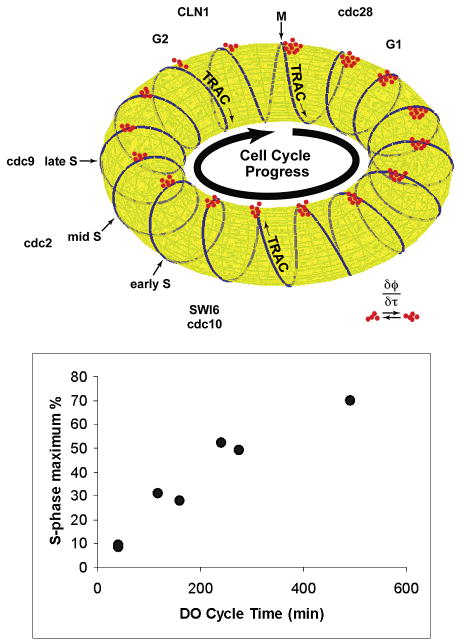
TRAC cycle and S-phase fraction. (Top) Sketch of the relationship between the TRAC and the cell cycle. Red clusters indicate that greater numbers of cells (red dots) signal to the population from G1 phase compared with S and G2. As the length of the DO oscillation increases, it is expected that the number of turns of the TRAC around the torus would decrease, thereby increasing the fraction of cells entering S phase in any turn of the TRAC. In the limit, when there are just two turns of the TRAC per cell cycle, the S-phase fraction should be maximal. Defining the relationship of the track to the cell cycle should give the information necessary to design culture conditions in which continuous cell cycle synchrony is maintained. (Bottom) Flow cytometric determined maximum S phase as a function of the length of the DO cycle.
Yeast as A Stochastic Tissue
The details of the cellular dynamics that lead to the emergence of redox and TRAC oscillations and the gating of cells into cell cycle stages are still not completely known. What seems clear is that at the cell densities required for emergence of the oscillation—between 2 × 10⁸ and 8 × 10⁸ cells/ml—the cultures are in effect tissues. The distance between cells is less than one cell diameter, creating the potential for the constant exchange of materials directly, as well as through diffusion. Collisions between cells are random and in some sense global rather than local, as in a mammalian tissue. Moreover, because of the balance between new cells appearing by division and the removal of cells by dilution, there is always a disproportionate fraction of newly divided cells: the exponential growth distribution. How the signaling of a cell that is not yet ready to replicate or divide affects a cell that would otherwise be ready to divide is central to understanding how cells with adequate nutrients are prevented from replicating and dividing with the minimal generation times. At lower cell densities, cell cycle times are in the range normally found for wild-type yeast, 2–4 hours. Under conditions that promote synchronization of their respiratory/reductive cycles, their generation times are 8 hours long. It is logical to first assume that the cultures are limited by some essential nutrient, even though the cultures are continuously receiving fresh medium with 2% glucose. Direct measurement of glucose levels in the cultures yields levels of glucose in the range of 50—250 μm. When the nutrient supply is shut off, cultures continue to oscillate for 6–12 hours. Continuous sampling at 4-minute intervals throughout the cycle shows a low-amplitude oscillation in glucose levels, with the level increasing slightly when the cells enter the reductive phase of the cycle. It seems likely that oscillations in batch cultures occur more frequently than is recognized. Routine detection of the oscillations relies on close monitoring of oxygen consumption. In standard medium, with 2% (110 mm) glucose, the Crabtree effect initially inhibits respiration, and most laboratories do not measure glucose levels, oxygen consumption, hydrogen sulfide production, and carbon dioxide production as we do. Most significantly, shaker cultures, which are by far the most common means of growing S. cerevisiae, are poorly oxygenated with dissolved oxygen (DO) levels of less than 2%.
Kinetically, the yeast stochastic tissue and a mammalian tissue, such as the epithelial cells of the gastrointestinal tract, are similar if on different timescales. In the gastrointestinal tract of mammals, the cell cycle time of a single cell is in the range of 3–8 days, even though a fraction of the cells in that tissue (typically 10–15%) divide each day, at the same time of day (Potten and Bullock 1983; Potten and Loeffler 1990). In the yeast gated synchrony system, where the TRAC is 40 minutes long, 8–10% of the cells divide in each turn of the cycle, even though the average cell cycle time of these cells is about 8 hours. When explanted to culture, mammalian cells exhibit an ability to grow with generation times much shorter than 8 days, typically 24 hours. Similarly, yeast cells that are diluted and refed with the conditioned medium divide with a 2-hour generation time. Under conditions favoring gated synchrony, cells that might otherwise initiate DNA synthesis or cell division are prevented from doing so by signals received from other cells that are in earlier phases of the cell cycle. The more mature cells are thus retarded in their progress by cell-to-cell communication and by virtue of their being embedded in a network of cells that is on average younger and therefore unready to replicate or divide. We call this a quorum conflict.
Period Doubling and the Effect of Phenelzine on Genome-Wide Oscillations
As discussed in detail in our recent publication (Li and Klevecz 2006), perturbation of the gated synchrony system in yeast with phenelzine, an antidepressant drug used in the treatment of affective disorders in humans, leads to a rapid lengthening in the period of the genome-wide transcriptional oscillation. Lithium and phenelzine are among the oldest of the mood stabilizing or antidepressant psychoactive drugs used in the treatment of bipolar and other affective disorders in humans. One effect of these drugs is a slight lengthening of the circadian rhythm in both normal volunteers and patients under controlled settings. In humans, as well as experimental systems as disparate as rodents and the plant Kalanchoe, treatment with these agents increases the period of the circadian clock by an amount just under 1 hour. Treatment of S. cerevisiae with phenelzine causes a similar 30–40-minute increase, such that the period of the oscillation in the respiratory/reductive cycle is nearly doubled from 40 to about 70 minutes. Close examination of the benchmark oscillation in DO in the yeast gated synchrony system indicates that the reductive phase is exactly doubled, whereas the length of the respiratory phase is unchanged by drug treatment. The doubling of the length of the reductive phase in DO is anticipated by a doubling in the number of maxima in expression of reductive phase transcripts. This doubling of the reductive phase follows a path that can be closely modeled by a modification of the simple system of equations represented by the Rossler attractor (Rossler 1976).
Describing and Reconstructing an Attractor
An attractor can be represented by a mathematical formalism. In the most familiar instances, these are a set of ordinary differential equations that represent the path taken through concentration phase space by the variables of the system over time (Li and Klevecz 2006). Rather than plotting the change in concentration or level of each of the variables versus time separately in a series of graphs, it is more informative to plot them relative to one another. Time then becomes implicit in the points along the trajectory taken by the system as a whole. In systems with large numbers of variables, it would seem that the resulting attractor would not lend itself to a simple graphical representation. But one of the most interesting and important attributes of complex systems is that they can often be accurately represented by attractors with very low numbers of dimensions. In this view, genes with similar patterns of expression are thought of as being in the same basin of attraction and can be visualized as circling around the steady state as swarms in a periodic path. These systems have a solid mathematical basis that has been well understood for some time. The rules of behavior are very specific and limited, and therefore, the predictions can be readily tested in well-controlled biological systems. Here, we have chosen to show just four of the transcripts from our most recent study (Fig. 4). These results can be compared with those of Figure 2D in Li and Klevecz (2006), where the averages of all transcripts from early and late reductive phase and respiratory phase are shown. This preferential lengthening of the reductive phase is also seen in strains such as CEN.PK, where the nominal period length is greater than that of IFO0233. The changes in expression, and the folding path from the approximately 40-minute oscillation to the 4-hour oscillation, are of greatest interest in the effort to map the surface of the attractor as it changes during the course of differentiation.
Figure 4.
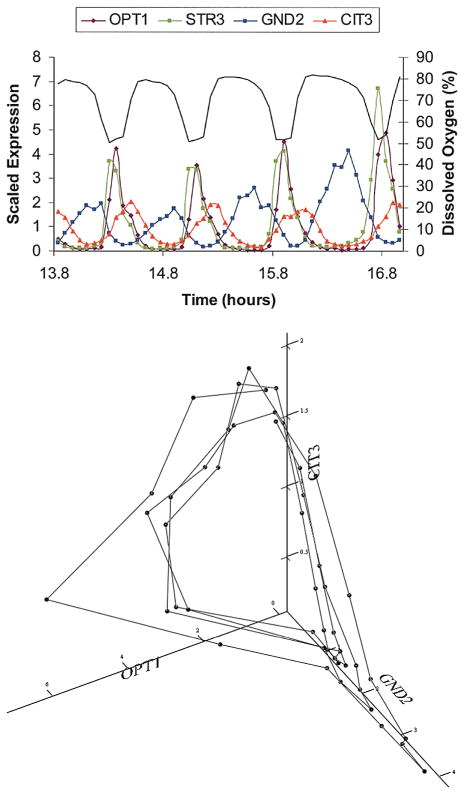
Super cluster swarms around the steady state. The expression patterns of four transcripts are shown. (Top) Two of the transcripts, OPT1 and STR3, are respiratory-phase transcripts that were so classified because their maximum expression occurs during the phase of high oxygen utilization. OPT1 and STR3 are shown to indicate the stability of the phase angle between the two transcripts. CIT3 is maximally expressed during the early reductive phase and GND2 is maximally expressed in the late reductive phase. Solid line indicates DO. (Bottom) The expression patterns of three of the transcripts are plotted together. If we take average of all of the transcripts whose maxima occur in early reductive, late reductive, or respiratory phase and plot these three sets of average values together, a plot very similar to that for the three genes emerges, as shown by Li and Klevecz (2006).
Clustering of Periods in Differing Strains and Mutants of the TRAC
The use of deletion mutants, drugs, and media manipulation has yielded a spectrum of oscillatory modes and periods in a number of S. cerevisiae strains, with DO periods ranging from 20 minutes to 16 hours. However, without an analysis of protein levels or mRNA expression, it is difficult to say how the increase in period lengths seen in the DO curves would be manifested in the TRAC. Here, we show two examples of period doubling. The first is the doubling in the reductive phase alone of IFO0233 cultures treated with phenelzine (Fig. 5B) in comparison with untreated IFO0233 (Fig. 5A). The second example involves the deletion of YBR239C from the CEN.PK strain. In the haploid wild-type CEN.PK strain, the period of the DO oscillation is 154 minutes, whereas in the YBR239C deletion, it is approximately doubled to 291 minutes (Fig. 5C,D). It must be emphasized that the oscillations in both wild type and mutants are somewhat pleiodynamic and can show periods other than those shown here.
Figure 5.
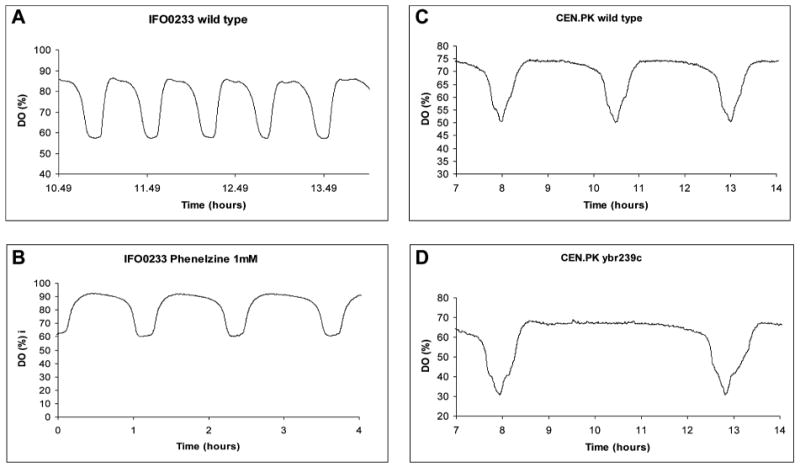
Reductive phase period doubling. The DO oscillations for the IFO0233 diploid wild type (A), the phenelzine-treated IFO0233 (B), the CEN.PK haploid (C), and the CEN.PK haploid Δybr239c deletion (D) are shown. The deletion of the YBR239C gene from the haploid increases the period of the oscillation from 154 minutes to 291 minutes. As in the phenelzine experiments, the change in period seems to take place principally in the reductive phase.
The path from the transcriptional cycle to the cell cycle and circadian rhythms appears to involve period-two and period-three bifurcations. With the help of a series of simple simulations (see Figure 6 in Li and Klevecz 2006), it is possible to show how an increase in the number of doublings in the attractor surface increases the time required for a system to complete one cycle, and, at the same time, the pattern of any trajectory within the surface becomes quite complex. This should have some general appeal because it explains how a system can have a high-amplitude oscillator, as might be expressed in a circadian length rhythm, while not obviously expressing high-amplitude oscillations in the controlling high-frequency oscillations. Nevertheless, the model predicts that close time series sampling in such a circadian system should uncover the high-frequency components embedded in the approximately 24-hour cycle. Moreover, these high-frequency components serve to increase the precision of the clock to permit precise timing of events at differing phases. We are hopeful that additional high-frequency analyses of the sort recently described by van der Veen et al. (2006) will be applied to high-frequency sampling of transcript and protein levels in circadian systems to test the validity of this model.
Period Doubling: A Path to Evolutionary Change Requiring Minimal Deleterious Mutations
Period doubling is a path for phenotypic change that requires minimal mutational change. A single-gene mutation can tug an entire pathway into a new basin of attraction, thereby altering phenotype and giving the system an opportunity to experiment without the cost of multiple mutations. Stable changes in expression can occur simply by moving the entire multigene complex into a new basin of attraction. One prediction is that genes which alter coupling strength and cell-to-cell or gene-to-gene signaling should show a greater substitution rate than those that are deeply embedded in the attractor basin. Put another way, to change the function of a gene that is an integral part of one of the core oscillations is likely to be difficult. A strength of this model is that it permits many genes to be expressed at very low levels without the consequent loss of temporal organization that would result if the organization of phenotype was stochastic.
Conservation and Evolution of Period
The idea that certain functional domains are conserved through great evolutionary distances is the core of our understanding of modern molecular evolution. The mechanism that facilitated this conservation was gene duplication, as first suggested by Ohno (1970; Kellis et al. 2004). Moreover, that the rate of evolution of a protein is related to the number of its interactions suggests that evolutionary changes are constrained by the need to function as a system and may occur largely by coevolution.
What has only rarely been considered is the idea that a dynamic property of the system, in this case the period of the oscillation, might impose similar or greater constraints on the evolution of a protein and the network in which it is embedded. In such a case, one member of a regulon of genes that evolved to generate a precise period of biologically important duration cannot change without causing the function of the system of proteins to fail. It is the dynamic analog of a multiunit complex; changes in one gene might only be achieved by a compensatory change in another to give rise to a cycle of similar period to the original. In a phenotype in which “everything oscillates,” it seems likely that to a greater or lesser extent, every gene product interacts with some or many other gene products. In such a globally coupled system, the constraints on period change might be expected to be extreme. On the basis of our recent work, a strong argument can be made for this idea. We suggest that one of the constraints on the evolution of the circadian period from its primordial approximately 8-hour period to the present is through a folding of the attractor surface to achieve an increase in period without requiring multiple changes in the regulatory and kinetic properties of a large number of genes or regulons.
By this hypothesis, genes that are part of the core regulatory complex would evolve most slowly, whereas those that function to alter period, such as genes involved in signaling and coupling pathways and their networks, would evolve more rapidly. A change in a single or a small number of genes involved in the signaling or diffusive coupling of genes might “tune” the core oscillatory elements to a new basin of attraction where functionality would endure, if at a slightly suboptimal level, giving the system as a whole the opportunity to evolve more slowly. For example, one might expect that genes containing the PAS (PER-ARNT-SM) domain, which is known to alter period in both circadian rhythms and the yeast transcriptional cycle, would be less conserved than those central to the core oscillator.
Conclusion: Evolution of Circadian Rhythms from a High-Frequency Oscillator
We know that circadian rhythms cannot always have been 24 hours because the period of the Earth's rotation has slowed since the time when life first emerged. Tidal rhythms at that early time would have been about 4 hours, close to the period of the quantal oscillator described in mammalian cells and also equal to the period differences seen in mutants of the circadian clock. If a primitive, short-period oscillator with the capacity to entrain to sunlight emerged early, and if the ensemble of reactions specifying phase and period were fixed and integrated into the chemistry of the organism, as “frozen accidents” are fixed in primordial DNA sequences, some vestige of this primitive clock might still be expressed as a high-frequency rhythm in mammalian cells and yeast. If the path from high-frequency rhythms to the modern circadian clock follows the period-two or period-three bifurcation path predicted by the coupling of simple reaction-diffusion systems, and observed experimentally in yeast, then we might be close to a general theory of evolution of the circadian clock.
Acknowledgments
This work was supported in part by grant GM81757-01. The authors thank Keely Walker for her help with the manuscript editing and Ian Marcus for his help with data analysis and computer simulations.
References
- Bipatnath M, Dennis PP, Bremer H. Initiation and velocity of chromosome replication in Escherichia coli B/r and K-12. J Bacteriol. 1998;180:265. doi: 10.1128/jb.180.2.265-273.1998. [DOI] [PMC free article] [PubMed] [Google Scholar]
- Bolen JL, Duran O, Klevecz RR. Amplification and damping of deterministic noise in coupled cellular arrays. Physica D. 1993;67:245. [Google Scholar]
- Bruce VG. Mutants of the biological clock in Chlamydomonas reinhardi. Genetics. 1972;70:537. doi: 10.1093/genetics/70.4.537. [DOI] [PMC free article] [PubMed] [Google Scholar]
- Chisholm SW, Costello JC. Influence of environmental factors and population composition on the timing of cell division in Thalassiosira fluviatilis (Bacillariophyceae) grown on light/dark cycles. J Phycol. 1980;16:375. [Google Scholar]
- Collins JM. Rates of DNA synthesis during the S-phase of HeLa cells. J Biol Chem. 1978;253:8570. [PubMed] [Google Scholar]
- Donachie WD. Relationship between cell size and time of initiation of DNA replication. Nature. 1968;219:1077. doi: 10.1038/2191077a0. [DOI] [PubMed] [Google Scholar]
- Feldman JF, Dunlap JC. Neurospora crassa: A unique system for studying circadian clocks. Photochem Photobiol Rev. 1982;7:319. [Google Scholar]
- Feldman JF, Hoyle MN. Isolation of circadian clock mutants of Neurospora crassa. Genetics. 1973;75:605. doi: 10.1093/genetics/75.4.605. [DOI] [PMC free article] [PubMed] [Google Scholar]
- Feldman JF, Gardner G, Denison R. Genetic analysis of the circadian clock of Neurospora. In: Suda M, et al., editors. Biological rhythms and their central mechanism: Naito Foundation Symposium; Tokyo, Japan. 1978; North Holland, Amsterdam: Elsevier; 1979. p. 58. [Google Scholar]
- Hartwell LH, Culotti J, Pringle JR, Reid BJ. Genetic control of the cell division cycle in yeast. Science. 1974;183:46. doi: 10.1126/science.183.4120.46. [DOI] [PubMed] [Google Scholar]
- Hess B, Boiteux A. Oscillatory phenomena in biochemistry. Annu Rev Biochem. 1971;40:237. doi: 10.1146/annurev.bi.40.070171.001321. [DOI] [PubMed] [Google Scholar]
- Holmquist G, Gray M, Porter T, Jordan J. Characterization of Giemsa dark- and light-band DNA. Cell. 1982;31:121. doi: 10.1016/0092-8674(82)90411-1. [DOI] [PubMed] [Google Scholar]
- Jauker F, Cleffmann G. Oscillation of individual generation times in cells lines of Tetrahymena pyriformis. Exp Cell Res. 1970;62:477. doi: 10.1016/0014-4827(70)90582-3. [DOI] [PubMed] [Google Scholar]
- Kapp LN, Millis AJ, Pious DA. Variation in S phase in synchronous human cell lines. In Vitro. 1979;15:669. doi: 10.1007/BF02618245. [DOI] [PubMed] [Google Scholar]
- Kellis M, Birren BW, Lander ES. Proof and evolutionary analysis of ancient genome duplication in the yeast Saccharomyces cerevisiae. Nature. 2004;428:617. doi: 10.1038/nature02424. [DOI] [PubMed] [Google Scholar]
- Klevecz RR. Temporal order in mammalian cells. I. The periodic synthesis of lactate dehydrogenase in the cell cycle. J Cell Biol. 1969;43:207. doi: 10.1083/jcb.43.2.207. [DOI] [PMC free article] [PubMed] [Google Scholar]
- Klevecz RR. Quantized generation time in mammalian cells as an expression of the cellular clock. Proc Natl Acad Sci. 1976;73:4012. doi: 10.1073/pnas.73.11.4012. [DOI] [PMC free article] [PubMed] [Google Scholar]
- Klevecz RR. Cellular oscillators as vestiges of a primitive circadian clock. In: Edmunds L, editor. Cell cycle clocks. Marcel Dekker; New York: 1984. p. 47. [Google Scholar]
- Klevecz RR, Kapp LN. Intermittent DNA synthesis and periodic expression of enzyme activity in the cell cycle of WI-38. J Cell Biol. 1973;58:564. doi: 10.1083/jcb.58.3.564. [DOI] [PMC free article] [PubMed] [Google Scholar]
- Klevecz RR, King GA. Temperature compensation in the mammalian cell cycle. Exp Cell Res. 1982;140:307. doi: 10.1016/0014-4827(82)90119-7. [DOI] [PubMed] [Google Scholar]
- Klevecz RR, Ruddle FH. Cyclic changes in enzyme activity in synchronized mammalian cell cultures. Science. 1968;159:634. doi: 10.1126/science.159.3815.634. [DOI] [PubMed] [Google Scholar]
- Klevecz RR, Bolen JL, Duran O. Self-organization in biological systems. Int J Bifurcation Chaos. 1992;2:941. [Google Scholar]
- Klevecz RR, Kauffman SA, Shymko RM. Cellular clocks and oscillators. Int Rev Cytol. 1984;86:97. doi: 10.1016/s0074-7696(08)60178-3. [DOI] [PubMed] [Google Scholar]
- Klevecz RR, Kros J, Gross SD. Phase response versus positive and negative division delay in animal cells. Exp Cell Res. 1978;116:285. doi: 10.1016/0014-4827(78)90450-0. [DOI] [PubMed] [Google Scholar]
- Klevecz RR, Bolen J, Forrest G, Murray DB. A genomewide oscillation in transcription gates DNA replication and cell cycle. Proc Natl Acad Sci. 2004;101:1200. doi: 10.1073/pnas.0306490101. [DOI] [PMC free article] [PubMed] [Google Scholar]
- Konopka RJ, Benzer S. Clock mutants of Drosophila melanogaster. Proc Natl Acad Sci. 1971;68:2112. doi: 10.1073/pnas.68.9.2112. [DOI] [PMC free article] [PubMed] [Google Scholar]
- Li CM, Klevecz RR. A rapid genome-scale response of the transcriptional oscillator to perturbation reveals a period-doubling path to phenotypic change. Proc Natl Acad Sci. 2006;103:16254. doi: 10.1073/pnas.0604860103. [DOI] [PMC free article] [PubMed] [Google Scholar]
- Margulis L. Origins of species: Acquired genomes and individuality. Biosystems. 1993;31:121. doi: 10.1016/0303-2647(93)90039-f. [DOI] [PubMed] [Google Scholar]
- Murray DB, Beckmann M, Kitano H. Regulation of yeast oscillatory dynamics. Proc Natl Acad Sci. 2007;104:2241. doi: 10.1073/pnas.0606677104. [DOI] [PMC free article] [PubMed] [Google Scholar]
- Murray DB, Klevecz RR, Lloyd D. Generation and maintenance of synchrony in Saccharomyces cerevisiae continuous culture. Exp Cell Res. 2003;287:10. doi: 10.1016/s0014-4827(03)00068-5. [DOI] [PubMed] [Google Scholar]
- Nordstrom K, Dasgupta S. Copy-number control of the Escherichia coli chromosome: A plasmidologist's view. EMBO Rep. 2006;7:484. doi: 10.1038/sj.embor.7400681. [DOI] [PMC free article] [PubMed] [Google Scholar]
- Ohno S. Evolution by gene duplication. Springer; New York: 1970. [Google Scholar]
- Panella G. Paleontological evidence on the earth's rotational history since early precambrian. Astrophys Space Sci. 1972;16:212. [Google Scholar]
- Pittendrigh CS. Circadian systems. I. The driving oscillation and its assay in Drosophila pseudoobscura. Proc Natl Acad Sci. 1967;58:1762. doi: 10.1073/pnas.58.4.1762. [DOI] [PMC free article] [PubMed] [Google Scholar]
- Potten CS, Bullock JC. Cell kinetic studies in the epidermis of the mouse. I. Changes in labeling index with time after tritiated thymidine administration. Experientia. 1983;39:1125. doi: 10.1007/BF01943142. [DOI] [PubMed] [Google Scholar]
- Potten CS, Loeffler M. Stem cells: Attributes, cycles, spirals, pitfalls and uncertainties. Lessons for and from the crypt. Development. 1990;110:1001. doi: 10.1242/dev.110.4.1001. [DOI] [PubMed] [Google Scholar]
- Rossler OE. An equation for continuous chaos. Phys Lett. 1976;35A:397. [Google Scholar]
- Searcy DG. Metabolic integration during the evolutionary origin of mitochondria. Cell Res. 2003;13:229. doi: 10.1038/sj.cr.7290168. [DOI] [PubMed] [Google Scholar]
- Searcy DG, Stein DB, Searcy KB. A mycoplasma-like archaebacterium possibly related to the nucleus and cytoplasms of eukaryotic cells. Ann N Y Acad Sci. 1981;361:312. doi: 10.1111/j.1749-6632.1981.tb46527.x. [DOI] [PubMed] [Google Scholar]
- Shymko RM, Klevecz RR, Kauffman SA. The cell cycle as an oscillatory system. In: Edmunds LN Jr, editor. Cell cycle clocks. Marcel Dekker; New York: 1984. p. 273. [Google Scholar]
- Tu BP, Kudlicki A, Rowicka M, McKnight SL. Logic of the yeast metabolic cycle: Temporal compartmentalization of cellular processes. Science. 2005;310:1152. doi: 10.1126/science.1120499. [DOI] [PubMed] [Google Scholar]
- Turcotte DL, Cisne JL, Nordmann JC. On the evolution of the lunar orbit. Icarus. 1977;30:254. [Google Scholar]
- van der Veen DR, Minh NL, Gos P, Arneric M, Gerkema MP, Schibler U. Impact of behavior on central and peripheral circadian clocks in the common vole Microtus arvalis, a mammal with ultradian rhythms. Proc Natl Acad Sci. 2006;103:3393. doi: 10.1073/pnas.0507825103. [DOI] [PMC free article] [PubMed] [Google Scholar]
- Wells JW. Coral growth and geochronometry. Nature. 1963;197:948. [Google Scholar]