

Abstract
A sensitive and specific quantitative real-time polymerase chain reaction method, involving three rounds of amplification with two allele-specific oligonucleotide primers directed against an rearrangement, was developed to quantify minimal residual disease (MRD) in B-lineage acute lymphoblastic leukemia (ALL). For a single sample containing 10 μg of good quality DNA, MRD was quantifiable down to approximately 10−6, which is at least 1 log more sensitive than current methods. Nonspecific amplification was rarely observed. The standard deviation of laboratory estimations was 0.32 log units at moderate or high levels of MRD, but increased markedly as the level of MRD and the number of intact marker gene rearrangements in the sample fell. In 23 children with ALL studied after induction therapy, the mean MRD level was 1.6 × 10⁻⁵ and levels ranged from 1.5 × 10⁻² to less than 10−7. Comparisons with the conventional one-round quantitative polymerase chain reaction method on 29 samples from another 24 children who received treatment resulted in concordant results for 22 samples and discordant results for seven samples. The sensitivity and specificity of the method are due to the use of nested polymerase chain reaction, one segment-specific and two allele-specific oligonucleotide primers, and the use of a large amount of good quality DNA. This method may improve MRD-based decisions on treatment for ALL patients, and the principles should be applicable to DNA-based MRD measurements in other disorders.
Measurement of minimal residual disease (MRD) is widely used for research and clinical purposes in lymphoid malignancies and can be performed by either flow cytometry or polymerase chain reaction (PCR). The most widely studied malignancy is acute lymphoblastic leukemia (ALL), particularly childhood ALL. In both childhood and adult ALL, the level of MRD at the end of induction therapy or during early consolidation therapy is a very strong predictor of outcome.1,2,3,4 In both, there is a very high probability of relapse for patients with MRD >10−3; whereas, at least in childhood ALL, there is a very high probability of long-term relapse-free survival with MRD <2 × 10⁻⁵. As a result of these observations, the level of MRD is being investigated in clinical trials to determine whether its incorporation into treatment strategy results in improved outcome, and it has already been incorporated into treatment strategy by some centers.
However, both clinical and laboratory problems remain. At the clinical level, most patients are found to have an intermediate level of MRD, and many, if not most, relapses occur in patients in this group. MRD is less predictive of outcome for patients with an intermediate level, but it is not clear whether failure of prediction is due to biological variation unrelated to the level of MRD or to failure of the measured level of MRD to provide an accurate indication of the number of leukemic cells in the patient. There are a number of deficiencies in the laboratory measurement of MRD, which can interact with one another and ultimately impact on clinical decision making. Immunophenotypic or molecular markers cannot be found in all patients and the sensitivity and specificity of the markers that are found may vary. The lower limit of MRD quantifiable by current techniques varies from patient to patient; typically it is approximately 10−4, although it may be lower or higher in some patients. When treatment decisions are based on the result of MRD measurement, the limited sensitivity of current MRD detection together with the inherent imprecision of measurement may result in suboptimal treatment in some patients. Both flow cytometry and PCR as presently performed monitor only the major leukemic clone in the leukemic population, and some relapses are due to subclones not separately identified by the initial MRD measurement. Finally, the limited sensitivity of current methods for MRD measurement complicates the identification of patients who are very sensitive to chemotherapy and in whom a lower intensity of therapy might be able to be safely used.
To address some of these issues, we have developed and characterized a more sensitive and specific PCR-based method for measurement of MRD in B-lineage B-ALL using nested PCR and rearrangement of the immunoglobulin heavy chain gene (IGH) as the molecular marker.
Materials and Methods
Materials
Marrow samples were obtained under anesthesia from 24 children with B-lineage ALL, with ethical approval and consent. One sample was obtained at diagnosis and five samples were obtained at the end of induction, each from a separate aspiration, three being obtained from one iliac spine and two from the other. The children were treated with the Children's Oncology Group induction protocol, which involved treatment with intravenous vincristine, oral dexamethasone, intramuscular l-asparaginase and intrathecal methotrexate, with intravenous daunorubicin for high-risk patients. These drugs were administered over a period of 4 weeks and marrow samples were collected 1 week after cessation of treatment. After collection, cells were stored frozen, transported to Adelaide under dry ice, and stored at −80°C until DNA extraction. Three children with B-ALL who had relapsed were also studied, with samples being obtained at relapse and on one or three occasions during postrelapse therapy. Study of the repertoire of IGH rearrangements5 revealed at least one IGH rearrangement in 23 of the 24 patients studied at diagnosis and in the three patients studied at relapse. The majority of this study involved study of samples from these 26 patients.
Samples of sternal marrow were also obtained with consent from hematologically normal adults during thoracotomy. Samples of peripheral blood were obtained from normal adult volunteers.
In addition, MRD was also measured in a group of patients in whom MRD had previously been measured by the conventional one-round Q-PCR assay. There were 29 samples from 22 children treated at the Adelaide Women's and Children's Hospital as part of the Australian and New Zealand Children's Hematology Oncology Group Study (ANZCHOG) 8 clinical trial. These samples were obtained by marrow aspiration at day 33 or day 79, and separated mononuclear cells were transported to Sydney for MRD measurement. Extra marrow cells that had been taken into EDTA and had been held for 3 to 5 years at −20°C at the Adelaide Women's and Children's Hospital were used for MRD assay at Flinders.
PCR
Genomic DNA was extracted using the Qiagen Flexigene DNA kit according to the manufacturer's instructions. PCR amplifications were performed in 25 μl containing 2 mmol/L Tris-HCl (pH 8.4), 50 mmol/L KCl, 100 ng of each primer, 1 unit of platinum Taq (Invitrogen), 4 mmol/L MgCl2 and 200 μmol/L each of dATP, dUTP, dTTP, and dGTP. Third-round reactions contained 4 pmol of a TaqMan probe binding to a conserved sequence in the J segment.5 Cycling conditions were 92°C for 15 seconds, 58°C for 30 seconds (1 minute for the third round), and 72°C for 30 seconds.
Primers
The overall experimental design including use of primers is shown in Figure 1. In the first PCR round, the IGH variable (V) region primer and joining (J) region primer were specific for the rearranged V segment and J segment. They bound respectively to the complementarity determining region 2 (CDR2) of V and slightly downstream of the J segment. The second and third rounds used internal upstream rearrangement-specific primers and the same downstream J primer. In the first 17 patients studied using a complete IGH rearrangement, the 3′ end of the second-round upstream primer hybridized to the upstream N region and contained, from the 5′ end, 22 consensus bases, then four or six inosines, and then three or four sequence-specific bases. The third round upstream primer then contained the same 22 consensus bases, then four or six guanosines and then eight sequence-specific bases at the 3′ end. Preliminary studies had shown that inosine primers amplified as efficiently as completely sequence-specific primers, but since they were eventually found to result in slight nonspecific amplification in occasional patients, they were not used for the final six patients with complete rearrangements. In these patients, the sequences of the second and third-round upstream primers were completely sequence-specific, and they were designed so that the 3′ end of the second-round primer hybridized to the upstream N region and the 3′ end of the third-round primer hybridized to the downstream N region. Following this change in primer design, similar sequence-specific primers were also synthesized for 16 of the initial 17 patients and used to measure MRD in at least two samples from each patient. In the remaining patient insufficient DNA was available to enable repeat measurement of MRD.
Figure 1.
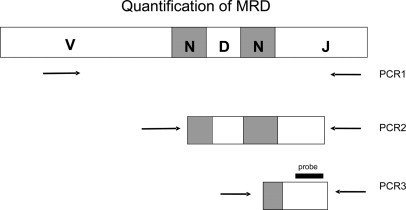
Outline of three-round nested PCR strategy using primers directed toward the rearranged IGH gene. The primer locations as shown are for the completely sequence-specific primers.
If no diversity (D) region could be identified, the 3′ end of the second-round primer, hybridized to the upstream half of the N region, and the 3′ end of the third-round primer hybridized to the entire N region. If the rearrangement was partial, involving only a D and J segment, the same downstream J primer was used for all PCR rounds. The upstream primer for the first PCR round was specific for the family of the rearranged D segment and for the second and third rounds, the upstream primers were sequence-specific and partially overlapping, with their 3′ ends in the N region.
Quantification of Patient Samples
A three-round PCR protocol was used to amplify standard DNA, test DNA, and control DNA. The basic design involved 20 PCR cycles in the first round, a 1:100 dilution of the products into a second round of 20 cycles, and a 1:1000 dilution of the second-round products into a third round, which was a quantitative PCR (Q-PCR) using a TaqMan probe to the consensus J region. Additional dilutions were also made for various samples, as stated below. Unless otherwise stated, all reactions were set up in duplicate, except for the test and control samples in the first PCR round. In these instances, 20 tubes were set up.
Standard DNA
Two reaction tubes containing 1 ng of DNA from the diagnosis sample in a 50-μl PCR were taken through the three rounds of PCR. These tubes provided standards equivalent to an MRD level of 2 × 10⁻³ in the 500 ng of test DNA, but additional 10-fold dilutions were made before the final 1:1000 dilution for the third PCR round to provide additional standards equivalent to 2 × 10⁻⁴, 2 × 10⁻⁵, and 2 × 10⁻⁶. An additional standard of 2 × 10⁻⁷ was used for the two patients studied after relapse. As a control to exclude that the PCR had approached plateau in the second round, a PCR was also set up in which there was an additional 1:10 dilution before the 1:100 dilution for the second round. Previously published criteria for assessing the validity of the standard curve were used.6
Test DNA
A total of 10 μg of DNA was aliquoted into 20 tubes, each containing 500 ng in a 50-μl PCR. After the first round, the products from the 20 tubes were pooled and diluted, and two tubes were taken into the second round. Since samples with high MRD levels could reach a PCR plateau during second-round amplification, additional 10-fold and hundred-fold dilutions of the test DNA were made before the final 1:100 dilution for the second round. Also set up were two tubes each containing 1 ng of diagnosis DNA in 500 ng of test DNA to detect any inhibition produced by test DNA.
Control DNA
Ten micrograms of DNA that had been extracted from peripheral blood cells from a normal individual was amplified in the same manner as the 10 μg of test DNA, except that the additional dilutions were omitted. DNA from a total of 29 normal individuals was used over the course of the study. Two tubes containing all reagents except DNA were also set up to detect any contamination with previously amplified PCR products.
DNA Quality
The fraction of the marker rearrangement molecules that were intact and amplifiable by PCR (termed the amplifiable fraction) was determined by comparison with a reference DNA sample for which the amplifiable fraction of a target sequence of the N-RAS gene of length 330 bp had been previously determined. Lesions in DNA that prevent PCR amplification occur randomly and follow the Poisson distribution7 and this feature enables calculation of the amplifiable fraction of a given target from the Ct values, which are observed when targets of different lengths are amplified. The amplifiable fraction of the N-RAS sequence in the test or diagnosis sample (AFRAS) was calculated from the previously determined amplifiable fraction of the N-RAS sequences in the reference sample and the Ct values observed for the N-RAS sequence in each sample. The amplifiable fraction of the VJ (or DJ) sequence in the test or diagnosis sample was calculated as (AFRAS)330 / l, where l is the length of the VJ (or DJ) sequence. The level of MRD was calculated using the Ct values of the standard curve, the Ct values of the test sample and the amplifiable fractions of the VJ segment in the diagnosis and test DNA. The standard deviation (SD) of laboratory estimation of MRD was determined by measuring the level of MRD in each sample at least twice, on each occasion by a different individual on a different day, to ensure that the measurements were completely independent.
Nonspecificity
In addition to including 10 μg of control DNA from a healthy individual in each experiment, nonspecificity was formally investigated by using a set of three patient-specific primer pairs to assay 10 μg of DNA from other individuals. Twenty-two sets of primers produced for use in 22 patients with ALL were used for 44 estimations on samples of remission marrow obtained from 25 patients with ALL; the same 22 sets of primers were used for 22 estimations on samples of marrow obtained from 10 normal individuals; 20 of the 22 sets of primers were used for 20 estimations on samples of peripheral blood obtained from 19 normal individuals. No primer set was tested on more than two samples in any particular group, and no sample of remission marrow or normal blood was tested with more than two sets of primers. The Ct of any amplification observed was converted to an equivalent MRD level, as determined from a simultaneously performed standard curve, which was based on dilutions of the diagnosis DNA from the patient for whom the primers had been synthesized.
Multiplex PCR
For simultaneous quantification of more than one rearrangement, all of the relevant V and J primers were added to the reaction tubes for the first PCR round, but only the relevant primers were used for separate amplifications in later rounds.
Statistics
MRD values were logarithmically transformed. The estimated MRD level in a patient was the mean of all of the transformed values for that patient, and the magnitude of the variation in laboratory measurement was determined by calculating the SD (SD) of the replicate estimations on each sample. Negative MRD measurements were incorporated into or excluded from the analysis as follows. If an MRD measurement was negative but other measurements on the sample were positive, then that measurement was taken to be the MRD level corresponding to half an intact rearrangement in 10 μg of DNA. If all measurements on a sample were negative, then that sample was excluded from the analysis of measurement variation; the MRD level of that sample was taken to be the level corresponding to half an intact rearrangement in 10 μg of DNA except for the situation when all measurements on all samples from the patient were negative, in which case the MRD level in that patient was taken to be 10−7.5.
Notes on the Protocol
Since completing this study, setting up the standard curve has been modified by adding 500 ng of normal DNA to each of the two reaction tubes that contain 1 ng of DNA from the diagnosis sample.
MRD Measurement by the Conventional One-Round Method
MRD was measured on the AWCH patients using one-round real-time Q-PCR to detect gene rearrangements of immunoglobulin heavy and kappa genes and T-cell receptor δ, δ-α, β, and γ genes. Pairs of patient-specific primers were designed to enable Q-PCR detection of the unique junctional regions identified using the NCBI IgBlast (www.ncbi.nlm.nih.gov/igblast/) database and hard copies circulated by the European Study Group on MRD detection in ALL (ESG-MRD-ALL) and used in conjunction with an appropriate hydrolysis probe.8,9 The MRD data were generated and interpreted according to the guidelines developed by the BFM MRD task force and the European Study Group on Minimal Residual Disease in Acute Lymphoblastic Leukemia.6,10
Results
An example of the fluorescence traces from an MRD assay is shown in Figure 2. This example has been deliberately chosen to also show the sensitivity and specificity of the assay. The measured MRD level was 4 × 10⁻⁷ and presumably one intact leukemic rearrangement in 10 μg of good quality DNA was being detected. The material amplified from the test sample had the same electrophoretic mobility and sequence as the leukemic rearrangement.
Figure 2.
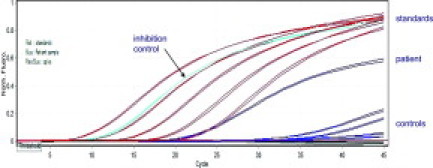
Illustrative fluorescence traces from an MRD assay. The traces for the standards, which range from 2 × 10⁻³ to 2 × 10⁻⁷, the test sample, for which the measured MRD level was 4 × 10⁻⁷, the control for inhibition, which should and does come up at 2 × 10⁻⁴, and the various other controls are shown. This example has been deliberately chosen to show the sensitivity and specificity of the assay, as the test band shared clonal identity with the leukemic rearrangement, having the same electrophoretic mobility and sequence. One intact leukemic rearrangement in 10 μg of good quality DNA was apparently being detected.
Mixing Experiments
To evaluate performance of the assay using samples with known MRD levels, seven experiments were performed in which different amounts of DNA obtained from a leukemic patient at diagnosis were mixed with up to 25 μg of DNA obtained from a healthy individual to provide dilutions ranging from 2 × 10⁻³ to 10−6. A different patient and control DNA were used for each experiment. The results are shown in Figure 3. The line of regression between observed and expected values had a slope of 0.965 and the correlation coefficient was 0.985.
Figure 3.
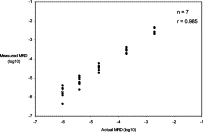
Relationship between the actual value and the measured value of MRD in seven mixing experiments in which various amounts of DNA obtained at diagnosis from a patient with leukemia were mixed with up to 25 μg of DNA from a healthy individual to produce various levels of MRD. The open symbol indicates the one mixture that gave a negative result. The leukemic DNA from this patient was somewhat degraded, with only 6% of rearrangements being intact, and the MRD value shown corresponds to half an intact rearrangement being present in the 25 μg of DNA assayed.
MRD Values after Therapy
In all, 233 MRD estimations were performed on the 115 samples from the 23 newly diagnosed patients studied after induction therapy and 15 MRD estimations were performed on six samples from the three patients who were studied during reinduction. For the Ct values for the final dilution of the standard curve, which corresponded to MRD of 2 × 10⁻⁶, the mean Ct was 20.0, the SD was 2.97, and the 95% confidence interval for the Ct values was 14.0 to 25.9. Inhibition was only seen with one test sample and was not observed when DNA from that sample was re-extracted and assayed.
MRD was quantified using a complete IGH V-D-J rearrangement and inosine primers in 17 patients, a complete IGH rearrangement and completely sequence-specific primers in six patients, and an incomplete D-J rearrangement and completely sequence-specific primers in three patients. Between one and four estimations, nearly always two, were performed on each sample from the patients studied at the end of induction. The mean number of estimations per sample in these patients was 2.03. In 16 of the 17 patients studied with inosine primers, the MRD values were also quantified on at least two samples using completely sequence-specific primers. In 10 of the 16, the results using sequence-specific primers were slightly lower by a mean of 0.17 log units, and although this difference did not reach statistical significance (P = 0.066, two-tailed), the MRD results from the sequence-specific primers were used for these 10 patients. In four of the 16 patients, who all had low MRD values, gene rearrangements were detected and quantified in between one and eight of the 10 estimations using inosine primers but were not detected in either of the two estimations using sequence-specific primers. In these four patients, and in the one patient studied with inosine primers only, the MRD level was taken to be the result using inosine primers minus 0.17 log units. In the final two patients, MRD could not be detected in any estimation with either type of primer.
The distribution of MRD values after induction therapy in the 23 newly diagnosed patients approximated to a normal distribution. The mean MRD mean and median values were both 1.6 × 10⁻⁵, and the SD was 1.69 log units. MRD was >10−3 in four patients (17%), < 10−6 in five (22%), and <10−7 (not detected) in three (13%). Note that in this study the detection limit for a patient was approximately 10−7 owing to the number of independent measurements, nearly always 10, that had been performed on each patient. The same level of detection would not be achievable in a single routine measurement of MRD.
In 10 patients, the level of MRD was measured twice, using as a marker either one or the other of the two gene rearrangements that were present in abundance in the diagnosis sample. The results are shown in Figure 4 and indicate good concordance between the two marker rearrangements, as might be expected if the two rearrangements represented the two principal rearranged alleles in the same leukemic cell. Twenty-two MRD measurements were also performed by multiplex PCR. The results, shown in Figure 5, showed excellent correlation with the corresponding measurements on the same samples performed by singleplex PCR.
Figure 4.
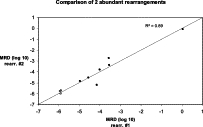
Marrow samples with more than one abundant IGH rearrangement: comparison of levels of two such rearrangements in a single marrow sample. The data show actual MRD levels (closed circles) and the less than MRD level for samples in which MRD was not detected (open circles), corresponding to one intact rearrangement in 10 μg of DNA. The line shows, for reference, the 1:1 correspondence between the two measurements.
Figure 5.
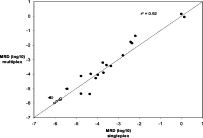
Comparison of MRD measurements determined either as a singleplex PCR or as a multiplex PCR in which the first round also contained primers for a second rearrangement. The data show actual MRD levels (closed circles), the less than MRD level for samples in which MRD was not detected (open circles and corresponding to one intact rearrangement in 10 μg of DNA), and the results for two samples in which MRD was detected by multiplex but not by singleplex PCR (open circles). The line shows, for reference, the 1:1 correspondence between the two measurements.
Nonspecificity
A control of 10 μg of DNA extracted from normal peripheral blood leukocytes was included with each experimental measurement of MRD. Following the occasional observation of slight nonspecificity, primer design was changed from the use of inosine to the use of completely sequence-specific primers. In 33 subsequent quantifications of MRD each with control DNA, one level of 1.3 × 10⁻⁶ was observed, but, in the remaining 32, amplification either did not occur or the Ct corresponded to an MRD level substantially below that associated with one intact gene rearrangement in 10 μg of DNA.
The results of the definitive study of nonspecific amplification associated with use of patient-specific primers are shown in Figure 6. Of the 86 experiments in which 20–22 primer sets were tested against DNA from remission marrow, marrow from a normal individual or peripheral blood from a normal individual, there were only three instances in which nonspecific amplification corresponded to a notional MRD level of >10−6 and which might have confounded interpretation of an MRD result. The actual MRD results in the three patients from whom the primer sets had been obtained were not consistent with the levels of nonspecific amplification that were observed.
Figure 6.
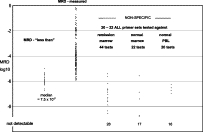
Analysis of limit of detection and nonspecificity. The less than refers to 67 measurements in which MRD was not detected and indicates the hypothetical MRD value that would correspond to one intact marker rearrangement in the 10-μg DNA sample. The second column indicates the measured MRD values in 180 measurements in which MRD was detected and quantified. The last three columns indicate the nonspecific MRD levels when 20 to 22 primer sets were tested against samples of remission marrow from a different patient, normal marrow, or normal peripheral blood mononuclear cells, from 25, 10, and 19 individuals, respectively.
Measurement Variation
Measurement variation was calculated from 134 measurements on 67 samples using the inosine primers and on 59 measurements on 25 samples using patient-specific primers. When the results for patients with MRD levels of >5 × 10⁻⁵ were analyzed, to minimize the contribution of Poisson-type error (see below), the mean SD of laboratory measurement was 0.32, being 0.34 for the inosine primers and 0.31 for the sequence-specific primers. This latter difference was not significant (P > 0.3) and the results for both types of primer were therefore pooled.
As shown in Figure 7, measurement SD depended on the level of MRD and the number of intact amplifiable gene rearrangements in the sample. The latter was calculated from the total mass of DNA studied, namely 10 μg, the figure of 6 pg for the mass of a diploid genome and the fraction of the marker rearrangements in the sample that were intact and amplifiable. The SD rose progressively as the level of MRD fell below 3–5 × 10⁻⁵ and the number of intact rearrangements fell below 30 to 50.
Figure 7.
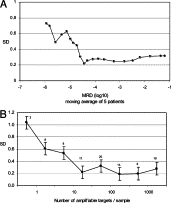
The SD determined from two or more independent measurements of MRD on the same sample. The mean SD results are plotted either in terms of a moving average of five MRD measurements (A) or in terms of the number of intact molecules of the marker IGH rearrangement in the sample of 10 μg of DNA (B). The number shown above each data point in B indicates the number of samples contributing to that data point, and the error bars indicate ±1 SE.
Limit of Detection of MRD
The median amplifiable fraction of IGH marker rearrangements was 0.81 but in 4.0% of the 233 estimations the amplifiable fraction was less than 0.2, indicating significant DNA degradation in these samples. For a sample of 10 μg of DNA in which 0.81 of marker IGH rearrangements are intact, the level of MRD that will result in a mean of one intact rearrangement in the sample is 7.5 × 10⁻⁷, and the level of MRD that will result in a probability of 85% that one or more intact rearrangements are present in the sample is 1.6 × 10⁻⁶. Figure 5 shows the MRD values corresponding to one intact rearrangement in the 67 estimations in which MRD was not detected, and also the MRD values for the 180 estimations in which MRD was detected and quantified. These latter values ranged down to approximately 10−6, indicating that the quantification method is capable of detecting one intact rearrangement in the total sample.
Comparison of One-Round Assay and Nested PCR Assay for Measurement of MRD
The results of this comparison are shown in Figure 8. There were 22 samples in which the results of the two assays were concordant, but there were seven samples in which the results of the two assays were discordant. In the sample with the highest MRD, the one-round Q-PCR method gave a result greater than half a log higher than three-round PCR (5 × 10⁻² compared with 9 × 10⁻³). The other six discordant samples were all for samples with low or undetectable MRD. There was no evidence in the single-round or nested PCR assays of DNA degradation or of inhibitory activity in these samples.
Figure 8.
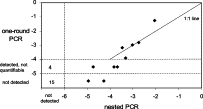
Relationship between MRD results obtained by the conventional one-round assay and the nested PCR assay. MRD levels scored by the one-round assay as detectable but not quantifiable are regarded as falling between 10−4 and 10−5 and the level of detection is regarded as being 10−5 for the one-round assay and 10−6 for the nested PCR assay.
Of the 17 samples that were scored as MRD-negative by the one-round assay, there were 15 that were also scored as negative by the nested PCR and there were two samples, which came from two patients, in which MRD was measured by nested PCR at levels of 1.1 × 10⁻⁵ and 5.3 × 10⁻⁵. Of the seven samples that were scored as detectable but not quantifiable by the one-round Q-PCR assay, there were four samples, which came from four patients, in which MRD was not detected by the nested PCR assay. The review of the MRD data for the single-round RQ-PCR method showed that in three of these four samples the low level of MRD positivity was confirmed in a second assay with the first markers and that the second markers used for the patients had consistently given negative results for the sample, in keeping with the three-round RQ-PCR results. In the fourth case, both markers were consistently MRD-positive by single-round RQ-PCR.
Discussion
Although the measurement of MRD early during treatment is a powerful prognostic indicator in B-lineage ALL, the clinical utility of measurement of MRD by PCR is closely related to the strengths and weaknesses of the methods used for its measurement. Wasserman et al11 used a cloning technique and were the first to prospectively show a relationship between MRD level and patient outcome. Brisco et al1 used a sensitive limiting dilution method involving nested PCR that used two allele-specific oligonucleotides (ASOs) to study a group of children with standard risk ALL; they documented the relationship between clinical outcome and the level of MRD at the end of induction for patients with high, intermediate, or low levels of MRD. Similar observations were made by two later studies,2,4 which involved larger numbers of patients and more time points, but which used less sensitive techniques to measure MRD, in one case competitive PCR and in the other case PCR followed by probe hybridization. These early results have been confirmed by many subsequent studies but the cumbersome methods used in the above studies have largely been replaced by real-time Q-PCR using an ASO primer to provide specific detection of the leukemic gene rearrangement. Several groups have reported a nested or semi-nested PCR approach using a single ASO primer,12,13 but the sensitivity and specificity thus achieved have been variable, and the strategy of a single-round Q-PCR using one ASO primer has been more widely used. The European Study Group on MRD in ALL has recently published guidelines for interpretation of PCR data using this approach.6 The ESG categorizes MRD results as being in either the quantifiable range, which usually applies to results at or above 10−4, the detectable but not quantifiable range, which usually applies to results somewhat below 10−4, or as being not detectable. The limits of these categories are determined largely by limits posed by the standard curve and by the presence of nonspecific amplification.
The method described herein has retained nested PCR, using one segment-specific and two ASO primers, to provide specificity, and combined it with Q-PCR, to provide ease of quantification. IGH gene rearrangements identified by analysis of the total repertoire of IGH rearrangements present at diagnosis5 were used as markers. IGH rearrangements, as opposed to some other rearrangements, such as those involving the T-cell receptor γ gene, enable the design of multiple and relatively specific primers.
A nested PCR system has several technical advantages for measurement of MRD. First, it enables a PCR round to finish without an undue number of cycles having to be performed; efficiency of amplification and reproducibility both tend to decline when the PCR is prolonged. Second, it produces a standard curve that covers low MRD levels and is not affected by the Poisson effect. Third, and most importantly, a nested PCR with multiple patient-specific primers reduces nonspecific amplification that results from interaction between the ASO primer for the marker rearrangement and rearrangements in nonleukemic lymphocytes.
Nonspecific amplification (NSA), if present, may either produce false positive results or limit the sensitivity of detection of MRD. The issue is its frequency in control samples from an individual. With the one-round PCR assay, NSA has been observed in a proportion of control samples which have been produced by pooling DNA from a number of healthy individuals, and it has also been observed, probably at a lower frequency, in control marrow samples obtained from individuals with leukemia during chemotherapy.14 If NSA is observed in a control sample, then its presence cautions that a positive result on a patient sample may be a false positive, but even a negative result on a control sample does not guarantee that a positive result on a patient sample is a true positive, since the level of NSA may vary between individuals and may even vary at different times in the same individual.14
By contrast, NSA in individual samples was rarely observed with the nested PCR strategy. Only four of 119 tests using patient-specific primers showed a low level of nonspecificity, 1–3 × 10⁻⁶, in the true-positive range. Performing confirmatory electrophoresis when MRD levels of between 10−5 and 10−7 are observed, as was done in the example illustrated in Figure 2, will for practical purposes eliminate false positives. With current treatment protocols false positive results are unlikely to lead to suboptimal treatment, since nearly all patients with such results will be classified as being of intermediate rather than high risk and since treatment for intermediate risk patients is the same as that for standard risk patients. However if reduced intensity treatment for patients with low MRD levels becomes established, then some patients with false positive MRD levels may in the future receive inappropriately intensive treatment.
When NSA is eliminated, the sensitivity of MRD detection is determined by the inherent sensitivity of the PCR. The data in Figure 6 indicate that, for a single MRD estimation, transition between detection and non-detection of MRD occurs at a level of approximately 1.6 × 10⁻⁶, which, from Poisson statistics, is level at which there is an 85% probability that there will be at least one intact amplifiable rearrangement in 10 μg of good quality DNA. If the presence of one amplifiable target in a PCR determines whether or not a positive result is obtained, then the quantity and quality of the DNA studied become the factors that determine the sensitivity of detection of MRD. We assayed 10 μg of DNA and found that the median amplifiable fraction for IGH target gene rearrangements was 0.81, although in 4% of samples the amplifiable fraction was less than 0.2, indicating significant degradation in these samples. The effect of degradation was exemplified in the mixing experiments shown in Figure 3, in which, owing to an amplifiable fraction of 0.06 in one leukemic sample, an MRD level of 10−6 was not detected despite assaying 25 μg of DNA.
Any measurement is subject to imprecision and several factors may contribute to imprecision in measurement of MRD. Anatomical heterogeneity of leukemia may contribute to variance in occasional patients.15,16 Figure 7 shows the SD of measurement of MRD in our laboratory in terms of either the level of MRD or the number of amplifiable IGH rearrangements in the assay. The SD was 0.32 log units when the MRD level and the number of rearrangements were intermediate or high, which would give 95% confidence limits for an MRD estimate as being that estimate multiplied or divided by 4.4, or by 3.1 if two independent MRD estimates had been performed. However, the SD rose steeply as the MRD level and the number of rearrangements in the assay fell below a critical level, approximately 3–5 × 10⁻⁵ for the level of MRD and 30 to 50 for the number of rearrangements. This increase in SD was almost certainly due to the stochastic variation that is inherent in the quantification of a small number of events and that is described by the Poisson distribution. In this case the events are the individual amplifiable IGH rearrangements in the assay, and it is evident that their number may fall below the critical level of 30 to 50 when the MRD level is low, and/or only a small amount of DNA is studied, and/or the DNA is excessively degraded. When 10 μg of relatively intact DNA were studied, the critical level of MRD that provided 30 to 50 amplifiable rearrangements in the assay was approximately 4 × 10⁻⁵, but if only 1 to 1.5 μg of test DNA had been studied, as is commonly done, the critical level would have been approximately 3–4 × 10⁻⁴. For MRD assays in which the standard curve is a one-round PCR, similar considerations concerning DNA quantity and quality, and their effect on Poisson error, also apply to the standard curve. Variances are additive, and MRD assays using one-round PCR may therefore be affected by Poisson error at MRD levels above 4 × 10⁻⁴, particularly if there is some degradation of the standard and/or the test DNA. Since MRD-based clinical decisions may use cut-off levels of 10−3 or 10−4, measurement error may potentially result in incorrect treatment in some patients.
The sensitivity of nested PCR may have other clinical implications. Measuring MRD in blood would have the practical advantage that sampling blood is less invasive than sampling marrow and the theoretical advantage that sampling error might be minimized since blood equilibrates with all areas of marrow. However in B-ALL the level of MRD in blood is approximately 1/10 that in marrow.17,18 The increased sensitivity of nested PCR might overcome this problem, since, performed in duplicate on a single sample, it should enable detection of MRD in blood down to approximately 5 × 10⁻⁷ and precise quantification down to approximately 2 × 10⁻⁵. These levels would correspond to an MRD level in marrow of approximately 5 × 10⁻⁶ and 2 × 10⁻⁴ respectively, which suggests that quantifying MRD in blood may give clinically useful information for patients at all levels of MRD.
In some patients with B-ALL who relapse, the marker sequence of the relapse clone differs from the marker sequence identified at diagnosis,19,20 and retrospective analysis has shown that this relapse clone can often be detected at diagnosis as a small chemoresistant clone.21,22 Small leukemic clones can now be separately identified at diagnosis5 and, if such prospectively identified clones could be shown to be chemoresistant, then some patients whose relapse is not predicted by current techniques might be able to be identified soon after diagnosis. The present method provides high sensitivity, which is necessary for the determination of chemosensitivity of small clones, and the ability to multiplex, which simplifies the study of several different clones.
The high rate of cure in childhood ALL resulting from current high-intensity treatment has come at the cost of overtreating many of those cured, as evidenced by the substantial rates of cure achieved by older treatments of lower intensity. There is currently great interest in determining whether patients whose leukemia is very sensitive to chemotherapy might be treatable at lower intensity without increasing the probability of relapse. MRD negativity with the one-round PCR identifies a group of patients who have a very high probability of cure with current therapy.4,23 Since the level of sensitivity of one-round PCR as currently performed is approximately 10−5, this group will contain patients with a variety of MRD levels of less than 10−5 and also a few patients with low levels of MRD who are mistakenly scored as negative owing to the imprecision of the one-round assay. It is not yet known how patients in this group will fare when treated with therapy of lower intensity but it seems likely that patients with the higher MRD values will be at the greatest risk of relapse as the intensity of therapy is reduced. We therefore suggest that the increased sensitivity and precision of the present method should enable better identification of patients who are at least risk and therefore most likely to benefit from reduction of therapy. Patients with MRD levels of <10−6 at the end of induction, 22% of patients in the present study, would seem to be prime candidates.
Toward the end of this study we were able to use this new method on a limited number of additional samples, 29 samples from 24 patients, which had been previously tested for MRD by the conventional one-round Q-PCR assay. Firm conclusions cannot be drawn, but the results do suggest that the principles discussed above may have some relevance. There was good agreement between the two methods for 22 samples (76%), and six of the seven discordant results involved MRD negativity detected by one method and a low level of MRD (<5 × 10⁻⁵) detected by the other method. None of these differences could be ascribed to false negativity due to degradation or poor amplifiability of the DNA. Some of the differences might be ascribable to differences in the samples studied or to differences in the number of markers used, being two in the one-round assay and one in the nested PCR assay.
While the discrepancies between RQ-PCR methodologies at low MRD levels (<5 × 10⁻⁵) are of limited significance for current established treatment of ALL, the growing interest in therapy reduction makes it more important to measure MRD at these low levels with highest sensitivity and specificity to ensure reduction in therapy does not lead to overtreatment or undertreatment of certain groups of patients. Resolution on the best method of MRD measurement will almost certainly require further extensive laboratory study and also parallel MRD assays in a large number of patients and correlation of the results with clinical outcome.
In summary, as compared with a one-round system, the nested PCR system described herein provides potential advantages of increased precision, avoidance of false positives, and greater sensitivity. Although a three-round PCR is more complex than a one-round PCR, the difference is not great, as MRD estimations on two patients can comfortably be performed on the same day by one individual using one real-time instrument. However, any extra time and expense involved need to be balanced against the value of the extra information that is gained, particularly in view of the substantial personal and financial consequences associated with clinical decisions based on MRD levels.
Finally, although this investigation has focused on childhood ALL, the principles developed are applicable to any disorder in which MRD is being sensitively detected and quantified. The present protocol should be directly applicable to other neoplasms of lymphoid origin, including adult ALL, myeloma and chronic lymphocytic leukemia, but use of other markers should enable it to be applied to other hematological and non-hematological disorders. For example, recent studies using the BCR-ABL translocation sequence as a marker, have shown that MRD in chronic myeloid leukemia can similarly be detected and quantified down to 10−6 (Bartley et al, manuscript in preparation). However in some circumstances it may not be necessary to use three or even two rounds of PCR, depending on factors such as the extent to which nonspecificity is a problem or the level of detection that is desired.
Acknowledgements
We thank all individuals involved in collection and transport of samples. We thank the Australasian Leukemia and Lymphoma Group and ANZCHOG for access to samples.
Footnotes
Supported by the National Health and Medical Research Council of Australia, the Cancer Council of South Australia, the Financial Markets Foundation for Children, and The Cancer Council of New South Wales. Children's Cancer Institute Australia is affiliated with the University of NSW and the Sydney Children's Hospital.
M.J.B., P.J.S., A.A.M., and Flinders University hold equity in Monoquant P/L, which has submitted a patent application to cover repertoire analysis.
References
- 1.Brisco MJ, Condon J, Hughes E, Neoh SH, Sykes PJ, Seshadri R, Toogood I, Waters K, Tauro G, Ekert H. Outcome prediction in childhood acute lymphoblastic leukaemia by molecular quantification of residual disease at the end of induction. Lancet. 1994;343:196–200. doi: 10.1016/s0140-6736(94)90988-1. [DOI] [PubMed] [Google Scholar]
- 2.Cave H, van der Werff ten Bosch J, Suciu S, Guidal C, Waterkeyn C, Otten J, Bakkus M, Thielemans K, Grandchamp B, Vilmer E. Clinical significance of minimal residual disease in childhood acute lymphoblastic leukemia. European Organization for Research and Treatment of Cancer–Childhood Leukemia Cooperative Group. N Engl J Med. 1998;339:591–598. doi: 10.1056/NEJM199808273390904. [DOI] [PubMed] [Google Scholar]
- 3.Coustan-Smith E, Behm FG, Sanchez J, Boyett JM, Hancock ML, Raimondi SC, Rubnitz JE, Rivera GK, Sandlund JT, Pui CH, Campana D. Immunological detection of minimal residual disease in children with acute lymphoblastic leukaemia. Lancet. 1998;351:550–554. doi: 10.1016/S0140-6736(97)10295-1. [DOI] [PubMed] [Google Scholar]
- 4.van Dongen JJ, Seriu T, Panzer-Grumayer ER, Biondi A, Pongers-Willemse MJ, Corral L, Stolz F, Schrappe M, Masera G, Kamps WA, Gadner H, van Wering ER, Ludwig WD, Basso G, de Bruijn MA, Cazzaniga G, Hettinger K, van der Does-van den Berg A, Hop WC, Riehm H, Bartram CR. Prognostic value of minimal residual disease in acute lymphoblastic leukaemia in childhood. Lancet. 1998;352:1731–1738. doi: 10.1016/S0140-6736(98)04058-6. [DOI] [PubMed] [Google Scholar]
- 5.Brisco MJ, Latham S, Sutton R, Hughes E, Wilczek V, van Zanten K, Budgen B, Bahar AY, Malec M, Sykes PJ, Kuss BJ, Waters K, Venn NC, Giles JE, Haber M, Norris MD, Marshall GM, Morley AA. Determining the repertoire of IGH gene rearrangements to develop molecular markers for minimal residual disease in B-lineage acute lymphoblastic leukemia. J Mol Diagn. 2009;11:194–200. doi: 10.2353/jmoldx.2009.080047. [DOI] [PMC free article] [PubMed] [Google Scholar]
- 6.van der Velden VH, Cazzaniga G, Schrauder A, Hancock J, Bader P, Panzer-Grumayer ER, Flohr T, Sutton R, Cave H, Madsen HO, Cayuela JM, Trka J, Eckert C, Foroni L, Zur Stadt U, Beldjord K, Raff T, van der Schoot CE, van Dongen JJ. European Study Group on MRDdiALL: Analysis of minimal residual disease by Ig/TCR gene rearrangements: guidelines for interpretation of real-time quantitative PCR data. Leukemia. 2007;21:604–611. doi: 10.1038/sj.leu.2404586. [DOI] [PubMed] [Google Scholar]
- 7.Deagle BE, Eveson JP, Jarman SN. Quantification of damage in DNA recovered from highly degraded samples: a case study of DNA in faeces. Frontiers Zool. 2006;3:11. doi: 10.1186/1742-9994-3-11. [DOI] [PMC free article] [PubMed] [Google Scholar]
- 8.van der Velden VHJ, Hochhaus A, Cazzaniga G, Szczepanski T, Gabert J, van Dongen JJM. Detection of minimal residual disease in hematologic malignancies by real-time quantitative PCR: principles, approaches, and laboratory aspects. Leukemia. 2003;17:1013–1034. doi: 10.1038/sj.leu.2402922. [DOI] [PubMed] [Google Scholar]
- 9.Sutton R, Bahar AY, Kwan E, Giles JE, Venn NC, Tran S, Hackenberg H, Marshall GM, Haber M, van der Velden V, Norris MD. Improving minimal residual disease testing in precursor-B-ALL based on immunoglobulin kappa and heavy chain gene rearrangements. Leukemia. 2008;22:2265–2267. doi: 10.1038/leu.2008.121. [DOI] [PubMed] [Google Scholar]
- 10.van der Velden VH, Panzer-Grumayer ER, Cazzaniga G, Flohr T, Sutton R, Schrauder A, Basso G, Schrappe M, Wijkhuijs JM, Konrad M, Bartram CR, Masera G, Biondi A, van Dongen JJ. Optimization of PCR-based minimal residual disease diagnostics for childhood acute lymphoblastic leukemia in a multi-center setting. Leukemia. 2007;21:706–713. doi: 10.1038/sj.leu.2404535. [DOI] [PubMed] [Google Scholar]
- 11.Wasserman R, Galili N, Ito Y, Silber JH, Reichard BA, Shane S, Womer RB, Lange B, Rovera G. Residual disease at the end of induction therapy as a predictor of relapse during therapy in childhood B-lineage acute lymphoblastic leukemia. J Clin Oncol. 1992;10:1879–1888. doi: 10.1200/JCO.1992.10.12.1879. [DOI] [PubMed] [Google Scholar]
- 12.Donovan JW, Ladetto M, Zou G, Neuberg D, Poor C, Bowers D, Gribben JG. Immunoglobulin heavy-chain consensus probes for real-time PCR quantification of residual disease in acute lymphoblastic leukemia. Blood. 2000;95:2651–2658. [PubMed] [Google Scholar]
- 13.Nakao M, Janssen JW, Flohr T, Bartram CR. Rapid and reliable quantification of minimal residual disease in acute lymphoblastic leukemia using rearranged immunoglobulin and T-cell receptor loci by LightCycler technology. Cancer Res. 2000;60:3281–3289. [PubMed] [Google Scholar]
- 14.van der Velden VH, Wijkhuijs JM, van Dongen JJ. Non-specific amplification of patient-specific Ig/TCR gene rearrangements depends on the time point during therapy: implications for minimal residual disease monitoring. Leukemia. 2008;22:641–644. doi: 10.1038/sj.leu.2404925. [DOI] [PubMed] [Google Scholar]
- 15.van der Velden VH, Hoogeveen PG, Pieters R, van Dongen JJ. Impact of two independent bone marrow samples on minimal residual disease monitoring in childhood acute lymphoblastic leukaemia. Br J Haematol. 2006;133:382–388. doi: 10.1111/j.1365-2141.2006.06056.x. [DOI] [PubMed] [Google Scholar]
- 16.Morley AA, Latham S, Brisco MJ, Sykes PJ, Kuss BJ, Waters K. Improved measurement of minimal residual disease (MRD) Blood (ASH Annual Meeting Abstracts) 2006;108:2284. [Google Scholar]
- 17.Brisco MJ, Sykes PJ, Hughes E, Dolman G, Neoh SH, Peng LM, Toogood I, Morley AA. Monitoring minimal residual disease in peripheral blood in B-lineage acute lymphoblastic leukaemia. Br J Haematol. 1997;99:314–319. doi: 10.1046/j.1365-2141.1997.3723186.x. [DOI] [PubMed] [Google Scholar]
- 18.Coustan-Smith E, Sancho J, Hancock ML, Razzouk BI, Ribeiro RC, Rivera GK, Rubnitz JE, Sandlund JT, Pui CH, Campana D. Use of peripheral blood instead of bone marrow to monitor residual disease in children with acute lymphoblastic leukemia. Blood. 2002;100:2399–2402. doi: 10.1182/blood-2002-04-1130. [DOI] [PubMed] [Google Scholar]
- 19.Li A, Zhou J, Zuckerman D, Rue M, Dalton V, Lyons C, Silverman LB, Sallan SE, Gribben JG. Sequence analysis of clonal immunoglobulin and T-cell receptor gene rearrangements in children with acute lymphoblastic leukemia at diagnosis and at relapse: implications for pathogenesis and for the clinical utility of PCR-based methods of minimal residual disease detection. Blood. 2003;102:4520–4526. doi: 10.1182/blood-2003-05-1455. [DOI] [PubMed] [Google Scholar]
- 20.Szczepanski T, Willemse MJ, Brinkhof B, van Wering ER, van der Burg M, van Dongen JJ. Comparative analysis of Ig and TCR gene rearrangements at diagnosis and at relapse of childhood precursor-B-ALL provides improved strategies for selection of stable PCR targets for monitoring of minimal residual disease. Blood. 2002;99:2315–2323. doi: 10.1182/blood.v99.7.2315. [DOI] [PubMed] [Google Scholar]
- 21.de Haas V, Verhagen OJ, von dem Borne AE, Kroes W, van den Berg H, van der Schoot CE. Quantification of minimal residual disease in children with oligoclonal B-precursor acute lymphoblastic leukemia indicates that the clones that grow out during relapse already have the slowest rate of reduction during induction therapy. Leukemia. 2001;15:134–140. doi: 10.1038/sj.leu.2401970. [DOI] [PubMed] [Google Scholar]
- 22.Choi S, Henderson MJ, Kwan E, Beesley AH, Sutton R, Bahar AY, Giles J, Venn NC, Pozza LD, Baker DL, Marshall GM, Kees UR, Haber M, Norris MD. Relapse in children with acute lymphoblastic leukemia involving selection of a pre-existing drug-resistant subclone. Blood. 2007;110:632–639. doi: 10.1182/blood-2007-01-067785. [DOI] [PubMed] [Google Scholar]
- 23.Flohr T, Schrauder A, Cazzaniga G, Panzer-Grümayer R, van der Velden V, Fischer S, Stanulla M, Basso G, Niggli FK, Schäfer BW, Sutton R, Koehler R, Zimmermann M, Valsecchi MG, Gadner H, Masera G, Schrappe M, van Dongen JJ, Biondi A, Bartram CR. International BFM Study Group (I-BFM-SG) (2008) Minimal residual disease (MRD)-directed risk stratification using real-time quantitative PCR analysis of immunoglobulin and T-cell receptor gene rearrangements in the international multicenter trial AIEOP-BFM ALL 2000 for childhood acute lymphoblastic leukemia (ALL) Leukemia. 2008;22:771–782. doi: 10.1038/leu.2008.5. [DOI] [PubMed] [Google Scholar]