

Abstract
Purpose
To understand the effects of comorbidity and urinary incontinence on both generic and incontinence-specific quality of life outcome measures and to investigate whether the association between urinary incontinence and quality of life varies by race.
Materials and Methods
Study participants were 2,109 women aged 40-69 randomly selected from an urban health maintenance organization and interviewed in person for a study of risk factors for urinary incontinence. The sample was racially diverse consisting of 48% Caucasians, 18% African-Americans, 17% Hispanics, and 16% Asian-Americans. In addition to incontinence, reproductive and medical history questionnaires, all participants completed the Medical Outcomes Study Short Form 36, a measure of health related quality of life. All participants with daily and weekly incontinence (49%) completed the Incontinence Impact Questionnaire, an incontinence specific quality of life measure. The health maintenance organization’s inpatient and outpatient electronic databases were used to calculate a Charlson comorbidity index score for each participant. Analysis of covariance was used to produce a model adjusting for sociodemographic variables, comorbidity, and incontinence frequency. The same model was run for each of four racial groupings to examine differences by race/ethnicity.
Results
Urinary incontinence is significantly associated with a decreased quality of life; those with more frequent incontinence have significantly lower quality of life scores. In our model, the Charlson score, an objective measure of comorbidity based on hospital and physician records, also has a significant negative impact on quality of life. When comorbidity is controlled, incontinence frequency continues to have a significant negative association with quality of life except among the sickest women. For women with the greatest extent of comorbidity, incontinence frequency is not significantly associated with negative quality of life outcomes. We did not find clear patterns of variation by race.
Conclusion
Urinary incontinence and comorbidity each play an independent and significant role in reducing quality of life outcomes for all but the sickest women.
Keywords: urinary incontinence, quality of life, ethnic groups, women’s health
Urinary incontinence and declining health are both often viewed as natural parts of aging, and it has been established that urinary incontinence and poor health are related. Stroke, obesity, diabetes, congestive heart failure, and chronic obstructive pulmonary disease all have been found to increase an individual’s risk of urinary incontinence.(1) It is also well established that those same chronic diseases have a significant impact on quality of life.(2) What is less clearly understood, however, is the extent to which urinary incontinence affects quality of life separate from its association with comorbid conditions.(3;4)
Previous researchers have pointed out that the research on the impact of urinary incontinence has not adequately addressed the role comorbidity may play in the relationship between urinary incontinence and quality of life.(3-5) Prior studies that have included comorbidity have measured it as the number of diseases reported by the participant,(1;5) as the presence or absence of one or more illnesses,(6) or by excluding those with specified chronic conditions from analysis.(4;7;8) In most cases, comorbidity is established by self-report at the time of data collection.
A few studies have examined whether the relationship between urinary incontinence and quality of life varies by severity of a specific co-morbid condition, such as depression(8;9) or kidney disease.(10) This research has produced conflicting models. Depressed patients rate their urinary incontinence symptoms as significantly more severe than do their non-depressed counterparts, despite clinically similar incontinence levels, (8;9) suggesting that the presence of co-morbid disease serves to amplify the negative impact that urinary incontinence on quality of life. On the other hand, a study comparing the impact of urinary incontinence on quality of life in kidney transplant recipients and non-transplant controls found that non-transplant controls reported 200% greater impact of urinary incontinence on activities of daily living than the kidney transplant recipients(10) suggesting that comorbidity minimizes the effects that urinary incontinence has on quality of life perhaps by putting urinary incontinence into perspective.(10)
Like research focusing on comorbidity and incontinence, the research on racial differences in urinary incontinence and quality of life outcomes has also been limited. Most studies addressing the impact of incontinence on quality of life have been conducted on racially homogeneous samples. The Study of Women’s Health Across the Nation (SWAN) study, however, looked at the life impact of incontinence in an ethnically diverse sample,(11) and Bogner(12) compared psychological distress caused by incontinence in African American and Caucasian women. Both studies suggest that the life impact of incontinence may be greater for Hispanics and African-Americans than for Caucasians.
In this paper we analyze data from a population based, ethnically diverse cohort of Caucasian, African-American, Asian-American, and Hispanic women, using a measure of comorbidity based on conditions coded from outpatient visits and hospitalizations, to investigate the effects of urinary incontinence and comorbidity on 1) general health-related quality of life scores and 2) urinary incontinence-specific quality of life scores.
Materials And Methods
The Reproductive Risks of Incontinence Study at Kaiser (RRISK) cohort has been described in detail elsewhere.(13) 2,109 women participated in the Reproductive Risks of Incontinence Study at Kaiser (RRISK). All participants were members of Kaiser Permanente, Northern California (KPNC), an integrated health care delivery system. The study cohort was drawn from a sample of approximately 30,000 women aged 40 to 69. A study objective was to achieve a final sample composed of 40% Caucasians, 20% African-Americans, 20% Hispanics, and 20% Asian-Americans evenly divided among six separate 5-year age categories (40-45, 46-50, 51-55, 56-60, 61-65, 66-69). As race and age categories reached their targeted maximum number, they were ‘closed’ and recruitment continued among the other race and age categories. In this manner the final study sample achieved a racial distribution of 47.6% Caucasians, 18.2% African-Americans, 16.6% Hispanics, and 16.4% Asian-Americans.(13)
All study participants completed the Medical Outcomes Study Short Form 36 (MOS SF-36), a validated measure of health related quality of life.(2) The MOS SF-36 has two summary scores (one for mental health and one for physical health) that we use for this paper. All participants with weekly or daily incontinence (n=603) completed the Incontinence Impact Questionnaire (IIQ), a validated urinary incontinence specific quality of life measure.(14;15) All study procedures and instruments were approved by the Kaiser Foundation Research Institute Internal Review Board.
Data on comorbid conditions were collected from the health maintenance organization’s inpatient and outpatient database systems. International Classification of Disease-9 codes for each participant were pulled for the year prior to the date of interview. The period of a year was chosen to correspond to the version of the SF-36 used, which asked for health status within the past twelve months. A SAS program was run on the data to produce a Charlson comorbidity score for each participant, with a score of ‘0’ indicating no disease and higher numbers indicating higher comorbidity levels.(16) In the Charlson index each comorbid condition is assigned a relative weight and the ranked diseases are then added together to produce a total comorbidity score. Although the Charlson index was originally designed to predict an individual’s risk of death within a relatively short period of time, it is also used to quantify comorbidity status in association with variables other than mortality such as quality of life, medication adherence, and healthcare costs.
Our primary analysis examined the association between frequency of incontinence and comorbidity with general quality of life measured by the MOS SF-36 (physical component summary (PCS) and mental component summary (MCS)) and incontinence-specific quality of life measured by the IIQ. Incontinence frequency was defined as the self-reported frequency of incontinence in the past twelve months divided into five categories: never, less than monthly, monthly, weekly, and daily. An individual who reported incontinence “once or more each month” was categorized as have monthly incontinence with similar criteria for weekly and daily incontinence. Due to the relatively low number of participants with a Charlson score greater than 1 (6.9% of the sample) we grouped the Charlson comorbidity scores into three categories: zero (indicating no comorbidity), one (indicating diseases weighted as ‘1’ such as diabetes, chronic obstructive pulmonary disease, or heart disease) and scores of greater than one (indicating more severe diseases such as leukemia and/or more than one disease with a weighting of ‘1’). Analyses of covariance (using SAS 9.1) were run to control for sociodemographic and comorbidity variables. Our general model adjusted for age, body mass index, income, Charlson comorbidity score, and race. We ran the adjusted model stratified by race and by Charlson comorbidity score, compared estimated means by Charlson score and race, and tested for linear trend for the SF-36 results.
Results
Table 1 shows the demographic characteristics of the sample. The cohort was generally healthy, as can been seen by the majority of participants who had a Charlson score of 0.
Table 1.
Participant demographics, incontinence frequency, Charlson comorbidity score
| Category | n | % |
|---|---|---|
| Age | ||
| 40-49 | 634 | 30.08 |
| 50-59 | 802 | 38.05 |
| 60-75 | 672 | 31.88 |
| Race | ||
| Caucasian | 1003 | 47.58 |
| African-American | 383 | 18.17 |
| Asian | 345 | 16.37 |
| Hispanic | 349 | 16.56 |
| Native Amer./Other | 28 | 1.33 |
| Income | ||
| <$40,000 | 471 | 24.17 |
| $40,000-$79,999 | 847 | 43.46 |
| >=$80,000 | 631 | 32.38 |
| Incontinence Frequency Past 12 Months | ||
| Never incontinent | 591 | 28.05 |
| <Monthly incontinence | 609 | 28.9 |
| Monthly (incontinent once or more each month) | 304 | 14.43 |
| Weekly (incontinent once or more each week) | 341 | 16.18 |
| Daily (incontinent once or more each day) | 262 | 12.43 |
| Charlson Comorbidity Score | ||
| 0=no comorbid conditions | 1634 | 77.51 |
| 1=comorbid condition weighted as 1 | 308 | 15.61 |
| >1=comorbid condition weighted as 2, 3 or 6 or combination of conditions | 166 | 6.88 |
Urinary incontinence and quality of life outcomes
In the final model adjusted for age, body mass index, income, Charlson and race, incontinence frequency is significantly associated with differences in estimated outcome scores for the all three quality of life measures (p <.0001 for PCS, MCS and IIQ). Figure 1 shows that the adjusted PCS and MCS scores decrease (indicating worsening of quality-of-life) as incontinence frequency increases (p<.0001 by test for trend). Adjusted IIQ results are similar; significantly higher for those with daily incontinence than for those with weekly incontinence. There is a clear trend of worsening quality of life scores (decreasing for the SF-36 and increasing for the IIQ) with increasing levels of incontinence frequency. This trend is generally unaffected by adjustment for sociodemographic factors. For physical component scores, every other increase in incontinence frequency category (e.g. from less than monthly incontinence to monthly incontinence, from weekly incontinence to daily incontinence) is significantly associated with a decrease in quality of life outcome. The largest differences in adjusted scores for the PCS come from differences between less than monthly and monthly incontinence as well as between weekly and daily incontinence. Mental component scores show the same overall linear shape of association with only a small upturn in scores at the level of weekly incontinence. For the mental component summary, the largest difference in adjusted score was between the less than monthly and monthly incontinence categories.
Figure 1. Adjusted* SF-36 scores by incontinence frequency past 12 months.
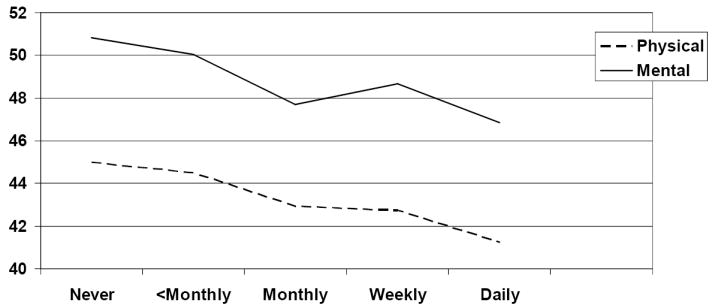
*Adjusted for age, body mass index, income, Charlson comorbidity score, race. Higher SF-36 scores indicate higher quality of life.
Comorbidity
Comorbidity as measured by the Charlson score, has a persistently significant effect in the final adjusted model for the SF-36 (p<.0001 for PCS, p<.01 for MCS) but not for the IIQ (p=0.26). The negative effect of incontinence on quality of life persists even when adjusting for comorbidity. We also found a significant interaction effect by Charlson score on the association between urinary incontinence frequency for the PCS. The interaction variable was significant in the final adjusted model for the PCS (p = .01) and borderline significant for the MCS (p = .05).
Our analysis of the SF-36 stratified by Charlson level shows that frequency of urinary incontinence has a significant negative association with quality of life for all but the sickest women. For women with a Charlson score of 0 or 1, lower general quality of life scores in both the physical and mental health areas are significantly associated with increasing incontinence frequency. (For Charlson=0 p<.001 PCS and p<.0001 MCS, for Charlson=1 p=.01 PCS and p =.02 MCS). Among the sickest women (Charlson Score > 1), incontinence frequency is not significantly associated with a decline in general quality of life scores (p =.06 for PCS, p = .13 for MCS). The downward linear trend is highly significant for women without comorbidity (p<.0001 for both PCS and MCS) and remains significant for those with a Charlson score of 1 (p< .001 PCS and .02 MCS). However, for the women with Charlson scores over 1, indicating sicker women, the trend was not significant for either domain of quality of life (p= .36 PCS, p= .64 MCS). Figure 2 shows PCS results for incontinence frequency stratified by Charlson score, Figure 3 shows MCS results for incontinence frequency stratified by Charlson score.
Figure 2. Adjusted* mean physical component summary scores for incontinence frequency by Charlson level.
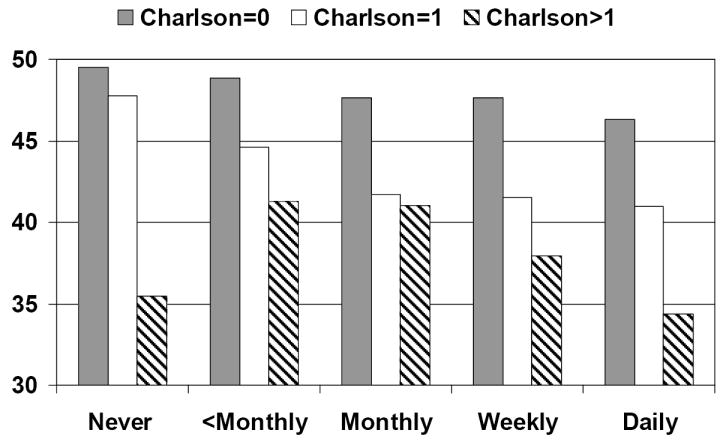
*Adjusted for age, body mass index, income, and race. Higher SF-36 scores indicate higher quality of life.
Figure 3. Adjusted* mean mental component summary scores for incontinence frequency by Charlson level.
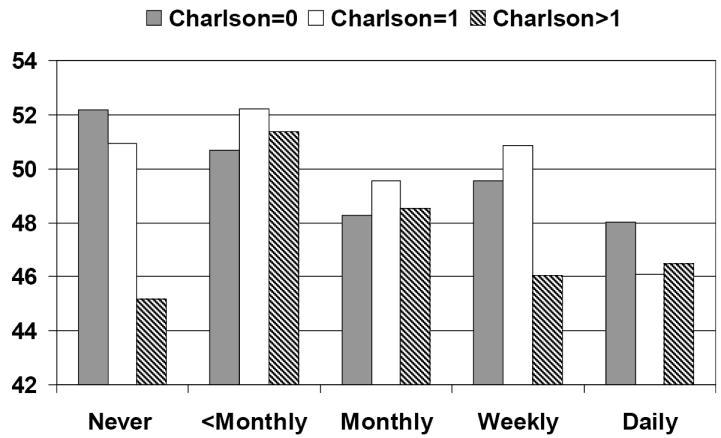
*Adjusted for age, body mass index, income, and race. Higher SF-36 scores indicate higher quality of life.
Race
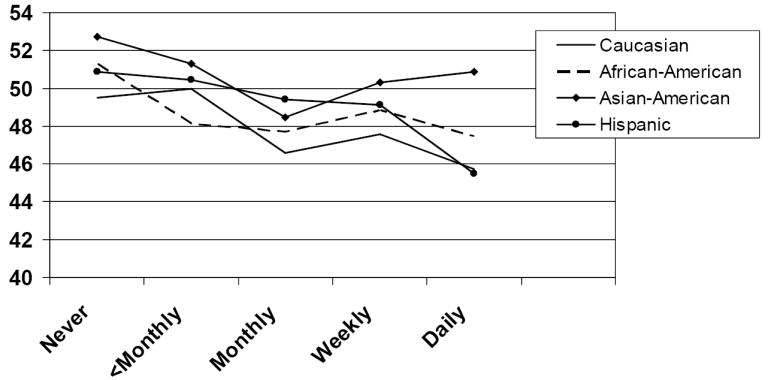
Race is not significantly associated with any of the three quality of life outcome scores in the general model (p = .48 for the PCS, p = .09 for the MCS, p = .11 for the IIQ). We analyzed the association between incontinence frequency and quality of life separately for each race. For Caucasians, quality of life scores are significantly associated with incontinence frequency on all three outcome measures (p = .02 for PCS, p <.0001 for MCS, p <.0001 for the IIQ). In African Americans, incontinence frequency is significantly associated with both physical component summary scores (p <.001) and the IIQ (p = .01), and borderline significantly associated with the mental SF score (p = .06). For Asian Americans and Hispanics there are no significant associations between incontinence frequency and quality of life outcomes. Results of the stratified analysis by race appear in Figures 4 and 5. In Figure 4, which graphs results for the PCS, tests for linear trend are significant for Caucasians (p <.01) and African-Americans (p <.0001). In Figure 5, which graphs results for the MCS, tests for linear trend are significant for Caucasians (p <.0001), African Americans (p = .03), and Hispanics (p = .01).
Figure 4. Adjusted* mean physical component summary scores for incontinence frequency by race.
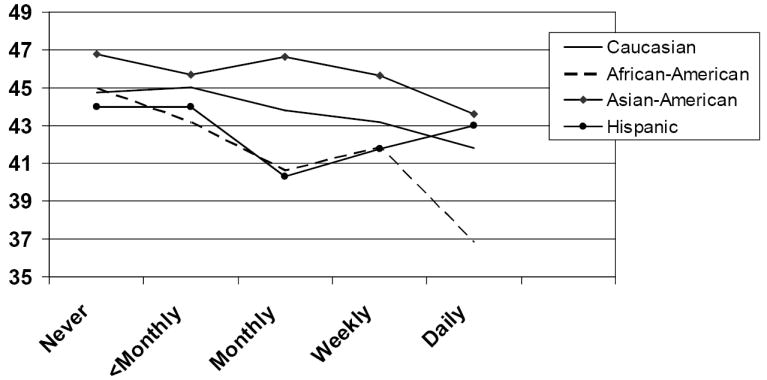
*Adjusted for age, body mass index, income and Charlson comorbidity score. Higher SF-36 scores indicate higher quality of life.
Figure 5. Adjusted* mean mental component summary scores for incontinence frequency by race.
*Adjusted for age, body mass index, income and Charlson comorbidity score. Higher SF-36 scores indicate higher quality of life.
Comparing pairwise adjusted mean scores by race we found no significant differences on PCS outcomes. The estimated mean MCS score for Asian Americans was significantly higher than for Hispanics (p = .01). The estimated mean IIQ score for Caucasians was significantly lower than for Hispanics (p = .02).
Discussion
We found that urinary incontinence is associated with lower quality of life even when comorbid conditions are controlled for in the analysis. Although some researchers have found that the effects of incontinence on quality of life are mild or confined to a relatively small portion of the population,(3;17;18) our findings are consistent with several other studies that found urinary incontinence has more widespread negative effects on quality of life.(1;7;19;20) We also found that the negative association with quality of life spans the range of urinary incontinence frequency. Incontinence is associated with significant decreases in quality of life scores even among women with monthly incontinence. Furthermore the association between increasing incontinence and decreasing quality of life is linear. There are significant quality of life losses even with differences in relatively mild incontinence such as the difference in frequency between less than monthly and monthly incontinence.
Our findings suggest that the degree of comorbidity modifies the relationship between quality of life and incontinence. When the analysis is stratified by Charlson score, incontinence frequency continues to have a significant negative association with quality of life for those who are healthy or have milder comorbidity. Among the sickest women, however, quality of life is not associated with incontinence. This finding is consistent with Heit’s study(10) of kidney transplant survivors in which he found that kidney transplant recipients were significantly less likely than non-transplant subjects to report that incontinence had negative effects on quality of life. The impact of urinary incontinence on quality of life is not directly proportional to its objective severity. Instead, there seem to be mediating factors in the relationship between degree of urinary incontinence and its subjective impact on quality of life. It may be that for the women who are sickest, incontinence is considered relatively insignificant in comparison to more severe health problems.
We did not find a clear pattern of association between urinary incontinence and quality of life by race/ethnicity. Adjusted mean quality of life scores decreased with increasing incontinence for women in all 4 race/ethnicity groups (for all groups never incontinent women always had higher quality of life than those with daily incontinence) but this association was only consistently significant for Caucasians and in some cases significant for African-Americans. The finding that this association was significant for Caucasian women but not for Asian or Hispanic women may reflect the large number of Caucasian women in the study. Our findings regarding race/ethnic disparities in the impact of incontinence did not generally confirm previous studies that reported non-whites experiencing greater impact from incontinence than do whites.(11;12) While there was the suggestion that African-American women reported poorer physical component scores than did other women, the differences were not significant and our mental component quality of life analysis did not reveal such differences. Our lack of findings may be due to the absence of true differences or due to the relatively small samples in each of our minority group categories.
The study has several strengths that should be noted. First, this is a community derived sample that included a broad spectrum of women from varied race/ethnic backgrounds. Second, we were able to link these women to clinical databases to obtain an objective assessment of comorbidity. Our assessments of urinary incontinence are easy to administer and compare across studies and the study included the simultaneous administration of both generic and disease-specific quality of life instruments. However, we obtained the more sensitive IIQ only on those reporting weekly or more frequent incontinence. While we had a relatively large sample, some subgroups were small and the power of the study was limited when testing for differences in the association between incontinence frequency and quality of life by Charlson score or by race/ethnic group.
Conclusion
Urinary incontinence and comorbidity each play an independent and significant role in reducing quality of life outcomes for women. This association extends to mild urinary incontinence and is linear. Having incontinence significantly reduces quality of life among all but the sickest women.
Acknowledgments
RRISK supported by National Institute of Diabetes and Digestive and Kidney Diseases Grant RO1-DK53335
Abbreviations and Acronyms
- MOS SF-36
Medical Outcomes Study Short Form 36
- PCS
Physical Component Summary subset of the MOS SF-36
- MCS
Mental Component Summary subset of the MOS SF-36
- IIQ
Incontinence Impact Questionnaire
Footnotes
Publisher's Disclaimer: This is a PDF file of an unedited manuscript that has been accepted for publication. As a service to our customers we are providing this early version of the manuscript. The manuscript will undergo copyediting, typesetting, and review of the resulting proof before it is published in its final citable form. Please note that during the production process errors may be discovered which could affect the content, and all legal disclaimers that apply to the journal pertain.
Reference List
- 1.Van Oyen H, Van Oyen P. Urinary incontinence in Belgium; prevalence, correlates and psychosocial consequences. Acta Clin Belg. 2002 Jul;57(4):207–18. doi: 10.1179/acb.2002.043. [DOI] [PubMed] [Google Scholar]
- 2.Ware JE, Snow K, Kosinski M, Gandek B. SF-36 Health Survey Manual and Interpretation Guide. Boston, Massachusetts: The Health Institute; 1993. [Google Scholar]
- 3.Fultz NH, Herzog AR. Self-reported social and emotional impact of urinary incontinence. J Am Geriatr Soc. 2001 Jul;49(7):892–9. doi: 10.1046/j.1532-5415.2001.49179.x. [DOI] [PubMed] [Google Scholar]
- 4.Lagro-Janssen T, Smits A, Van Weel C. Urinary incontinence in women and the effects on their lives. Scand J Prim Health Care. 1992 Sep;10(3):211–6. doi: 10.3109/02813439209014063. [DOI] [PubMed] [Google Scholar]
- 5.Fultz NH, Fisher GG, Jenkins KR. Does urinary incontinence affect middle-aged and older women’s time use and activity patterns? Obstet Gynecol. 2004 Dec;104(6):1327–34. doi: 10.1097/01.AOG.0000143829.21758.3c. [DOI] [PubMed] [Google Scholar]
- 6.Johnson TM, Kincade JE, Bernard SL, Busby-Whitehead J, Hertz-Picciotto I, DeFriese GH. The association of urinary incontinence with poor self-rated health. J Am Geriatr Soc. 1998 Jun;46(6):693–9. doi: 10.1111/j.1532-5415.1998.tb03802.x. [DOI] [PubMed] [Google Scholar]
- 7.Hunskaar S, Vinsnes A. The quality of life in women with urinary incontinence as measured by the sickness impact profile. J Am Geriatr Soc. 1991 Apr;39(4):378–82. doi: 10.1111/j.1532-5415.1991.tb02903.x. [DOI] [PubMed] [Google Scholar]
- 8.Stach-Lempinen B, Hakala AL, Laippala P, Lehtinen K, Metsanoja R, Kujansuu E. Severe depression determines quality of life in urinary incontinent women. Neurourol Urodyn. 2003;22(6):563–8. doi: 10.1002/nau.10137. [DOI] [PubMed] [Google Scholar]
- 9.Melville JL, Walker E, Katon W, Lentz G, Miller J, Fenner D. Prevalence of comorbid psychiatric illness and its impact on symptom perception, quality of life, and functional status in women with urinary incontinence. Am J Obstet Gynecol. 2002 Jul;187(1):80–7. doi: 10.1067/mob.2002.124839. [DOI] [PubMed] [Google Scholar]
- 10.Heit M, Blackwell L, Ouseph R. Comorbidities affect the impact of urinary incontinence as measured by disease-specific quality of life instruments. Int Urogynecol J Pelvic Floor Dysfunct. 2005 Jan;16(1):6–11. doi: 10.1007/s00192-004-1207-z. [DOI] [PubMed] [Google Scholar]
- 11.Sampselle CM, Harlow SD, Skurnick J, Brubaker L, Bondarenko I. Urinary incontinence predictors and life impact in ethnically diverse perimenopausal women. Obstet Gynecol. 2002 Dec;100(6):1230–8. doi: 10.1016/s0029-7844(02)02241-x. [DOI] [PubMed] [Google Scholar]
- 12.Bogner HR. Urinary incontinence and psychological distress in community-dwelling older African Americans and whites. J Am Geriatr Soc. 2004 Nov;52(11):1870–4. doi: 10.1111/j.1532-5415.2004.52509.x. [DOI] [PMC free article] [PubMed] [Google Scholar]
- 13.Thom DH, van den Eeden SK, Ragins AI, Wassel-Fyr C, Vittinghof E, Subak LL, et al. Differences in prevalence of urinary incontinence by race/ethnicity. J Urol. 2006 Jan;175(1):259–64. doi: 10.1016/S0022-5347(05)00039-X. [DOI] [PMC free article] [PubMed] [Google Scholar]
- 14.Shumaker SA, Wyman JF, Uebersax JS, McClish D, Fantl JA. Health-related quality of life measures for women with urinary incontinence: the Incontinence Impact Questionnaire and the Urogenital Distress Inventory. Continence Program in Women (CPW) Research Group. Qual Life Res. 1994 Oct;3(5):291–306. doi: 10.1007/BF00451721. [DOI] [PubMed] [Google Scholar]
- 15.Wyman JF, Harkins SW, Choi SC, Taylor JR, Fantl JA. Psychosocial impact of urinary incontinence in women. Obstet Gynecol. 1987 Sep;70(3 Pt 1):378–81. [PubMed] [Google Scholar]
- 16.Charlson ME, Pompei P, Ales KL, MacKenzie CR. A new method of classifying prognostic comorbidity in longitudinal studies: development and validation. J Chronic Dis. 1987;40(5):373–83. doi: 10.1016/0021-9681(87)90171-8. [DOI] [PubMed] [Google Scholar]
- 17.Andersson G, Johansson JE, Garpenholt O, Nilsson K. Urinary incontinence--prevalence, impact on daily living and desire for treatment: a population-based study. Scand J Urol Nephrol. 2004;38(2):125–30. doi: 10.1080/00365590310022608. [DOI] [PubMed] [Google Scholar]
- 18.Hannestad YS, Rortveit G, Hunskaar S. Help-seeking and associated factors in female urinary incontinence. The Norwegian EPINCONT Study. Epidemiology of Incontinence in the County of Nord-Trondelag. Scand J Prim Health Care. 2002 Jun;20(2):102–7. [PubMed] [Google Scholar]
- 19.Coyne KS, Payne C, Bhattacharyya SK, Revicki DA, Thompson C, Corey R, et al. The impact of urinary urgency and frequency on health-related quality of life in overactive bladder: results from a national community survey. Value Health. 2004 Jul;7(4):455–63. doi: 10.1111/j.1524-4733.2004.74008.x. [DOI] [PubMed] [Google Scholar]
- 20.Fultz NH, Burgio K, Diokno AC, Kinchen KS, Obenchain R, Bump RC. Burden of stress urinary incontinence for community-dwelling women. Am J Obstet Gynecol. 2003 Nov;189(5):1275–82. doi: 10.1067/s0002-9378(03)00598-2. [DOI] [PubMed] [Google Scholar]