Abstract
Nucleotide insertions and deletions (indels) are responsible for gaps in the sequence alignments. Indel is one of the major sources of evolutionary change at the molecular level. We have examined the patterns of insertions and deletions in the 19 mammalian genomes, and found that deletion events are more common than insertions in the mammalian genomes. Both the number of insertions and deletions decrease rapidly when the gap length increases and single nucleotide indel is the most frequent in all indel events. The frequencies of both insertions and deletions can be described well by power law.
Key Words: Insertion, deletion, gap, indel, mammalian genome.
INTRODUCTION
With the successful completion of the genome sequencing projects, the challenge is now to understand the instructions encoded in the genomes. The comparative genomic analysis by cross-species alignment of mammalian genomes is one of the most powerful ways to decipher the evolutionary process of mammalian genomes. One major aim of genomics research is to identify differences between genomes of species or individuals. The differences of genomes require genetic variation. One mechanism that increases genetic variation is mutation. There are many kinds of mutations. A mutation in which one “letter” of the genetic code is changed to another is a point mutation. Lengths of DNA be deleted or inserted in a gene means a deletion or insertion, respectively. Finally, genes or parts of genes can become inverted or duplicated. Previous researches unveiled that insertions and deletions, instead of substitutions, comprise the majority of the genomic divergence [1-4]. Therefore, the study of the patterns of insertion and deletion is necessary to understand the mammalian evolution.
By examining the homologous protein sequences, de Jong and Rydén (1981) observed that deletions of amino acids occurred about four times more frequently than insertions [5]. Deletion events also outnumbered insertions for processed pseudogenes [6-9]. Deletions are about twice as frequent as insertions for nuclear DNA, and in mitochondrial DNA, deletions occur at a slightly higher frequency than insertions [10]. Deletion events are also found more common than insertions in both mouse and rat [11-13].
There were several studies that focused on the size distribution of insertions and deletions. The exhaustive matching of the protein sequence database found that a power law with an exponent of 1.7 approximates quite closely the observed gap (insertion and deletion) length distribution [14]. The studies of pseudogenes suggested that the size distribution of insertions and deletions can be empirically described by power law [7, 9]. Qian and Goldstein (2001) examined gaps occured in FSSP database [15], using alignments based on their common structures, and they fitted the probability distribution of gap length to a quadruple exponential function [16]. Goonesekere and Lee (2004) examined the pattern of gaps of 3992 structurally aligned protein domain pairs in SCOP database [17], they found that the distributions of the logarithm of the probability of gaps varies linearly with the length of gap with a break at the gap of length 3 [18].
In this research, the multiple alignments of 19 mammalian genomes were used to analyze the patterns of insertions and deletions. We tested whether deletions always occur more frequently than insertions. Then we studied the length distributions of insertions and deletions.
MATERIALS AND METHODS
The multiple alignments of 28 vertebrate species were downloaded from UCSC Genome Bioinformatics website [19]. Table 1 shows the genome assemblies that were included in the 28-way multiple alignments. Table 2 shows the data used in this research.
Table 1.
Genome Assemblies Included in the 28-way Multiple Alignments
| Organism | Species | Release Date | UCSC Version |
|---|---|---|---|
| human | Homo sapiens | Mar 2006 | hg18 |
| chimpanzee | Pan troglodytes | Mar 2006 | panTro2 |
| rhesus | Macaca mulatta | Jan 2006 | rheMac2 |
| bushbaby | Otolemur garnetti | Dec 2006 | otoGar1 |
| tree shrew | Tupaia belangeri | Dec 2006 | tupBel1 |
| mouse | Mus musculus | Feb 2006 | mm8 |
| rat | Rattus norvegicus | Nov 2004 | rn4 |
| guinea pig | Cavia porcellus | Oct 2005 | cavPor2 |
| rabbit | Oryctolagus cuniculus | May 2005 | oryCun1 |
| shrew | Sorex araneus | June 2006 | sorAra1 |
| hedgehog | Erinaceus europaeus | June 2006 | eriEur1 |
| dog | Canis familiaris | May 2005 | canFam2 |
| cat | Felis catus | Mar 2006 | felCat3 |
| horse | Equus caballus | Feb 2007 | equCab1 |
| cow | Bos taurus | Aug 2006 | bosTau3 |
| armadillo | Dasypus novemcinctus | May 2005 | dasNov1 |
| elephant | Loxodonta africana | May 2005 | loxAfr1 |
| tenrec | Echinops telfairi | July 2005 | echTel1 |
| opossum | Monodelphis domestica | Jan 2006 | monDom4 |
| platypus | Ornithorhychus anatinus | Mar 2007 | ornAna1 |
| lizard | Anolis carolinensis | Feb 2007 | anoCar1 |
| chicken | Gallus gallus | May 2006 | galGal3 |
| frog | Xenopus tropicalis | Aug 2005 | xenTro2 |
| fugu | Takifugu rubripes | Oct 2004 | fr2 |
| tetraodon | Tetraodon nigroviridis | Feb 2004 | tetNig1 |
| stickleback | Gasterosteus aculeatus | Feb 2006 | gasAcu1 |
| medaka | Oryzias latipes | Apr 2006 | oryLat1 |
| zebrafish | Danio rerio | Mar 2006 | danRer4 |
Table 2.
The Details about the Data
| Name | Last Modified | Size | Name | Last Modified | Size |
|---|---|---|---|---|---|
| chr1.maf.gz | 2007-5-30 17:09 | 822M | chr13.maf.gz | 2007-5-30 17:27 | 338M |
| chr2.maf.gz | 2007-5-30 17:52 | 878M | chr14.maf.gz | 2007-5-30 17:31 | 321M |
| chr3.maf.gz | 2007-5-30 18:04 | 735M | chr15.maf.gz | 2007-5-30 17:34 | 289M |
| chr4.maf.gz | 2007-5-30 18:10 | 636M | chr16.maf.gz | 2007-5-30 17:37 | 278M |
| chr5.maf.gz | 2007-5-30 18:16 | 641M | chr17.maf.gz | 2007-5-30 17:40 | 284M |
| chr6.maf.gz | 2007-5-30 18:22 | 609M | chr18.maf.gz | 2007-5-30 17:42 | 271M |
| chr7.maf.gz | 2007-5-30 18:28 | 528M | chr19.maf.gz | 2007-5-30 17:44 | 140M |
| chr8.maf.gz | 2007-5-30 18:33 | 499M | chr20.maf.gz | 2007-5-30 17:54 | 219M |
| chr9.maf.gz | 2007-5-30 18:37 | 418M | chr21.maf.gz | 2007-5-30 17:56 | 110M |
| chr10.maf.gz | 2007-5-30 17:14 | 475M | chr22.maf.gz | 2007-5-30 17:57 | 107M |
| chr11.maf.gz | 2007-5-30 17:19 | 474M | chrX.maf.gz | 2007-5-30 18:41 | 405M |
| chr12.maf.gz | 2007-5-30 17:24 | 460M | chrY.maf.gz | 2007-5-30 18:41 | 23M |
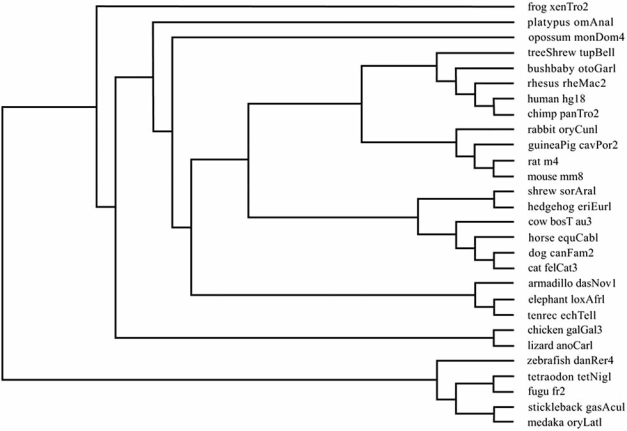
The 28-way multiple alignments were built as follows. Firstly, lineage-specific repeats were removed prior to alignment, then pairwise alignments with the human genome were generated for each species using BLASTZ [20] from repeat-masked genomic sequence. Pairwise alignments were then linked into chains using AXTCHAIN [21] that finds maximally scoring chains of gapless subsections of the alignments organized in a k-dimensional tree. Then CHAINNET [21] was used to produce an alignment net. The resulting best-in-genome pairwise alignments were progressively aligned using MULTIZ [22], based on the phylogenetic tree [23], as Fig. (1) shows, to produce multiple alignments.
Fig. (1).
Phylogenetic tree of 28 vertebrate species.
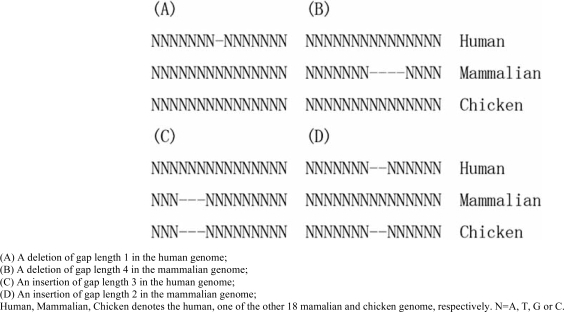
Only the multiple alignments of 19 mammalian species were studied. The triple alignments of human, chicken and one of the other 18 mammalian species were used to assign the insertions and deletions to human or the other mammalian species by the parsimony principle, using chicken as outgroup. In this study, there were four events inferred as insertions or deletions (Fig. 2).
Fig. (2).
Definition of insertions and deletions.
The probability of an insertion or deletion of length k was calculated by equation 1 where fk is the probability of the insertion or deletion with the gap length k, Nk is the number of the insertion or deletion that has the gap length k. Then the power law can be defined as equation 2 [9].
| (1) |
| (2) |
RESULTS
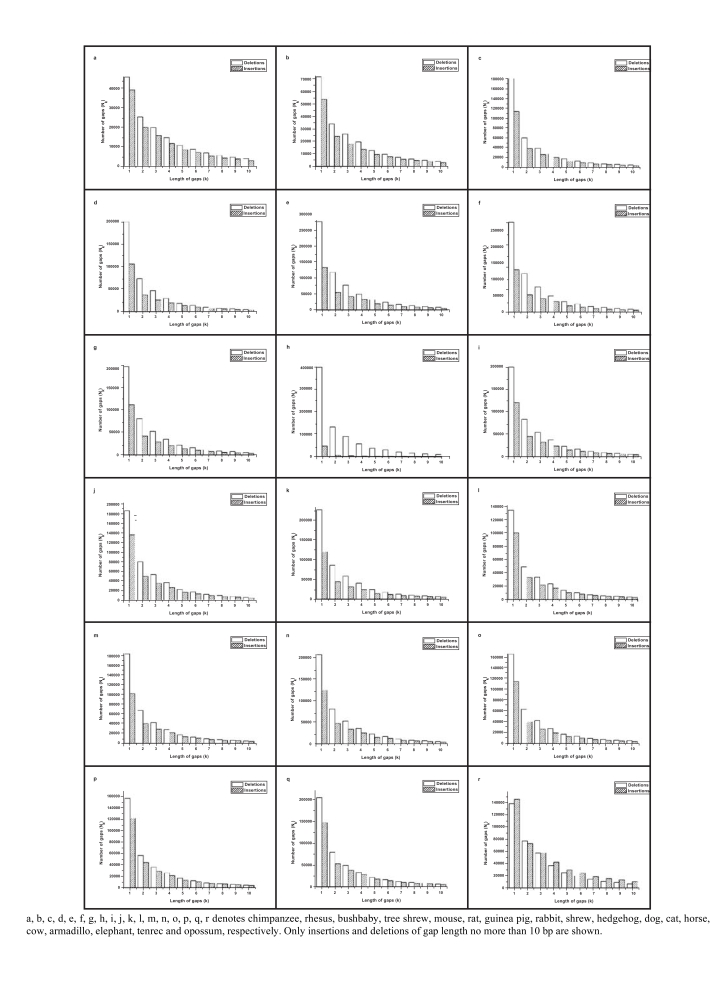
Fig. (3) shows the length distributions of the insertions and deletions of the 18 mammalian genomes. Deletions occur more frequently than insertions over all gap lengths. However, in opossum, insertions occur more frequently than deletions except the gap of length 2. The ratio of deletions to insertions varies from 0.85 to 12.82 (Table 3). Only in the opossum the ratio is less than 1. In rabbit, the deletions are extremely more than insertions. The total lengths of deletions are larger than insertions, except for hedgehog, elephant, tenrec and opossum.
Fig. (3).
Length distributions of insertions and deletions.
Table 3.
Ratios of Deletions to Insertions and the Percentage of the Single Nucleotide Gap
| Organism | RN | RL | P | |
|---|---|---|---|---|
| Insertion | Deletion | |||
| chimpanzee | 1.26 : 1 | 1.32 : 1 | 28.63% | 26.54% |
| Rhesus | 1.34 : 1 | 1.20 : 1 | 32.52% | 32.50% |
| Bushbaby | 1.48 : 1 | 1.10 : 1 | 42.44% | 46.13% |
| tree shrew | 1.66 : 1 | 1.03 : 1 | 40.53% | 45.93% |
| Mouse | 1.78 : 1 | 1.24 : 1 | 35.31% | 40.87% |
| Rat | 1.87 : 1 | 1.32 : 1 | 36.14% | 41.17% |
| guinea pig | 1.69 : 1 | 1.26 : 1 | 40.50% | 42.21% |
| Rabbit | 12.82 : 1 | 17.26 : 1 | 71.00% | 46.74% |
| Shrew | 1.54 : 1 | 1.04 : 1 | 38.82% | 41.77% |
| Hedgehog | 1.34 : 1 | 0.96 : 1 | 39.44% | 40.20% |
| Dog | 1.72 : 1 | 1.26 : 1 | 39.80% | 43.72% |
| Cat | 1.34 : 1 | 1.11 : 1 | 43.33% | 43.19% |
| Horse | 1.54 : 1 | 1.18 : 1 | 38.89% | 45.64% |
| Cow | 1.49 : 1 | 1.03 : 1 | 38.38% | 42.67% |
| Armadillo | 1.43 : 1 | 1.20 : 1 | 42.88% | 43.35% |
| Elephant | 1.21 : 1 | 0.93 : 1 | 41.78% | 44.28% |
| Tenrec | 1.29 : 1 | 0.92 : 1 | 39.88% | 43.03% |
| Opossum | 0.85 : 1 | 0.60 : 1 | 29.27% | 32.74% |
RN denotes the ratio between the total number of deletions and insertions.
RL denotes the ratio between the total length of deletions and insertions.
P denotes the percentage of the single nucleotide insertion or deletion.
Both the number of insertions and deletions decrease rapidly with the increases of gap length. The single nucleotide insertion and deletion are the most frequent in all events. The percentage of single nucleotide insertions varies from 28.63% to 71.00%, and the percentage of single nucleotide deletions varies from 26.54% to 46.74% (Table 3).
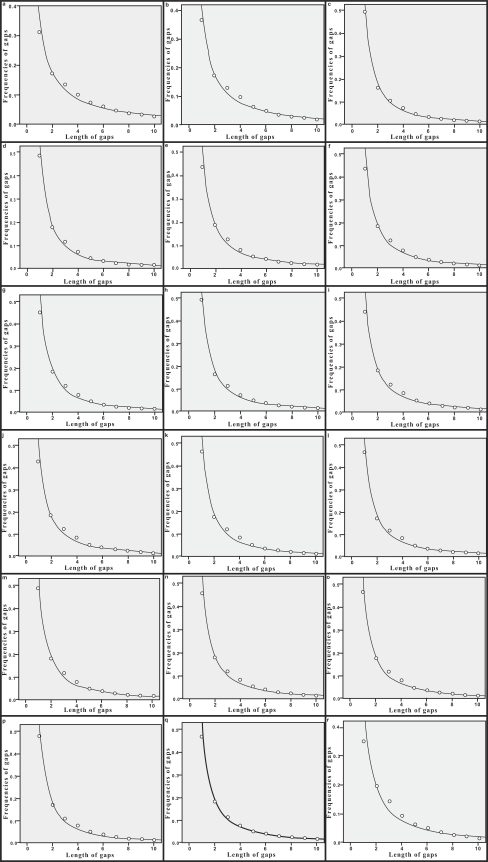
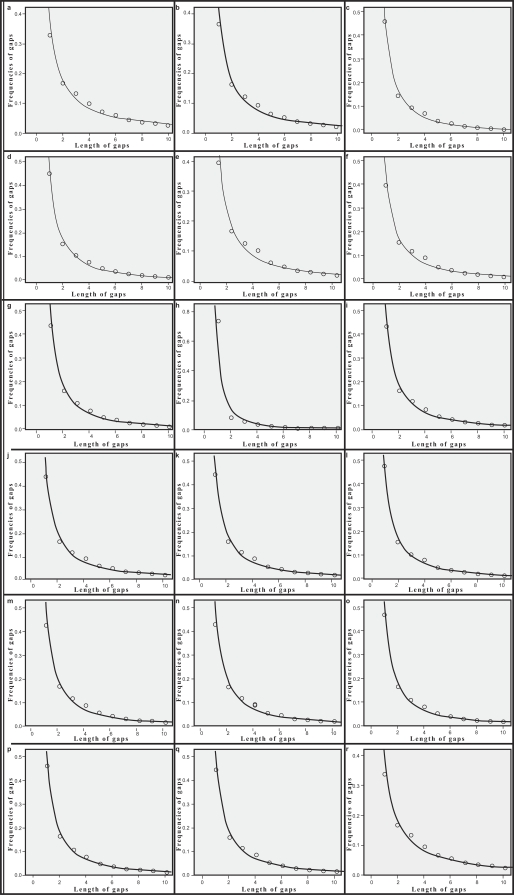
The probability of insertions and deletions, as a function of gap length, fits power law equation given above very well. Regression analysis of the data, using SPSS 15.0 [24], gave the values of a, b and R2 (Table 4). SPSS was also used to perform the Kolmogorov-Smirnov test for goodness-of-fit tailored to power law distributions. Table 4 shows the results of the test. Fig. (4) shows the plots of parameters k and fk for deletions. Fig. (5) shows the plots of k and fk for insertions.
Table 4.
Estimates of the Parameters
| Organism | a | b | R2 | D* | P-value** | |||||
|---|---|---|---|---|---|---|---|---|---|---|
| Del | Ins | Del | Ins | Del | Ins | Del | Ins | Del | Ins | |
| chimpanzee | 0.369 | 0.381 | 1.059 | 1.096 | 0.975 | 0.976 | 0.100 | 0.100 | 1.0 | 1.0 |
| Rhesus | 0.442 | 0.414 | 1.259 | 1.193 | 0.974 | 0.984 | 0.100 | 0.100 | 1.0 | 1.0 |
| Bushbaby | 0.528 | 0.492 | 1.537 | 1.434 | 0.993 | 0.989 | 0.100 | 0.100 | 1.0 | 1.0 |
| tree shrew | 0.572 | 0.481 | 1.624 | 1.400 | 0.990 | 0.989 | 0.100 | 0.100 | 1.0 | 1.0 |
| Mouse | 0.528 | 0.464 | 1.492 | 1.324 | 0.986 | 0.974 | 0.100 | 0.100 | 1.0 | 1.0 |
| Rat | 0.532 | 0.470 | 1.502 | 1.342 | 0.986 | 0.975 | 0.100 | 0.100 | 1.0 | 1.0 |
| guinea pig | 0.546 | 0.500 | 1.538 | 1.433 | 0.985 | 0.986 | 0.100 | 0.100 | 1.0 | 1.0 |
| Rabbit | 0.547 | 0.510 | 1.573 | 1.883 | 0.989 | 0.977 | 0.100 | 0.100 | 1.0 | 1.0 |
| Shrew | 0.550 | 0.474 | 1.539 | 1.372 | 0.981 | 0.989 | 0.100 | 0.100 | 1.0 | 1.0 |
| Hedgehog | 0.529 | 0.474 | 1.487 | 1.376 | 0.981 | 0.988 | 0.100 | 0.100 | 1.0 | 1.0 |
| Dog | 0.557 | 0.476 | 1.569 | 1.384 | 0.983 | 0.989 | 0.100 | 0.100 | 1.0 | 1.0 |
| Cat | 0.534 | 0.487 | 1.526 | 1.436 | 0.987 | 0.992 | 0.100 | 0.100 | 1.0 | 1.0 |
| Horse | 0.557 | 0.486 | 1.591 | 1.393 | 0.992 | 0.984 | 0.100 | 0.100 | 1.0 | 1.0 |
| Cow | 0.542 | 0.475 | 1.530 | 1.369 | 0.985 | 0.986 | 0.100 | 0.100 | 1.0 | 1.0 |
| Armadillo | 0.539 | 0.502 | 1.536 | 1.457 | 0.989 | 0.990 | 0.100 | 0.100 | 1.0 | 1.0 |
| Elephant | 0.532 | 0.491 | 1.527 | 1.433 | 0.990 | 0.994 | 0.100 | 0.100 | 1.0 | 1.0 |
| Tenrec | 0.515 | 0.482 | 1.487 | 1.398 | 0.994 | 0.988 | 0.100 | 0.100 | 1.0 | 1.0 |
| Opossum | 0.473 | 0.391 | 1.325 | 1.123 | 0.962 | 0.979 | 0.100 | 0.100 | 1.0 | 1.0 |
The maximum difference between the cumulative distributions in the KS-test.
The P-value of the KS-test.
All data analyses were performed using SPSS version 15.0 (SPSS 2006).
Fig. (4).
fk vs k plotting for deletions.
Fig. (5).
fk vs k plotting for insertions.
DISCUSSION
Nucleotide substitution, insertion and deletion (indel) events are the major driving forces that have shaped genomes [9]. Furthermore, recent researches found that insertions and deletions, instead of substitutions, are the major path to the genomic divergence [1-4]. Therefore, the study of the patterns of insertion and deletion in the genomes is essentially important.
Previous studies found that there was preponderance of deletions over insertions [5-13]. From the extensive genome data used in this study, we have shown that deletions occur more frequently than insertions in genomes. Although insertions are more frequent than deletions in opossum, it is not significant. Therefore, deletions occur more frequently than insertions can be regarded as a general genomic feature.
Single nucleotide insertion and deletion are the most frequent in all events, and the frequency of insertions and deletions decrease quickly as the gap length increases. The high occurrence of single nucleotide gaps was also observed in the study of 22 human and 30 rodents processed pseudogenes [6], 78 human processed pseudogenes [7], 1726 human ribosomal protein pseudogene sequences [9], noncoding nucleotide sequences of primates [10], Escherichia coli [25], chloroplast noncoding nucleotide sequence of nine monocot plants [26]. Therefore, the high percent of single nucleotide insertion and deletion seems to be a common phenomenon in the genomic evolution.
Benner et al. (1993) studied the alignments of homologous protein sequence pairs and concluded that the distribution of the gap length follows power law distribution [14]. Gu and Li (1995) aligned 78 human processed pseudogenes, the human functional genes and the reference, they found the size distributions of insertions and deletions fitted to power law very well [7]. Recently, Zhang and Gerstein (2003) examined the patterns of insertions and deletions in 1726 processed ribosomal protein pseudogenes and found that the frequencies of both insertions and deletions followed characteristic power law behavior associated with the length of the gaps [9]. In this study, the probability distributions of insertions and deletions in the 18 mammalian genomes can both be described by power law distribution. The results suggest that the gap penalty should be log-affine [27], i.e., g(k)=a+bk+clnk, where g(k) is the gap penalty for insertion or deletion, k is the length of the insertion or deletion.
REFERENCES
- 1.Anzai T, Shiina T, Kimura N, Yanagiya K, Kohara S, Shigenari A, Yamagata T, Kulski JK, Naruse TK, Fujimori Y, Fukuzumi Y, Yamazaki M, Tashiro H, Iwamoto C, Umehara Y, Imanishi T, Meyer A, Ikeo K, Gojobori T, Bahram S, Inoko H. Comparative sequencing of human and chimpanzee MHC class I regions unveils insertions/deletions as the major path to genomic divergence. Proc. Natl. Acad. Sci. USA. 2003;100:7708–7713. doi: 10.1073/pnas.1230533100. [DOI] [PMC free article] [PubMed] [Google Scholar]
- 2.Britten RJ. Divergence between samples of chimpanzee and human DNA sequence is 5%, counting indels. Proc. Natl. Acad. Sci. USA. 2002;99:13633–13635. doi: 10.1073/pnas.172510699. [DOI] [PMC free article] [PubMed] [Google Scholar]
- 3.Britten RJ, Rowen L, Williams J, Cameron RA. Majority of divergence between closely related DNA samples is due to indels. Proc. Natl. Acad. Sci. USA. 2003;100:4661–4665. doi: 10.1073/pnas.0330964100. [DOI] [PMC free article] [PubMed] [Google Scholar]
- 4.Wetterbom A, Sevov M, Cavelier L, Bergstrom TF. Comparative genomic analysis of human and chimpanzee indicates a key role for indels in primate evolution. J. Mol. Evol. 2006;63:682–690. doi: 10.1007/s00239-006-0045-7. [DOI] [PubMed] [Google Scholar]
- 5.de Jong WW, Rydén L. Cause of more frequent deletions than insertions in mutations and protein evolution. Nature. 1981;290:157–159. doi: 10.1038/290157a0. [DOI] [PubMed] [Google Scholar]
- 6.Graur D, Shuali Y, Li WH. Deletions in processed pseudogenes accumulate faster in rodents than in humans. J. Mol. Evol. 1989;28:279–285. doi: 10.1007/BF02103423. [DOI] [PubMed] [Google Scholar]
- 7*.Gu X, Li WH. The size distribution of insertions and deletions in human and rodent pseudogenes suggests the logarithmic gap penalty for sequence alignment. J. Mol. Evol. 1995;40:464–473. doi: 10.1007/BF00164032. [DOI] [PubMed] [Google Scholar]
- 8.Ophir R, Graur D. Patterns and rates of indel evolution in processed pseudogenes from humans and murids. Gene. 1997;205:191–202. doi: 10.1016/s0378-1119(97)00398-3. [DOI] [PubMed] [Google Scholar]
- 9**.Zhang Z, Gerstein M. Patterns of nucleotide substitution, insertion and deletion in the human genome inferred from pseudogenes. Nucleic Acids Res. 2003;31:5338–5348. doi: 10.1093/nar/gkg745. [DOI] [PMC free article] [PubMed] [Google Scholar]
- 10.Saitou N, Ueda S. Evolutionary rates of insertion and deletion in noncoding nucleotide sequences of primates. Mol. Biol. Evol. 1994;11:504–512. doi: 10.1093/oxfordjournals.molbev.a040130. [DOI] [PubMed] [Google Scholar]
- 11.Mouse Genome Sequencing Consortium. Initial sequencing and comparative analysis of the mouse genome. Nature. 2002;420:520–562. doi: 10.1038/nature01262. [DOI] [PubMed] [Google Scholar]
- 12.Rat Genome Sequencing Project Consortium. Genome sequence of the brown Norway rat yields insights into mammalian evolution. Nature. 2004;428:493–521. doi: 10.1038/nature02426. [DOI] [PubMed] [Google Scholar]
- 13.Taylor MS, Ponting CP, Copley RR. Occurrence and consequences of coding sequence insertions and deletions in mammalian genomes. Genome Res. 2004;14:555–566. doi: 10.1101/gr.1977804. [DOI] [PMC free article] [PubMed] [Google Scholar]
- 14.Benner SA, Cohen MA, Gonnet GH. Empirical and structural models for insertions and deletions in divergent evolution of proteins. J. Mol. Biol. 1993;229:1065–1082. doi: 10.1006/jmbi.1993.1105. [DOI] [PubMed] [Google Scholar]
- 15.Holm L, Sander C. Mapping the protein universe. Science. 1996;273:595–603. doi: 10.1126/science.273.5275.595. [DOI] [PubMed] [Google Scholar]
- 16.Qian B, Goldstein RA. Distribution of indel lengths. Proteins. 2001;45:102–104. doi: 10.1002/prot.1129. [DOI] [PubMed] [Google Scholar]
- 17.Conte LL, Ailey B, Hubbard T, Brenner SE, Murzin AG, Chothia C. SCOP: a structural classification of protein database. Nucleic Acids Res. 2000;28:257–259. doi: 10.1093/nar/28.1.257. [DOI] [PMC free article] [PubMed] [Google Scholar]
- 18.Goonesekere NCW, Lee B. Frequency of gaps observed in a structurally aligned protein pair database suggests a simple gap penalty function. Nucleic Acids Res. 2004;32:2838–2843. doi: 10.1093/nar/gkh610. [DOI] [PMC free article] [PubMed] [Google Scholar]
- 19.Karolchik D, Baertsch R, Diekhans M, Furey TS, Hinrichs A, Lu YT, Roskin KM, Schwartz M, Sugnet CW, Thomas DJ, Weber RJ, Haussler D, Kent WJ. The UCSC genome browser database. Nucleic Acids Res. 2003;31:51–54. doi: 10.1093/nar/gkg129. [DOI] [PMC free article] [PubMed] [Google Scholar]
- 20.Schwartz S, Kent WJ, Smit A, Zhang Z, Baertsch R, Hardison RC, Haussler D, Miller W. Human-mouse alignments with BLASTZ. Genome Res. 2003;13:103–107. doi: 10.1101/gr.809403. [DOI] [PMC free article] [PubMed] [Google Scholar]
- 21.Kent WJ, Baertsch R, Hinrichs A, Miller W, Haussler D. Evolution's cauldron: duplication, deletion, and rearrangement in the mouse and human genomes. Proc. Natl. Acad. Sci. USA. 2003;100:11484–11489. doi: 10.1073/pnas.1932072100. [DOI] [PMC free article] [PubMed] [Google Scholar]
- 22.Blanchette M, Kent WJ, Riemer C, Elnitski L, Smit AF, Roskin KM, Baertsch R, Rosenbloom K, Clawson H, Green ED, Haussler D, Miller W. Aligning multiple genomic sequences with the threaded blockset aligner. Genome Res. 2004;14:708–715. doi: 10.1101/gr.1933104. [DOI] [PMC free article] [PubMed] [Google Scholar]
- 23.Murphy WJ, Eizirik E, O'Brien SJ, Madsen O, Scally M, Douady CJ, Teeling E, Ryder OA, Stanhope MJ, de Jong WW, Springer MS. Resolution of the early placental mammal radiation using Bayesian phylogenetics. Science. 2001;294:2348–2351. doi: 10.1126/science.1067179. [DOI] [PubMed] [Google Scholar]
- 24.SPSS Inc. SPSS Base 15.0 User’s Guide. SPSS Inc. Chicago IL. 2006.
- 25.Mo JY, Maki H, Sekiguchi M. Mutational specificity of the dnaE173 mutator associated with a defect in the catalytic subunit of DNA polymerase III of Escherichia coli. J. Mol. Biol. 1991;222:925–936. doi: 10.1016/0022-2836(91)90586-u. [DOI] [PubMed] [Google Scholar]
- 26.Golenberg EM, Clegg MT, Durbin ML, Doebley J, Ma DP. Evolution of a noncoding region of the chloroplast genome. Mol. Phylogenet. Evol. 1993;2:52–64. doi: 10.1006/mpev.1993.1006. [DOI] [PubMed] [Google Scholar]
- 27.Cartwright RA. Logarithmic gap costs decrease alignment accuracy. BMC Bioinformatics. 2006;7:527. doi: 10.1186/1471-2105-7-527. [DOI] [PMC free article] [PubMed] [Google Scholar]


