

Abstract
It is widely believed that CD4+CD25+ regulatory T cells (Treg) are defective in type 1 diabetes (T1D) and other autoimmune diseases. However, this conclusion is based on the suboptimal in vitro suppression results from very small numbers of subjects. Furthermore, the cells responsible for the suboptimal suppression have not been defined. Therefore, we carried out extensive in vitro suppression assays using both autologous and heterologous donors of Tregs, effector T cells and antigen-presenting cells (APC) from both T1D patients and normal controls. Our in vitro suppression data indicated that a significantly higher proportion (40.0%) of T1D patients have “very low suppression” activity (defined as < 25%) by autologous Treg compared to controls (6.3%) (p=0.002). Meta-analysis of the published results confirmed this observation with 45.7% low suppressors in T1D and 7.8% in controls (p = 0.00002). Interestingly, suppression assays using heterologous Tregs, effector T cells and APC suggest that the source of APC is correlated with the suppression activity. The frequencies of CD4+CD25+ and CD4+CD25hi T cells were found to increase with age in normal controls but not in T1D patients, resulting in significantly higher frequencies of CD4+CD25+ (p = 0.001) and CD4+CD25hi (p = 0.009) T cells in young T1D subjects than age-matched controls but slightly lower CD4+CD25+ (p = 0.003) and CD4+CD25hi (p = 0.08) T cells in old T1D subjects than age-matched controls.
The immune system has evolved a number of mechanisms to control the balance between immune self tolerance and immune responses against infectious agents. The central mechanism of self tolerance, clonal deletion of auto-reactive T-cells in the thymus, is effective but incomplete since a number of auto-reactive T cells can be found in the peripheral circulation in healthy individuals [1] as well as in patients with autoimmune diseases [2–4]. It is believed that multiple immune regulatory mechanisms, which keep self-reactive cells in check in healthy individuals, may be defective in autoimmune patients. The CD4+CD25+ regulatory T cells (Treg) play an important role in the regulation of peripheral self-reactive T cells. This regulatory T-cell population was first identified in normal mice [5,6]. These cells are anergic to antigen stimulation in vitro, and can suppress the response of co-cultured CD4+CD25− cells in a cell contact-dependent manner [7]. Mice deficient in CD4+CD25+ Treg cells develop multi-organ autoimmune diseases, and adoptive transfer of CD4+CD25+ T-cells from normal mice protect them against autoimmune diseases[8–10]. Human CD4+CD25+ Treg have in vitro features similar to their murine counterparts, except that the CD4+CD25hi population assembles the majority of suppressive cells [11–14].
Three recent studies examined the frequencies of CD4+CD25+ and CD4+CD25hi T cells in T1D patients and controls [15–17] and none of these studies found a significant difference between T1D and controls, although one study found an increasing trend with age in both normal controls and T1D subjects [15]. These results suggest that there is no evidence for a deficiency in the number of CD4+ Treg as defined by CD25. It is well established that CD25 is also expressed on activated T cells and it is not a perfect marker for Treg, especially in autoimmune patients. A recent study attempted to examine the Treg frequencies using intra-cellular staining of FOXP3 protein and found no difference between T1D and controls [18]. However, the anti-FOXP3 antibody used in this study was recently shown to stain non-specifically [19].
Two reports [15,16] have documented significantly reduced in vitro suppression of T cell proliferation by Treg from human T1D patients. However, the sample size for both studies is very small and the results are contradicted by a third report [17]. Therefore, additional studies are necessary to assess the suppression function of Treg in T1D patients. A second important issue that has not been addressed concerns the cell population(s) responsible for the suboptimal suppression observed in T1D and other autoimmune diseases. The in vitro suppression data have been interpreted as reflecting a functional defect of Treg. However, there is no direct evidence from human subjects for or against this interpretation. Recent studies in mouse models including the NOD mouse [20–22] suggested that the suboptimal suppression may be due to defects in APC or effector T cells. These data from animal models prompted us to examine the respective contribution of the three cell populations (Treg, effector T cells and APC) to the suppression activity in human subjects. Our results as well as a meta-analysis with published data provide strong evidence for a defective suppression of T cell proliferation in a large proportion of T1D patients. We also provide evidence that highlight an intrinsic defect in the APC compartment in the suppression function of Treg.
RESEARCH DRSIGN AND METHODS
Subjects
Three groups of Caucasian subjects were recruited from the Augusta, GA area: T1D patients, normal controls (NC) without family history of type 1 diabetes, and controls with a diabetic first degree relative (FDR). Diagnosis of T1D was made using the criteria of the National Diabetes Data Group. Healthy controls were subjects who had no autoimmune disorders and were negative for the presence of T1D-associated autoantibodies. Demographic information was presented in Table 1.
Table 1.
Demographic and clinical information of study subjects
| Subject categories | NC | FDR | T1D |
|---|---|---|---|
|
| |||
| Treg frequency analysis | |||
| Total number | 20 | 14 | 37 |
| Age range | 22.5 ± 17.5 (1–64) | 22.2 ± 18.6 (3–51) | 18.2 ± 12.8 (6–54) |
| Male/Female | 10/10 | 8/6 | 15/18 |
| Duration of TID(years) | 8.1 ± 8.0 (1–29.6) | ||
|
| |||
| Proliferation assay | |||
| Total number | 34 + 6* | 6 | 41 |
| Age range | 28.9 ± 15.0 (5–61) | 9 ± 1.9 (6–11) | 22.2 ± 16.0 (3–55) |
| Male/Female | 22/18 | 1/5 | 21/20 |
| Duration of T1D(years) | 10.9 ± 1.3 (3–37.4) | ||
|
| |||
| Suppression assay | |||
| Total number | 26 + 6* | 0 | 25 |
| Age range | 33 ± 13.4 (7–51) | 26.3 ± 17.3 (3–55) | |
| Male/Female | 17/15 | 15/10 | |
| Duration of T1D(years) | 13.4 ± 12.3 (1–37.4) | ||
All subjects are Caucasian except 5 Asian and 1 African subjects labeled with *, which were excluded from statistical analysis
FACS analysis
Peripheral blood mononuclear cells (PBMC) were isolated by Ficoll-Isopaque density gradient centrifugation according to the manufacturer’s protocol (StemCell Technologies). For each staining, 5×10⁵ PBMC were resuspended in 100ul PBS buffer, stained with antibodies, FITC anti-CD4 (clone RPA-T4, BD PharMingen), PE anti-CD25 (clone M-A251, BD PharMingen), and then incubated on ice in the dark for 30 min. Background fluorescence was assessed using appropriate isotype antibodies. Fluorescence was quantified using a FACS Calibur flow cytometer (BD Biosciences). Cells were electronically gated on forward angle light scatter to exclude contaminating erythrocytes and small debris and on 90° light scatter to exclude granulocytes. Data were analyzed using Cell Quest.
Cell Purification
Peripheral blood (~30ml) was collected in sodium-heparin vacutainer tubes (BD Biosciences). An accessory cell population (>90% T-cell depleted) was isolated from PBMC of ~10ml blood using a Pan T cell isolation kit (Miltenyi Biotech, Germany) with separation on the AutoMACS sorter (Miltenyi). The CD4+ T-cell population was purified by negative selection using a CD4+ T cells enrichment cocktail (StemCell, Canada) from ~20 ml blood. The CD4+ T cell population (>90% purity) (Fig. 1a) then underwent a positive selection for CD4+CD25+ T cells using CD25 microbeads (Miltenyi Biotech, Germany) with separation on AutoMACS. The volume of CD25 microbeads was reduced to half based on manufacturer instructions yielding CD4+CD25high T (Treg) cells (>90% pure) (Fig. 1b). The unlabeled CD4+CD25− population (>85% purity) (Fig. 1c) was used as effector T cells (Teff) in both proliferation and suppression assays.
Fig. 1.

Flow cytometry analyses of T cells. PBMCs were stained with PE-conjugated anti-CD25 and/or FITC-conjugated anti-CD4. Cells were gated for lymphocytes via forward and side scatter properties, and then examined for co-expression of CD25 and/or CD4. The CD4+CD25+ cells were identified based on the isotype control, and CD4+CD25hi T cells were defined as the population of CD4+ T cells whose CD25 expression exceed the level of CD25 positivity seen in the CD4− T cells. (A) Purity of CD4+ T cells after purification, (B) purity of CD4+CD25+ T cells, (C) purity of CD4+CD25− T cells and (D) gating of CD4+CD25+ and CD4+CD25hi T cells.
Cell culture
Cells were cultured in RPMI 1640 medium (Cellgro, VA) with 10% FBS (Sigma, MO), 5mM HEPES (Invitrogen, NY), penicillin (50ug/ml), streptomycin(50ug/ml), neomycin (100ug/ml) (Cellgro VA), and 50uM 2-mercaptoethanol (Sigma, MO) in round bottom 96-well plates (Costa, Cambridge, MA).
Proliferation and suppression assay
CD4+CD25− Teffs (5 × 10³ cells/well) were co-cultured with CD4+CD25+ Treg cells with different ratios (1:0, 1:1, 2:1 and 0:1) with a stimulus of 5 μg/ml soluble/plate-bound anti-CD3 (clone HIT3a) and 2.5 μg/ml soluble anti-CD28 (clone CD28.2; BD Pharmingen). Irradiated (3,300 rad) T-cell-depleted accessory cells (5 × 10⁴) were added to each well to a total volume of 200 μl. All assays were done in triplicate for each sample. On day 5, 0.5 μCi 3H-thymidine (Amersham Biosciences, Piscataway, NJ) was added for the final 16 h of culture to assess proliferation. Percentage of suppression was calculated as [1 −(mean cpm Treg + Teff)/(mean cpm Teff) × 100%].
Statistical analysis
The percentages of CD4+CD25+ and CD4+CD25hi T cells, proliferation and suppression data were used as dependent variables in all analyses, and all were transformed using the log transformation to stabilize the variances, and provide a better estimate of the relevant fold changes. We used analyses of variance to test for differences in means in the four dependent variables. First, we examined analyses of variance in which age was a continuous independent variable, phenotype group (T1D, NC, and FDR) was a factor, and the interaction between phenotype group and age was included. Since the interaction of phenotype group and age was significant for percent CD4+CD25+ cells and percent CD4+CD25hi T cells, we included phenotype group and age in the analysis. For proliferation and suppression, we only included age as a covariate. We also noted what appeared to be an association between proliferation and age in which the frequency of younger individuals with low proliferation was much higher than the frequency of older individuals with low proliferation. We therefore decided to use separate the subjects into two groups (age <14 and age ≥14), and used the Mann-Whitney U test to compare the medians of these two groups.
RESULTS
CD4+CD25+ and CD4+CD25hi T cell frequencies
PBMCs were stained with antibodies against CD4 and CD25 to identify CD4+CD25−, CD4+CD25+ and CD4+CD25hi T cells. CD4+CD25+ T cells were defined using isotype control and CD4+CD25hi T cells were defined as CD4+ cells that have CD25 expression exceeding all CD4− cells (Fig. 1d). The percentages of CD4+CD25+ and CD4+CD25hi T cells among CD4+ T cells were determined in 37 T1D patients, 20 normal controls and 14 FDR controls. When all subjects were analyzed, no significant difference was found between the three groups for the percentages of CD4+CD25+ or CD4+CD25hi T cells (Table 2). However, the frequencies of CD4+CD25+ and CD4+CD25hi T cells T cells increased with age in both the NC and FDR control groups (Fig. 2a). In contrast, the frequencies of CD4+CD25+ and CD4+CD25hi T cells did not increase with age, but had a trend of decreasing, in T1D subjects (Fig. 2a). The regression of the frequencies of CD4+CD25+ cells according to age was significantly different in T1D patients versus controls (p = 0.0002 for CD4+CD25+ T cells and p =0.008 for CD4+CD25hi T cells). Furthermore, the mean percentages of CD4+CD25+ cells evaluated at the mean age were significantly different between T1D patients and the combined control group (p = 0.0026), while the means for the two control groups did not differ between themselves (p = 0.60). The difference in mean percentages of CD4+CD25hi cells evaluated at mean age between the controls and the T1D subjects did not reach statistical significance (p = 0.08). To further examine the age related differences between T1D and controls, we specifically examined the frequencies of CD4+CD25+ or CD4+CD25hi T cells after dividing all subjects into young versus older groups using puberty as a cutoff age (14 years). These analyses confirmed the regression results that young T1D subjects had higher frequency of CD4+CD25+ T cells than age-matched normal controls (p = 0.0011, Table 2 and Fig. 2) while older T1D subjects had lower frequency of CD4+CD25+ T cells (p = 0.009). Similar observation was made for CD4+CD25hi T cells (Table 2, Fig. 2).
Table 2.
CD4+CD25+ and CD4+CD25hi T cell frequencies.
| Cells | NC | FDR | T1D | P (NC vs T1D) |
|---|---|---|---|---|
| All subjects | ||||
| CD4+CD25+ T cells | 4.55 ± 2.79 | 6.61± 5.20 | 4.60 ± 2.37 | ns |
| CD4+CD25hi T cells | 1.26 ± 0.80 | 1.87 ± 1.30 | 1.21 ± 0.60 | ns |
| <14 years | ||||
| CD4+CD25+ T cells | 2.67 ± 1.45 | 5.29 ± 5.03 | 5.21 ± 2.59 | 0.0011 |
| CD4+CD25hi T cells | 0.71 ± 0.22 | 1.54 ± 1.11 | 1.23 ± 0.62 | 0.009 |
| >14 years | ||||
| CD4+CD25+ T cells | 6.03 ± 2.59 | 10.10 ± 3.06 | 3.72 ± 1.72 | 0.003 |
| CD4+CD25hi T cells | 1.78 ± 0.60 | 2.44 ± 1.33 | 1.18 ± 0.58 | 0.08 |
Fig. 2.

Correlation between age and the frequencies of CD4+CD25+ and CD4+CD25hi T cells. (A) Percentages of CD4+ T cells (log transformed data) are plotted against subject age. Linear regression was used to analyze the data. FDR: ○ and  ; T1D: △ and
  ; NC: □ and.
  (B) CD4+CD25+ and CD4+CD25hi T cell frequencies (%) in young subjects (≤14 years). (C) CD4+CD25+ and CD4+CD25hi T cell frequencies (%) in old subjects (>14 years).
Proliferation of CD4+CD25− T cells
The proliferation of CD25− naïve T cells was initially tested in 7 healthy control subjects with two different stimulation conditions: 1) 5 μg/ml of soluble anti-CD3, 2.5 μg/ml of soluble anti-CD28 plus 5×10⁴ irradiated APCs, and, 2) identical to condition 1 except plate plate-bounded anti-CD3 was used in the place of soluble anti-CD3. The first condition resulted in moderate proliferation (mean cpm = 22,529 ± 11,168), while the second condition resulted in stronger proliferation (mean cpm = 53,343 ± 15,377) (Fig. 3a). We then used the seven healthy controls to test the ability of CD4+CD25+ T cells to suppress the proliferation of naïve T cells under the two stimulation conditions (Fig. 3b). As expected, CD4+CD25+ T cells suppressed the responder T cell proliferation under both conditions. The stronger stimulation with plate-bound anti-CD3 resulted in weaker suppression compared to the weaker stimulation condition with soluble anti-CD3 (p < 0.001). These results also indicated large variation among individuals in terms of the proliferation of CD4+CD25− T cells. Based on these results, we decided to use the moderate stimulation (with soluble anti-CD3/anti-CD28 plus APC) for the subsequent proliferation studies.
Fig. 3.

Proliferation and suppression of CD4+ T cells. (A) Proliferation of CD4+CD25− T cells (5,000 cells per well) in seven healthy subjects (5 Asian and 2 Caucasians, 35–50 years old) under two different stimulation conditions. Both conditions contain 2.5 μg/ml of soluble anti-CD28 and 5×10⁴ irradiated APCs. The first condition (open bars) also contains 5 μg/ml of soluble anti-CD3 and the second condition (solid bars) contains plate-bounded anti-CD3. (B) Suppression of CD4+CD25− T cell proliferation (5,000 cells) by CD4+CD25+ T cells (5,000 cells) in seven healthy subjects with two different stimulation conditions as described for (A): condition 1 (open bars) and condition 2 (solid bars). (C) Correlation between age and proliferation of CD4+CD25− T cells analyzed by box plots. All study subjects were divided into young subjects (<14 years) and older subjects (>14 years). Proliferation was shown as log transformed cpm values. (D) Dose-dependent suppression by CD4+CD25+ Treg. Representative proliferation of CD4+CD25− T cells from two control subjects in the presence of different ratios of CD4+CD25+ Treg.
The proliferation of CD4+CD25− T cells was examined in 41 T1D (20 with age <14ys; 21 with age > 14ys), 40 normal controls (NC) (10 with age <14ys; 30 with age >14ys), and 6 FDR control subjects (all with age < 14ys). The extent of T cell proliferation in these data showed a large level of biological variation as proliferation ranged from almost none (CPM < 100) to very high (cpm > 290,000). Based on an analysis of variance that included both phenotype group (T1D, NC, or FDR) as a factor and age as a covariate, the T1D and control groups showed no significant difference in mean proliferation (p = 0.76). However, the proliferation was associated with age (p = 0.0013), when all subjects from the three phenotype groups were analyzed together. To further examine the influence of age on T cell proliferation, we divided all study subjects (T1D and both control groups) into young children versus adults based on puberty age (14 years). As shown by Boxplots (Fig. 3c), the 25th percentile and 50th percentile of proliferation were higher in the older subject group than younger subject group (p < 0.0001). Interestingly, there was also higher frequency of subjects with very low proliferation (<1,000cpm) in the T1D group (30%) than in the NC group (11%) (OR = 3.7, p < 0.03).
Suboptimal suppression of T cell proliferation in T1D
The moderate stimulation (soluble anti-CD3/antiCD-28 plus APC) was used to examine the suppression of CD4+CD25− T cell proliferation. We performed suppression assays with different doses of CD4+CD25+ T cells. As expected, a dose-dependent suppression was observed in all experiments (Fig. 3d). A total of 37 T1D subjects and 36 controls were examined for their in vitro suppression activity with a 1:1 Treg:Teff ratio. A subset of the subjects from both groups was excluded from data analysis because their proliferation without Treg was below 1,000 cpm and the suppression function cannot be reliably measured. After this exclusion, 32 NC subjects and 25 T1D patients could be used for data analysis. No significant association was observed between suppression and age, disease duration or proliferation (data not shown). As shown in Fig. 4, the suppression activity varied greatly among individuals from both phenotype groups (range: 0 – 99%). The mean of suppression was slightly lower in T1D (38.6%) compared to controls (47.5%), although the difference was not statistically significant (p = 0.18). Examination of the data indicated a greater proportion of T1D patients with very low suppression compared to controls. Therefore, we assessed the potential difference in the frequency of subjects with low suppression activity (below 25% or the first quartile). Ten of the 25 T1D subjects (40%) had very low suppression, while only 2 of the 32 control subjects (6.3%) had very low suppression (Table 3 & Fig. 4). The frequency of subjects with very low suppression was significantly higher in T1D subjects than normal controls (OR = 10, p < 0.002) (Table 3).
Fig. 4.
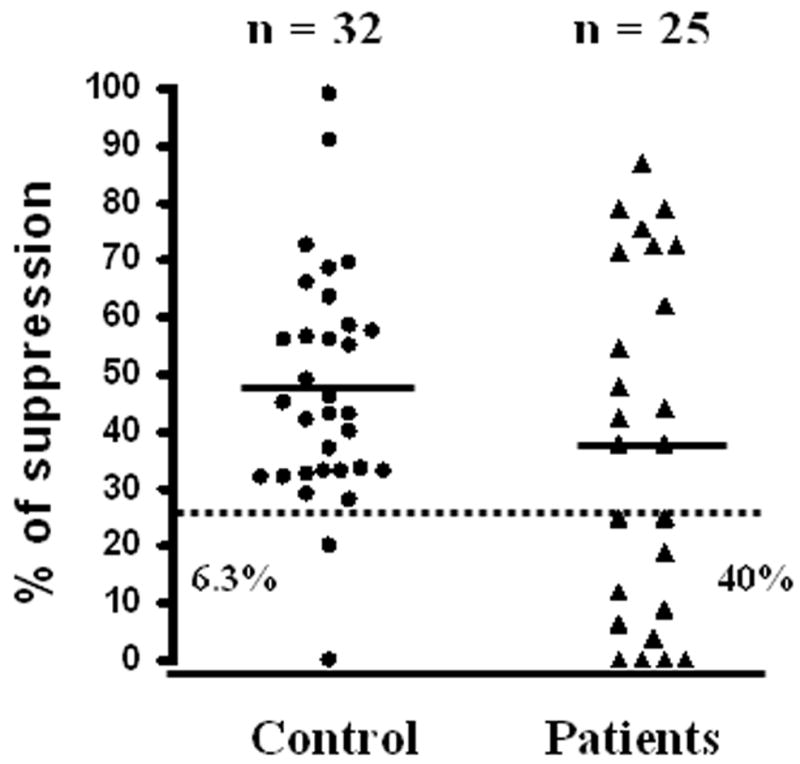
Suboptimal suppression in T1D subjects. The percentages of suppression of CD4+CD25−T cell proliferation by CD4+CD25+ Treg (Treg: Teff ratio: 1:1) are shown for normal controls (black circles) and T1D patients (black triangles). Horizontal solid lines represent means; dashed line represents the cutoff (25%) for high versus low suppression; n is the number of subjects in each group. The percentages of subjects below the cutoff are also shown for controls (6.3%) and T1D subjects (40%).
Table 3.
Meta analysis of suppression in T1D and control subjects
| Study | T1D |
Controls |
OR | P value | ||
|---|---|---|---|---|---|---|
| Low | High | Low | High | |||
| Jin et al. | 10 (40.0%) | 15 (60.0%) | 2 (6.3%) | 30 (93.7%) | 10.0 | 0.002 |
| Lindley et al | 6 (54.6%) | 5 (45.4%) | 1 (10.0%) | 9 (90.0%) | 10.8 | 0.03 |
| Brusko et al. | 5 (50.0%) | 5 (50.0%) | 1 (11.1%) | 8 (88.9%) | 8.0 | 0.07 |
| Combined | 21 (45.7%) | 25 (54.3%) | 4 (7.8%) | 47 (92.2%) | 9.9 | 0.00002 |
Low suppression is defined as equal or less than 25% suppression and High suppression is defined as greater than 25%.
Correlation between APC source and suppression activity
The suboptimal suppression observed in diabetic patients has conventionally been attributed to defects in the Treg cells. However, this view has now been questioned by results obtained in different mouse models. Therefore, we attempted to identify the cell populations responsible for the suboptimal suppression function observed in human subjects. For this purpose, we decided to compare the in vitro suppression ability by mixing Treg, Teff and APC from one high suppressor (H) and one low suppressor (L) selected based on autologous suppression results. Data showing in Fig. 5a suggest that APC from high suppressors can induce high suppression activity of Treg cells from low suppressor and APC from low suppressors cannot induce strong suppression activity with Treg cells from high suppressors. These experiments indicate that the Treg from low suppressors may not defective but the APC from low suppressors may be defective in activating Treg. To further substantiate the importance of APC in the suppression function, we carried out suppression assays using Treg and Teff cells from one common blood donor with high suppression function to test the function of APC from six other individuals, three with high autologous suppression and three with very low autologous suppression. As shown in the top panel of Fig. 5b, the autologous suppression activity was significantly correlated with the heterologous suppression activity in these subjects with very low or very high autologous suppression (R2 = 0.87, p < 0.01). We further tested six other subjects who have moderate autologous suppression. The heterologous suppression activity was also moderate in all six subjects with moderate autologous suppression (Fig. 5b, bottom panel). When all twelve subjects are analyzed together, the autologous and heterologous suppression activity (APC function) are significantly correlated (Fig. 5b bottom panel, R2 = 0.48, p < 0.05). These results highlight the critical importance of APC in the suppression function; however, they do not exclude the possibility that Treg cells may be responsible for the suppression defects observed in some other individuals.
Fig. 5.

Dissection of cellular components critical for in vitro suppression activity. (a) Treg, APC and responder T cells (Tresp) are purified from pairs of subjects, one with high suppression activity (H) in autologous suppression assay and another with low (L) autologous suppression activity. All six combinations of the three cellular components are tested for in vitro suppression activity. These results indicate APC as the possible cell population related to suppression activity. (b) Treg and Teff cells were purified from one blood donor with high autologous suppression activity (T cell donor) and APC were purified from 12 different blood donors with different autologous suppression activity. The function of APC was tested by heterologous suppression assays that mix Treg and Teff cells from the common T cell donor and APC from each of the 12 APC donors. APC function (heterolgous suppression) is plotted against autologous suppression activity.
DISCUSSION
In this study, we first examined the frequencies of peripheral CD4+CD25+/hi T cells in normal controls, FDR and T1D patients. Consistent with the three previous studies, no significant difference in the percentages of CD4+CD25+ or CD4+CD25hi T cells could be revealed between T1D and controls when all subjects are analyzed together. However, the data should be examined with age as a co-factor because the frequencies of these cells increase with age in healthy controls. After adjusting for age, the percentages of CD4+CD25+ and CD4+CD25hi T cells in CD4+ T cells do differ significantly between T1D and controls. In contrast to our expectation, the young (≤ 14 years) T1D subjects actually have higher frequencies of CD4+CD25+ and CD4+CD25hi T cells compared to age-matched healthy controls. Interestingly, the trend is reversed in subjects older than 14 years. Although our results need to be confirmed in other populations, the overall evidence from this study and the three other reports suggest that the frequencies of CD4+CD25+ and CD4+CD25hi T cells are not deficient in T1D subjects in the main age group that T1D occurs.
It can be argued that CD25 is not a specific marker for Treg and the CD25+ T cells contain activated effector T cells. This possibility needs to be further studied in the future using more specific Treg markers. FOXP3 is considered as a specific Treg marker, at least in the mice. FOXP3 protein levels were previously analyzed by using intra-cellular staining [18] and no difference was found between T1D patients and controls. However, a recent report suggested that the anti-FOXP3 antibody from the PCH101 clone used in the study by Brusko et al. [15], stains non-specifically [19]. The impact of non-specific staining on the results is unknown. A more specific FOXP3 antibody should be used to further examine this question. It has also been reported that the CD127 is a useful marker in identifying CD4+CD25+ Treg in human [23–25]. CD127 is particularly useful in separating CD25low T cells into a Treg subset (CD4+CD25+CD127low) and an effector subset (CD4+CD25+CD127low)[25]. However, almost all CD4+CD25hi T cells are CD127low [25]. In this study, CD127 was not used to select Treg cells. Therefore, the results on the frequency of CD25+ cells should not be interpreted as pure Treg cells. However, our CD4+CD25hi population based on our gating strategy should be mostly Treg cells.
In vitro suppression assays have been extensively used to investigate the suppression function of Treg cells in animal models and patients with autoimmune diseases. Two previous studies with very small sample sizes (10 patients and 9 controls in one study, and 11 patients and 10 controls in the other study) indicated a defect in Treg suppression in T1D patients compared to normal controls [15,16]. In a third study with slightly larger sample size (17 patients and 19 controls) [17], the mean suppression in T1D patients (64.7%) was also lower than in controls (81.1%) when soluble anti-CD3 and anti-CD8 were used as stimulation, although the authors concluded that there was no statistical significance. Similarly, the mean suppression is lower in T1D patients (44.2%) than controls (58.5%) when T cells were stimulated with plate-bound anti-CD3 at very low concentration. Despite the lack of statistical support, the study does not provide evidence against a suppression deficiency associated with T1D patients and indeed is consistent with the two previous reports. In this study we carried out in vitro suppression assays using a modified immuno-magnetic method to obtain CD4+CD25hi cells. Consistent with previous studies, we found that CD4+CD25hi cells are anergic to nonspecific antigen stimulation and have a dose-dependent suppressive function [26,27]. The strength of stimulus is a critical factor for the suppression assay, since over-stimulation can mask the suppressive function of Treg [13,17]. Similar to previous findings, our study revealed a great deal of individual variability in suppressive activity. Our study with a larger sample size suggests that there are a significantly higher proportion of subjects with very low suppression activity in T1D patients compared to healthy controls. Interestingly, the overall mean suppression (~40%) in our study is similar to those observed in two of the three suppression studies [15,16], while the mean suppression is higher in the third study [17]. Therefore, we attempted to carry out a meta-analysis of the three studies with similar suppressive activity. We used the 25% suppression as a cutoff to define low versus high suppression in all three studies. The distribution of low and high suppressors in T1D and control subjects is summarized in Table 3. It is evident that there are a higher proportion of low suppressors in T1D subjects than control subjects in all three studies (OR = 8.8 –10.8). A meta-analysis of the three data sets using Mantel-Haenszel method suggests that the difference between T1D and controls is highly significant (OR = 9.67 with 95% confidence interval = 3.0 –31.4, p = 0.0001). In the pooled data set, 46% of the T1D patients are deficient in suppression of T cell proliferation.
The in vitro suppression defect has generally been interpreted as reflecting a defect in Treg function. Recent studies in the NOD mouse model of T1D indicated that the defect in T cell suppression may not be due to defects in Treg. Therefore, the human suppression data cannot be simply interpreted as functional defect of Treg without further evidence linking suppression defect to Treg. We addressed this very important question by mixing the three cell components from high and low suppressors in the suppression assay. In the subjects that we have studied, the autologous suppression activity is significantly correlated with APC function measured by heterologous suppression assay. Our studies highlight the importance of APC in the suppression assay and suggest that the APC may be a major source for the in vitro suppression defects observed in both T1D patients and controls. In light of the excellent correlation between autologous suppression activity and APC function (heterologous suppression), our study is consistent with the possibility that APC may be the main cell population responsible for the suppression defect in diabetic patients. This hypothesis is consistent with the findings that the defects in APC are responsible for the suboptimal suppression in diabetic NOD mice [20]. This intriguing possibility should be further substantiated in large cohorts of study subjects and multiple populations. The specific cells responsible for the suppression defect have not been identified. In our recent studies (Chen et al. CLIM, in press), we have identified a deficiency in plasmacytoid DC (pDC) inT1D patients. Since pDC are known to play critical role in activating/converting Treg, it will be interesting to investigate whether the pDC deficiency observed in T1D patients are responsible for the observed suppression defect.
Obviously, this study did not rule out the possibility that the suboptimal suppression activities in some subjects (both T1D and controls) may be attributed to defects in Treg or Teff cells. Based on recent data from the mouse models [21,22], the suboptimal suppression may be due to the defects in effector T cells. Whether similar defects also exist in human T1D patients is still an open question that needs to be addressed.
Acknowledgments
This work was partially supported by grants from the National Institutes of health (2RO1HD37800, 4R33DK069878, 4R33HD050196 and 5U24DK58778) and Juvenile Diabetes Research Foundation International (JDRF 1-2004-661) to JXS.
Footnotes
Publisher's Disclaimer: This is a PDF file of an unedited manuscript that has been accepted for publication. As a service to our customers we are providing this early version of the manuscript. The manuscript will undergo copyediting, typesetting, and review of the resulting proof before it is published in its final citable form. Please note that during the production process errors may be discovered which could affect the content, and all legal disclaimers that apply to the journal pertain.
References
- 1.Danke NA, Koelle DM, Yee C, Beheray S, Kwok WW. Autoreactive T cells in healthy individuals. J Immunol. 2004;172:5967–5972. doi: 10.4049/jimmunol.172.10.5967. [DOI] [PubMed] [Google Scholar]
- 2.Santamaria P. Effector lymphocytes in autoimmunity. Curr Opin Immunol. 2001;13:663–669. doi: 10.1016/s0952-7915(01)00276-x. [DOI] [PubMed] [Google Scholar]
- 3.Lernmark A. Controlling the controls: GAD65 autoreactive T cells in type 1 diabetes. J Clin Invest. 2002;109:869–870. doi: 10.1172/JCI15381. [DOI] [PMC free article] [PubMed] [Google Scholar]
- 4.O’Connor KC, Bar-Or A, Hafler DA. The neuroimmunology of multiple sclerosis: possible roles of T and B lymphocytes in immunopathogenesis. J Clin Immunol. 2001;21:81–92. doi: 10.1023/a:1011064007686. [DOI] [PubMed] [Google Scholar]
- 5.Sakaguchi S, Sakaguchi N, Shimizu J, Yamazaki S, Sakihama T, Itoh M, Kuniyasu Y, Nomura T, Toda M, Takahashi T. Immunologic tolerance maintained by CD25+ CD4+ regulatory T cells: their common role in controlling autoimmunity, tumor immunity, and transplantation tolerance. Immunol Rev. 2001;182:18–32. doi: 10.1034/j.1600-065x.2001.1820102.x. [DOI] [PubMed] [Google Scholar]
- 6.Suri-Payer E, Amar AZ, Thornton AM, Shevach EM. CD4+CD25+ T cells inhibit both the induction and effector function of autoreactive T cells and represent a unique lineage of immunoregulatory cells. J Immunol. 1998;160:1212–1218. [PubMed] [Google Scholar]
- 7.Thornton AM, Shevach EM. CD4+CD25+ immunoregulatory T cells suppress polyclonal T cell activation in vitro by inhibiting interleukin 2 production. J Exp Med. 1998;188:287–296. doi: 10.1084/jem.188.2.287. [DOI] [PMC free article] [PubMed] [Google Scholar]
- 8.Asano M, Toda M, Sakaguchi N, Sakaguchi S. Autoimmune disease as a consequence of developmental abnormality of a T cell subpopulation. J Exp Med. 1996;184:387–396. doi: 10.1084/jem.184.2.387. [DOI] [PMC free article] [PubMed] [Google Scholar]
- 9.Suri-Payer E, Amar AZ, Thornton AM, Shevach EM. CD4+CD25+ T cells inhibit both the induction and effector function of autoreactive T cells and represent a unique lineage of immunoregulatory cells. J Immunol. 1998;160:1212–1218. [PubMed] [Google Scholar]
- 10.Read S, Malmstrom V, Powrie F. Cytotoxic T lymphocyte-associated antigen 4 plays an essential role in the function of CD25(+)CD4(+) regulatory cells that control intestinal inflammation. J Exp Med. 2000;192:295–302. doi: 10.1084/jem.192.2.295. [DOI] [PMC free article] [PubMed] [Google Scholar]
- 11.Ng WF, Duggan PJ, Ponchel F, Matarese G, Lombardi G, Edwards AD, Isaacs JD, Lechler RI. Human CD4+CD25+ cells: a naturally occurring population of regulatory T cells. Blood. 2001;98:2736–2744. doi: 10.1182/blood.v98.9.2736. [DOI] [PubMed] [Google Scholar]
- 12.Dieckmann D, Plottner H, Berchtold S, Berger T, Schuler G. Ex vivo isolation and characterization of CD4(+)CD25(+) T cells with regulatory properties from human blood. J Exp Med. 2001;193:1303–1310. doi: 10.1084/jem.193.11.1303. [DOI] [PMC free article] [PubMed] [Google Scholar]
- 13.Baecher-Allan C, Brown JA, Freeman GJ, Hafler DA. CD4+CD25high Regulatory Cells in Human Peripheral Blood. J Immunol. 2001;167:1245–1253. doi: 10.4049/jimmunol.167.3.1245. [DOI] [PubMed] [Google Scholar]
- 14.Baecher-Allan C, Viglietta V, Hafler DA. Inhibition of Human CD4+CD25+high Regulatory T Cell Function. J Immunol. 2002;169:6210–6217. doi: 10.4049/jimmunol.169.11.6210. [DOI] [PubMed] [Google Scholar]
- 15.Brusko TM, Wasserfall CH, Clare-Salzler MJ, Schatz DA, Atkinson MA. Functional defects and the influence of age on the frequency of CD4+ CD25+ T-cells in type 1 diabetes. Diabetes. 2005;54:1407–1414. doi: 10.2337/diabetes.54.5.1407. [DOI] [PubMed] [Google Scholar]
- 16.Lindley S, Dayan CM, Bishop A, Roep BO, Peakman M, Tree TI. Defective suppressor function in CD4(+)CD25(+) T-cells from patients with type 1 diabetes. Diabetes. 2005;54:92–99. doi: 10.2337/diabetes.54.1.92. [DOI] [PubMed] [Google Scholar]
- 17.Putnam AL, Vendrame F, Dotta F, Gottlieb PA. CD4+CD25high regulatory T cells in human autoimmune diabetes. J Autoimmun. 2005;24:55–62. doi: 10.1016/j.jaut.2004.11.004. [DOI] [PubMed] [Google Scholar]
- 18.Brusko T, Wasserfall C, McGrail K, Schatz R, Viener HL, Schatz D, Haller M, Rockell J, Gottlieb P, Clare-Salzler M, Atkinson M. No Alterations in the Frequency of FOXP3+ Regulatory T-Cells in Type 1 Diabetes. Diabetes. 2007;56:604–612. doi: 10.2337/db06-1248. [DOI] [PubMed] [Google Scholar]
- 19.Tran DQ, Ramsey H, Shevach EM. Induction of FOXP3 expression in naive human CD4+FOXP3 T cells by T-cell receptor stimulation is transforming growth factor-{beta} dependent but does not confer a regulatory phenotype. Blood. 2007;110:2983–2990. doi: 10.1182/blood-2007-06-094656. [DOI] [PMC free article] [PubMed] [Google Scholar]
- 20.Alard P, Manirarora JN, Parnell SA, Hudkins JL, Clark SL, Kosiewicz MM. Deficiency in NOD Antigen-Presenting Cell Function May Be Responsible for Suboptimal CD4+CD25+ T-Cell-Mediated Regulation and Type 1 Diabetes Development in NOD Mice. Diabetes. 2006;55:2098–2105. doi: 10.2337/db05-0810. [DOI] [PubMed] [Google Scholar]
- 21.You S, Belghith M, Cobbold S, Alyanakian MA, Gouarin C, Barriot S, Garcia C, Waldmann H, Bach JF, Chatenoud L. Autoimmune Diabetes Onset Results From Qualitative Rather Than Quantitative Age-Dependent Changes in Pathogenic T-Cells. Diabetes. 2005;54:1415–1422. doi: 10.2337/diabetes.54.5.1415. [DOI] [PubMed] [Google Scholar]
- 22.Zhou L, Wang H, Zhong X, Jin Y, Mi QS, Sharma A, McIndoe R, Garge N, Podolsky R, She JX. The IL-10 and IFN-gamma pathways are essential to the potent immunosuppressive activity of cultured CD8+ NKT-like cells. Genome Biology. 2008;9:R119. doi: 10.1186/gb-2008-9-7-r119. [DOI] [PMC free article] [PubMed] [Google Scholar]
- 23.Seddiki N, Santner-Nanan B, Martinson J, Zaunders J, Sasson S, Landay A, Solomon M, Selby W, Alexander SI, Nanan R, Kelleher A, de St Groth BF. Expression of interleukin (IL)-2 and IL-7 receptors discriminates between human regulatory and activated T cells. J Exp Med. 2006;203:1693–1700. doi: 10.1084/jem.20060468. [DOI] [PMC free article] [PubMed] [Google Scholar]
- 24.Liu W, Putnam AL, Xu-yu Z, Szot GL, Lee MR, Zhu S, Gottlieb PA, Kapranov P, Gingeras TR, de St Groth BF, Clayberger C, Soper DM, Ziegler SF, Bluestone JA. CD127 expression inversely correlates with FoxP3 and suppressive function of human CD4+ T reg cells. J Exp Med. 2006;203:1701–1711. doi: 10.1084/jem.20060772. [DOI] [PMC free article] [PubMed] [Google Scholar]
- 25.Hartigan-O’Connor DJ, Poon C, Sinclair E, McCune JM. Human CD4+ regulatory T cells express lower levels of the IL-7 receptor alpha chain (CD127), allowing consistent identification and sorting of live cells. Journal of Immunological Methods. 2007;319:41–52. doi: 10.1016/j.jim.2006.10.008. [DOI] [PubMed] [Google Scholar]
- 26.Jonuleit H, Schmitt E, Stassen M, Tuettenberg A, Knop J, Enk AH. Identification and functional characterization of human CD4(+)CD25(+) T cells with regulatory properties isolated from peripheral blood. J Exp Med. 2001;193:1285–1294. doi: 10.1084/jem.193.11.1285. [DOI] [PMC free article] [PubMed] [Google Scholar]
- 27.Stephens LA, Mottet C, Mason D, Powrie F. Human CD4(+)CD25(+) thymocytes and peripheral T cells have immune suppressive activity in vitro. Eur J Immunol. 2001;31:1247–1254. doi: 10.1002/1521-4141(200104)31:4<1247::aid-immu1247>3.0.co;2-m. [DOI] [PubMed] [Google Scholar]