Abstract
High levels of choline kinase (ChoK) expression and choline phospholipid metabolites are often associated with malignant transformation, invasion, and metastasis, particularly in breast cancer. These findings have led to the development of novel pharmacologic or gene therapeutic interventions for ChoK-targeted inhibition. To identify pharmacodynamic markers for the therapeutic evaluation of ChoK down-regulation, we investigated the uptake and efflux of [3H]choline, a natural substrate of ChoK, and two other important metabolic indicators of malignancy, namely, [3H]thymidine and [3H]fluorodeoxyglucose, which measure proliferation and glucose metabolic changes, respectively, in ChoK-downregulated cells. Choline uptake in nonmalignant and malignant breast epithelial cell lines expressing graded levels of ChoK showed a ChoK-dependent uptake, retention, and efflux of [3H]choline. Reduced proliferation observed because of ChoK down-regulation resulted in reduced [3H]thymidine uptake and incorporation into DNA within 48 hours of treatment. Reduced [3H]thymidine incorporation levels were consistent with a decreased cell cycle S-phase fraction. No change in [3H]fluorodeoxyglucose uptake was observed between ChoK-downregulated and control cells in any of the three cell lines tested. These results demonstrate the utility of radiolabeled choline or choline analogs and proliferation imaging agents as pharmacodynamic markers for ChoK-targeted therapies and suggest a ChoK-mediated mechanism for tumor sequestration of choline-based imaging agents.
Introduction
Elevated levels of total choline primarily due to an increase in choline metabolites such as phosphocholine (PC) have been detected in several cancers, including breast [1,2], prostate [3], colon [4], and brain [5], using magnetic resonance (MR) spectroscopy. Human breast cancer cells and tumors, especially, exhibit consistently elevated levels of PC [6,7], allowing total choline levels to be used to discriminate between malignant and benign lesions [8]. In addition, progressively elevated levels of total choline and PC were observed in immortalized, oncogene-transformed, and tumor-derived breast epithelial cells [9]. Decreased tumor total choline levels are usually associated with a positive response to conventional chemotherapy in breast cancer [10] and suggest a role for choline compounds as biomarkers to assess response to chemotherapy.
Phosphocholine, which is formed by the phosphorylation of free choline by choline kinase (ChoK), is a precursor as well as a breakdown product of phosphatidylcholine (PtdCho), the major phospholipid constituent of cell membranes. Formation of PC depends on choline transport, ChoK expression and activity, and phospholipase expression levels and activities [11–13]. There is increasing evidence that phosphorylation of choline by ChoK can regulate PtdCho biosynthesis [14,15]. Increased PC and PtdCho levels accompany an increase in ChoK activity or expression, suggesting a critical role for ChoK in malignant transformation [11,13,16,17]. Overexpression and increased activity of ChoK as well as associated PC levels were reported in breast, lung, prostate, and colon cancer cell lines and in breast and colon tumors [16,18–21]. The increased ChoK activity in tumor-derived cell lines and human tumors compared with their corresponding normal tissues supports a role for ChoK in malignant transformation [16,22]. Two genes, namely, ChoK-α and ChoK-β, code for the two gene products ChoK-α and ChoK-β. ChoK-α exists as two isoforms, ChoK-α1 (50 kDa, 435 amino acids) and ChoK-α2 (52 kDa, 453 amino acids), which are highly homologous and derived from the identical gene ChoK-α by alternative splicing. ChoK-β is a separate gene product formed from ChoK-β [23]. Recently, overexpression of ChoK-α has been implicated as a predictive marker of recurrence in lung cancer [24]. These findings suggest ChoK as a potential therapeutic target for pharmacologic or gene therapeutic interventions. Bisquaternery compounds based on hemicholimium 3 as inhibitors of ChoK and ChoK-specific small interfering RNA (siRNA) technology are being actively pursued to target ChoK [25–27]. Also, combination treatments that include ChoK-α down-regulation in association with antineoplastic agents such as 5-fluorouracil have been tested. In a recent study, Mori et al. [28] demonstrated that down-regulation of ChoK increased the effect of 5-fluorouracil treatment in breast cancer cells, suggesting that ChoK may represent a novel target to enhance the effectiveness of anticancer agents.
The recent shift in anticancer therapeutics from conventional cytotoxic compounds to targeted agents, which may be cytostatic, requires novel measures of monitoring that are able to replace traditional end points such as tumor shrinkage or survival. Surrogate end points that use imaging are particularly desirable to detect early, physiologic changes in the tumor and enable switching from ineffective therapies in real time. Accordingly, there is a great need to develop molecular imaging techniques and suitable pharmacodynamic markers in conjunction with molecular therapeutics. Positron emission tomography (PET) and MR methods are two clinically translatable, noninvasive imaging techniques that are increasingly being used to detect tumor response to targeted therapy [29,30]. Significant progress has been made in using noninvasive MR-based techniques to assess the total choline signal in tumors as a measure of ChoK treatment response [27,31]. Here, we have used [3H]choline, a natural substrate of ChoK, and two other clinically important metabolic indicators of malignancy, namely, [3H]fluorodeoxyglucose ([3H]FDG) for glucose metabolism and [3H]thymidine ([3H]Tdr) for proliferation, to detect ChoK activity and ChoK targeting in breast cancer cells. We observed ChoK-dependent uptake and retention of [3H]choline in these cells. In addition, reduced proliferation due to siRNA-mediated ChoK down-regulation was detected as early as 48 hours after initiation of treatment. These studies support the use of radiolabeled choline or choline analogs and proliferation imaging agents as noninvasive markers for in vivo evaluation of ChoK-targeted therapy using PET-based nuclear imaging.
Materials and Methods
Radiochemicals
[3H]Choline chloride (83.0 Ci/mmol, >99% radiochemical purity), [3H]Tdr (63.8 Ci/mmol, >99% radiochemical purity), and [3H]FDG (60.0 Ci/mmol, >99% radiochemical purity) were obtained from Amersham Biosciences (Piscataway, NJ), Moravek Biochemicals (Brea, CA) and American Radiochemicals, Inc (St. Louis, MO), respectively.
Cell Lines
An immortalized human mammary epithelial cell line MCF-12A, and the estrogen receptor (ER)/progesterone receptor (PR)-positive MCF-7 and the ER/PR-negative MDA-MB-231 human breast cancer cell lines, with progressively increasing levels of ChoK expression and malignancy, were used for the studies. All cell lines were purchased from American Type Culture Collection (Rockville, MD) and were maintained as described previously [27].
Determination of Protein Content and Western Blot Analysis
Cells were washed twice with PBS and homogenized with TB buffer (100 mM Tris (pH 6.7), 2% SDS, 12% glycerol) containing protease inhibitor cocktail (Sigma, St. Louis, MO). Protein concentrations were determined using a Biorad (Hercules, CA) protein assay kit. Standard concentrations of bovine serum albumin were used to obtain a calibration curve. Aliquots containing 20 µg of the total protein along with a molecular weight standard were loaded and electrophoretically separated on a 10% polyacrylamide gel. Separated proteins were transferred onto nitrocellulose membranes and blocked with 5% nonfat milk with 0.05% Tween-20 overnight at 4°C. Membranes were then incubated with custom-made rabbit polyclonal ChoK-α-specific primary antibody (immunoglobulin G, 1:100 dilution) raised against a hydrophilic synthetic peptide (Proteintech Group, Inc, Chicago, IL) [27] followed by goat antirabbit antibody conjugated to horseradish peroxidase (1:10,000 dilution). After three washes bands were visualized using Supersignal West Pico chemiluminescent substrate kit (Pierce Biotechnology, Rockford, IL) [27].
Cell Transfections and General Procedure for Radiopharmaceutical Uptake Studies
All three cell lines were seeded at 1 x 10⁵ cell/ml in six-well plates. Approximately 30% to 50% confluent cells were transiently transfected with 2.6 nmol of the ChoK-specific siRNA (ChoK-siRNA; Dharmacon, Lafayette, CO) using Oligofectamine (Invitrogen, San Diego, CA) according to the manufacturer's instructions. Control cells were treated with Oligofectamine alone. After 48 hours of transfection, cells were washed twice and incubated with the appropriate radiopharmaceutical for different periods. Any changes from this general procedure are mentioned in the appropriate section discussed later. Radioactivity concentrations were determined by mixing supernatants or solubilized pellets with 10 to 15 ml of Ultima Gold scintillation cocktail (Packard Bioscience, Meriden, CT), which was counted for 5 minutes on a liquid scintillation counter (Tri-Carb; Packard Bioscience) with external standard quench correction. All experiments were performed in triplicate, with data reported as percentage of incubated dose (%ID) per microgram of total protein.
[3H]choline Uptake
Transfected cell lines and their controls were incubated with [3H]choline chloride at 0.2 µCi/well for 5, 15, 30, 45, 60, 120, and 180 minutes. At the end of the incubation period, cells were rinsed four times with ice-cold PBS, and the cell pellet was solubilized using 0.2 ml of Solvable (Packard Bioscience). Radioactivity concentrations were determined as described above.
[3H]choline Efflux
Transfected cell lines and their controls were pulsed with 0.2 µCi/well of [3H]choline chloride for 10 minutes. Then, after aspiration of the radioactive medium, cells were rinsed twice with ice-cold PBS, refreshed with 2 ml of standard medium, and transferred into a 37°C incubator. No cold choline was added during the experiment. Previous studies determined that medium used in these studies contained 20 µM of choline [11]. Effluxed activity was measured by counting radioactivity in the medium at 15, 30, 45, 60, 120, and 180 minutes.
[3H]thymidine Uptake
Transfected cell lines and their controls were incubated with [3H]Tdr at 0.2 µCi/well for 5, 15, 30, 45, 60, 120, and 180 minutes. After the designated incubation period, cells were washed three times with ice-cold PBS, trypsinized, and extracted with 1 M perchloric acid. Total radioactivity in the soluble fraction and radioactivity in the DNA pellet, after solubilization with Solvable (Perkin-Elmer Life Sciences, Waltham, MA), were measured in a scintillation counter as described above.
S-Phase Analysis
For bromodeoxyuridine (BrdU) staining, cells were incubated with 10 µM BrdU for 45 minutes at 48 hours after transfection. Cells were harvested, pelleted, washed with PBS containing 1% bovine serum albumin, resuspended in 100 µl of PBS, and fixed in 4 ml of chilled 70% ethanol. Before staining, cells were pelleted at 300g for 5 minutes and incubated in 0.5 ml of a solution containing 2 M HCl for 30 minutes at room temperature. The acid was then neutralized with 0.5 ml of 0.1 M sodium tetraborate (pH 8.5). Cells were pelleted, washed once with PBS buffer, and incubated in 100 µl of PBS buffer containing 20 µl of fluorescein isothiocyanate-conjugated anti-BrdU antibody for 30 minutes at ambient temperature. After antibody incubation, cells were washed once with PBS buffer and then incubated in 0.5 ml of PBS containing 20 µl/ml of propidium iodide (PI) and 40 µl/ml of RNAse. Cells were then analyzed on BD FACScan (BD Biosciences, San Jose, CA) to determine PI (red) and fluorescein isothiocyanate (green) staining for nuclear DNA and BrdU content, respectively.
[3H]Fluorodeoxyglucose Uptake
One hour before [3H]FDG incubation, transfected MDA-MB-231 cells and MCF-12A cells were incubated with low-glucose (1.0 g/L) medium to mimic plasma concentration levels. MCF-7 cells were incubated with [3H]FDG without any modification in the minimum essential medium. Transfected cell lines and their controls, incubated with 0.2 µCi/well of [3H]FDG for variable periods, were processed as described in the general procedure.
Statistical Analysis
Statistical analysis was performed using prism software (La Jolla, CA) using an unpaired, 2-tailed t test. P values <.05 for the comparison between ChoK-downregulated cells and the corresponding controls were considered to be significant.
Results
Choline Kinase Down-regulation
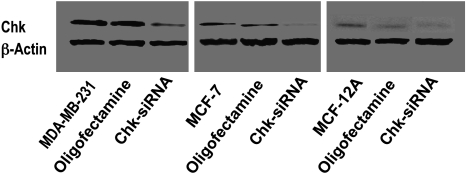
Choline kinase expression levels increased with increasing malignancy of the cell lines, i.e., MDA-MB-231 > MCF-7 > MCF-12A (Figure 1). Using ChoK-specific siRNA, we were able to achieve 40% to 60% ChoK-α down-regulation compared with Oligofectamine-treated control, consistent with previously published reports [27,28] (Figure 1).
Figure 1.
Choline kinase down-regulation in MDA-MB-231, MCF-7, and MCF-12A breast cancer cell lines as detected by ChoK-α-specific antibody.
[3H]choline Uptake
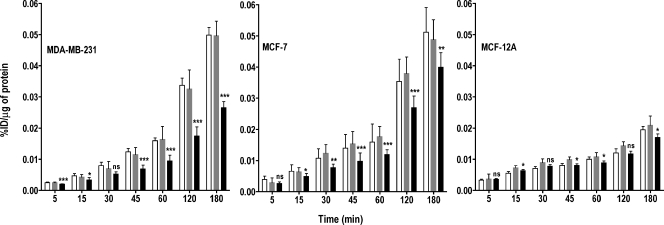
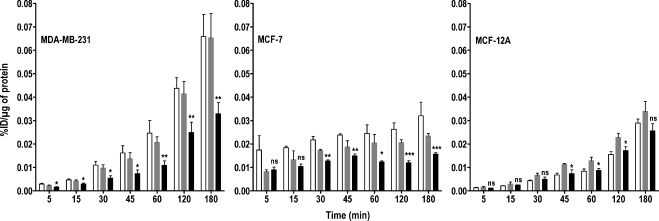
The accumulation of choline compounds in cancer cells is a function of both choline transport and rapid phosphorylation by ChoK. To investigate the importance of ChoK, we incubated the two malignant cell lines, MDA-MB-231 and MCF-7, and the nonmalignant, immortalized human mammary epithelial cell line, MCF-12A, with [3H]choline for various periods. Down-regulation of ChoK in high ChoK-expressing cells resulted in a significant reduction in [3H]choline accumulation-related radioactivity with time, which was not observed in the nonmalignant epithelial cell line with low ChoK expression (Figure 2). Oligofectamine treatment alone did not result in any statistically significant difference in [3H]choline uptake compared with untreated cells in all the three cell lines, hence Oligofectamine-treated cells were used as controls for all comparisons. In the cancer cell lines, ChoK-siRNA treatment resulted in a significant decrease in [3H]choline uptake and accumulation from the 45-minute incubation period onward (P < .001). To facilitate comparison with clinical studies, where carbon-11- or fluorine-18-labeled analogs are used, all of our in vitro data were compared at the 60-minute time point typically used for clinical studies. At 60 minutes, ChoK down-regulation resulted in 42% (P < .0001), 38% (P < .0001), and 18% (P < .0175) reductions in overall choline uptake in MDA-MB-231, MCF-7, and MCF-12A cells, respectively, compared with controls.
Figure 2.
Kinetics of [3H]choline uptake in MDA-MB-231, MCF-7, and MCF-12A breast cancer cell lines with varying levels of ChoK expression. Cell lines were untreated (clear bar), treated with Oligofectamine alone (gray bar), or transfected with ChoK-specific siRNA (solid black bar) and, at 48 hours after transfection, were incubated with 0.2 µCi/ml of [3H]choline chloride for increasing periods. Results shown are the mean values of experiments performed in triplicate and from three independent experiments. Results are represented as %ID per microgram of total protein. The significance of the value is indicated by asterisks (*), and the comparative reference is the corresponding cell line treated with Oligofectamine alone. ns indicates nonsignificant. *P < .05, **P < .01, ***P < .001.
[3H]Choline Efflux and Retention
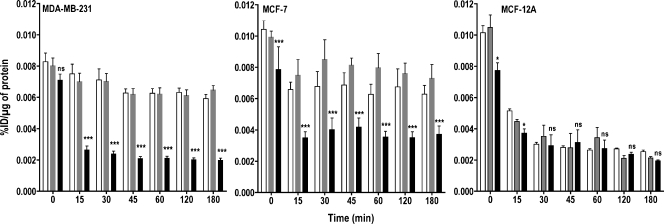
To investigate whether the reduced accumulation of radioactivity observed was due to lack of ChoK-mediated phosphorylation of free choline, we pulsed all of the three cell lines with [3H]choline for 10 minutes. After exchanging the labeled medium with the unlabeled medium, the effluxed radioactivity was collected from the medium at various time points after the pulse. In all three ChoK-downregulated cell lines, the maximum efflux of radioactivity was observed within 15 minutes (Figure 3). After 15 minutes, efflux of radioactivity was either only slightly higher or remained the same as that observed at 15 minutes. Among the three cell lines, the highest efflux of radioactivity was detected in the MCF-12A cell line, which had the lowest ChoK expression levels. The efflux of radioactivity in ChoK-downregulated cell lines was 40% (P < .0001), 58% (P < .0001), and 7% (P = .5701) higher in MDA-MB-231, MCF-7, and MCF-12A cell lines, respectively, at 60 minutes compared with Oligofectamine-treated controls.
Figure 3.
Efflux of [3H]choline chloride depends on ChoK expression levels. MDA-MB-231, MCF-7, and MCF-12A breast cancer cell lines were untreated (clear bar), treated with Oligofectamine alone (gray bar), or transfected with ChoK-specific siRNA (solid black bar). At 48 hours after transfection, cells were pulsed with 0.2 µCi/ml of [3H]choline chloride for 10 minutes. After the replacement of radioactive medium and refreshing with fresh medium, cells were incubated for variable periods. At the specified time, supernatant radioactivity was counted and represented as %ID per microgram of total protein. Results shown are the mean values of experiments performed in triplicate and from three independent experiments. The significance of the value is indicated by asterisks (*), and the comparative reference is the corresponding cell line treated with Oligofectamine alone. ns indicates nonsignificant. *P < .05, **P < .01, ***P < .001.
The radioactivity retained after the efflux experiments (Figure 4) supports the results obtained from the efflux experiments. There was no significant difference in radioactivity retained between Oligofectamine-treated and ChoK-downregulated MCF-12A cells, whereas both cancer cell lines treated with ChoK-siRNA showed less retention of radioactivity than control cells.
Figure 4.
Retention of [3H]choline chloride is ChoK-dependent. MDA-MB-231, MCF-7, and MCF-12A breast cancer cell lines were untreated (clear bar), treated with Oligofectamine alone (gray bar), or transfected with ChoK-specific siRNA (solid black bar). At 48 hours after transfection, cells were pulsed with 0.2 µCi/ml of [3H]choline chloride for 10 minutes. After the replacement of radioactive medium and refreshing with fresh medium, cells were incubated for variable periods. At the specified time, supernatant radioactivity was removed, and the cell-associated radioactivity was counted and represented as %ID per microgram of total protein. Results shown are the mean values of experiments performed in triplicate and from three independent experiments. The significance of the value is indicated by asterisks (*), and the comparative reference is the corresponding cell line treated with Oligofectamine alone. ns indicates nonsignificant. *P < .05, **P < .01, ***P < .001.
[3H]Thymidine Uptake, DNA Incorporation, and S-Phase Analysis
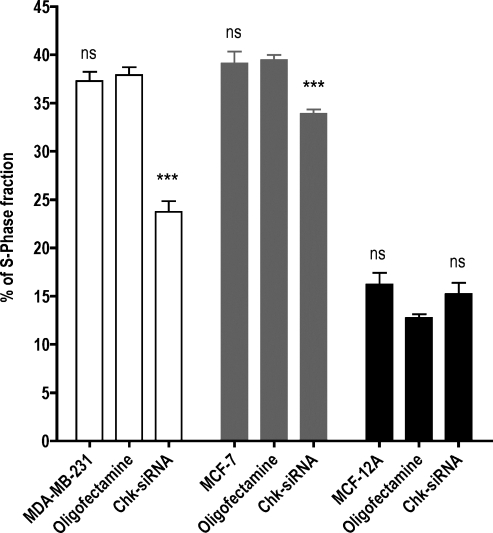
Choline kinase and choline-related metabolites are involved in proliferation [32]. Although the relationship between ChoK and the cell cycle and DNA synthesis is not completely characterized, recent reports suggest that ChoK plays a role in regulating G1 to S transition and thereby proliferation [32,33]. To understand further the role of ChoK in cell proliferation, we used [3H]Tdr, an analog of an imaging agent that reports on proliferation. Both the cancer cell lines showed statistically significant and consistently reduced [3H]Tdr uptake and DNA incorporation (Figures 5 and 6) after treatment with ChoK-siRNA. The changes in [3H]Tdr uptake and DNA incorporation were significant at 60 minutes. In the MCF-12A cell line, although the thymidine uptake was not statistically significant at 60 minutes, a significant change (P < .05) in DNA incorporation was observed. Choline kinase-downregulated MDA-MB-231, MCF-7, and MCF-12A cells showed 62%, 51%, and 44% lower [3H]Tdr uptake than the corresponding Oligofectamine-treated cells at 60 minutes (Figure 5). Similarly at 60 minutes, the percentage of DNA incorporation was reduced by 67% (P < .005), 54% (P < .018), and 32% (P = .013), respectively (Figure 6). To confirm that the [3H]Tdr uptake and DNA incorporation values reflected changes in S-phase fraction, we correlated these results with BrdU incorporation and PI staining for S-phase fraction analysis by flow cytometry. Whereas the cancer cell lines show a significant difference in S-phase fraction after treatment, in the nonmalignant breast epithelial cell line, the difference was not significant (Figure 7).
Figure 5.
Total [3H]Tdr uptake is indicative of reduced proliferation in ChoK-downregulated breast cancer cells. MDA-MB-231, MCF-7, and MCF-12A breast cancer cell lines were untreated (clear bar), treated with Oligofectamine alone (gray bar), or transfected with ChoK-specific siRNA (solid black bar). At 48 hours after transfection, cells were incubated with 0.2 µCi/ml of [3H]Tdr for variable periods. At the specified interval, total [3H]Tdr uptake was measured and represented as %ID per microgram of total protein. Results shown are the mean values of experiments performed in triplicate and from three independent experiments. The significance of the value is indicated by asterisks (*), and the comparative reference is the corresponding cell line treated with Oligofectamine alone. ns indicates nonsignificant. *P < .05, **P < .01, ***P < .001.
Figure 6.
[3H]Thymidine DNA incorporation is reduced in ChoK-downregulated breast cancer cells. MDA-MB-231, MCF-7, and MCF-12A breast cancer cell lines were untreated (clear bar), treated with Oligofectamine alone (gray bar), or transfected with ChoK-specific siRNA (solid black bar). At 48 hours after transfection, cells were incubated with 0.2 µCi/ml of [3H]Tdr for variable periods. At specified intervals, [3H]Tdr incorporation into DNA was assessed using perchloric acid extraction and represented as %ID per microgram of total protein. Results shown are the mean values of experiments performed in triplicate and from three independent experiments. The significance of the value is indicated by asterisks (*), and the comparative reference is the corresponding cell line treated with Oligofectamine alone. ns indicates nonsignificant. *P < .05, **P < .01, ***P < .001.
Figure 7.
Reduced [3H]Tdr is due to the low S-phase fraction in ChoK downregulated breast cancer cells. MDA-MB-231 (clear bar), MCF-7 (gray bar), and MCF-12A (solid black bar) breast cancer cell lines were untreated, treated with Oligofectamine alone, or transfected with ChoK-specific siRNA. At 48 hours after transfection, cells were incubated with BrdU for 45 minutes and analyzed by flow cytometry after S-phase fraction staining with anti-BrdU and DNA staining with PI as indicated in the Materials and Methods section. Results shown are the mean values of single experiment performed in triplicate and from three independent experiments. The significance of the value is indicated by asterisks (*), and the comparative reference is the corresponding cell line treated with Oligofectamine alone. ns indicates nonsignificant. *P < .05, **P < .01, ***P < .001.
[3H]Fluorodeoxyglucose Uptake
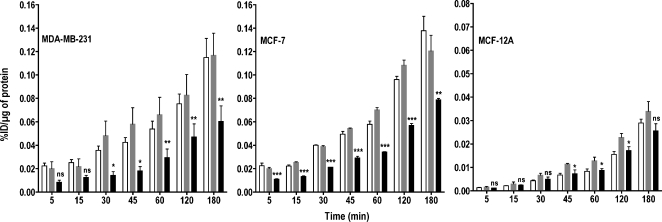
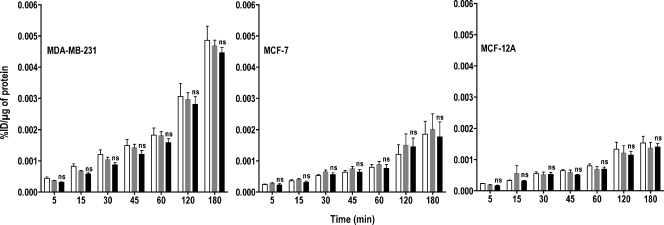
To determine whether FDG-PET could eventually be used as a surrogate marker for ChoK activity, we investigated changes in glucose metabolism using [3H]FDG uptake. The absolute accumulation of [3H]FDG uptake varied with the cell line with malignant cells demonstrating higher accumulation of radioactivity compared with nonmalignant MCF-12A cells (Figure 8). However, there were no significant differences in [3H]FDG uptake between Oligofectamine-treated control and ChoK-downregulated cells in any of the three cell lines.
Figure 8.
Inhibition of ChoK does not effect [3H]FDG uptake in breast cancer cell lines. MDA-MB-231, MCF-7, and MCF-12A breast cancer cell lines were untreated (clear bar), treated with Oligofectamine alone (gray bar), or transfected with ChoK-specific siRNA (solid black bar). At 48 hours after transfection, cells were incubated with 0.2 µCi/ml of [3H]FDG for variable periods. At specified intervals, total [3H]FDG accumulation was assessed and represented as %ID per microgram of total protein. Results shown are the mean values of experiments performed in triplicate and from three independent experiments. The significance of the value is indicated by asterisks (*), and the comparative reference is the corresponding cell line treated with Oligofectamine alone. ns indicates nonsignificant.
Discussion
The purposes of this study were to 1) delineate the role of ChoK in the uptake of radiolabeled choline and retention of radiolabeled choline metabolites, 2) assess the feasibility of monitoring the ChoK-targeted therapies using radiolabeled choline analogs, and 3) assess the feasibility of monitoring the ChoK-targeted therapies using other downstream pharmacodynamic markers. To investigate these hypotheses, we downregulated ChoK using siRNA targeted against both the ChoK-α and ChoK-β isoforms using previously established methods [27,28]. Using Oligofectamine-treated controls and ChoK-downregulated cell lines, we characterized choline uptake and retention in nonmalignant MCF-12A cells and malignant MCF-7 and MDA-MB-231 cells. The accumulated or effluxed radioactivity was normalized to the percentage of incubated dose as well as micrograms of total protein. Because different cell lines may have different total protein concentration, comparisons were made within and not between cell lines after ChoK-siRNA treatment. Our experiments revealed ChoK-dependent uptake and retention of radioactivity in all three cells lines. The uptake of radiolabeled choline in cancer cell lines with high ChoK expression levels was 35% to 40% higher than that in the nonmalignant cell line. This is consistent with the progressively increased levels of PC and total choline-containing compounds detected with MR spectroscopy studies in these cell lines [27]. In addition, down-regulation of ChoK using siRNA technology resulted in low uptake and retention of radiolabeled choline in malignant cells in a time-dependent manner, whereas the uptake and retention in a nonmalignant cell line remained statistically insignificant. Furthermore, the increased efflux of radioactivity observed in ChoK-downregulated cancer cell lines indicates the presence of unphosphorylated free choline. Both the reduced retention and increased efflux of [3H]choline in ChoK-downregulated cancer cell lines clearly underline the importance of ChoK in the phosphorylation and subsequent intracellular retention of radiolabeled choline metabolites. Overall, these data suggest that reduced uptake and retention of radiolabeled choline is due to the downregulated ChoK levels, making it a suitable imaging marker for monitoring ChoK-targeted therapies.
To investigate other pharmacodynamic markers for noninvasive monitoring of ChoK-based therapies, we also investigated [3H]Tdr, a marker for proliferation, and [3H]FDG, a marker for glucose metabolism. Previous studies targeting ChoK inhibition using either siRNA knockdown or pharmacological inhibition resulted in reduced cellular proliferation [25–27,31]. The de novo reduction in PC synthesis due to ChoK inhibition has been attributed to G1- to S-phase arrest [32,33]. To measure proliferation changes as a result of ChoK-targeted therapy, we assessed the uptake and retention of [3H]Tdr. Our in vitro results show a significant reduction in total [3H]Tdr uptake and DNA incorporation in cancer cell lines after ChoK silencing and are in agreement with previous studies [27,31]. The proliferation levels in the nonmalignant MCF-12A cell line were affected but not significantly. These results suggest that monitoring ChoK-targeted treatment using a proliferation-based imaging agent may be possible. Although a radiolabeled version of Tdr would be an ideal radiopharmaceutical for monitoring proliferation, the use of [11C]Tdr is fraught by rapid metabolism in vivo [34]. 3′-Deoxy-3′-[18F]-fluorothymidine ([18F]FLT) is currently being pursued as an alternative to [11C]Tdr [35]. It is taken up in cells, phosphorylated, and trapped by cytosolic Tdr kinase. Cytosolic thymidine kinase (TK1) levels correlate directly with S-phase fraction [36]. Hence, FLT-PET is being used as an imaging-based biomarker for detection and monitoring of early changes in cancer chemotherapy [37,38]. Although [18F]FLT is an accepted marker for cell proliferation, it is not an indicator of DNA synthesis. To monitor the changes in reduced DNA synthesis as a result of ChoK-based therapies, one could use imaging agents that are incorporated into DNA for protracted studies [39,40]. Our results support the use of both TK-based as well as DNA synthesis-based imaging agents for monitoring ChoK-targeted therapies. Although these studies demonstrate feasibility, additional studies are needed to correlate further the proliferation changes induced by ChoK inhibition with proliferation-based imaging agents.
Malignant cells exhibit increased use of glucose, and many cancers are known to overexpress glucose transporters, including glucose transporter 1 and hexokinase, which allow rapid use of glucose [41,42]. The use of [18F]FDG in cancer imaging is based on increased glucose metabolism in tumors [43,44]. [18F]Fluorodeoxyglucose is by far the most commonly used radiopharmaceutical for the diagnosis, detection, and therapeutic management of cancer [45]. Previously, attempts were made to correlate FDG metabolism with phospholipid synthesis [46,47]. However, there are no current reports on the effect of ChoK down-regulation on glucose metabolism in cancer cells. Herein, we observed increased [3H]FDG uptake in both cancer cell lines compared with the nonmalignant MCF-12A cell line. However, no significant changes in glucose metabolism, using [3H]FDG could be detected either in malignant or nonmalignant cell lines between ChoK-downregulated and control cells. These results suggest that glucose metabolism may not be a suitable option for noninvasive monitoring of ChoK-based therapies.
In conclusion, our study demonstrates that radiolabeled choline or choline analogs can be used to detect the effects of ChoK-targeted therapy. Other pharmacodynamic markers such as proliferation imaging with [11C]Tdr or [18F]FLT may provide alternatives for repetitive and noninvasive monitoring of ChoK inhibition. In addition, other routinely used metabolic imaging agents such as [18F]FDG may not be useful to detect the early changes of ChoK-based therapies.
Acknowledgments
The authors thank Tomoyo Takagi, Tiffany R. Greenwood, Mrudula Pullambhatla, Noriko Mori, Mahendran Botlagunta, and Paula Hurley for expert technical assistance and helpful discussions.
Footnotes
This work was partially supported by grants from the National Cancer grant numbers U24 CA092871 (SAIRP to M.G.P.) and 1P50CA103175 (ICMIC to Z.M.B.) and a pilot grant from Education and Research Foundation of the SNM to S.N.
References
- 1.Katz-Brull R, Lavin PT, Lenkinski RE. Clinical utility of proton magnetic resonance spectroscopy in characterizing breast lesions. J Natl Cancer Inst. 2002;94:1197–1203. doi: 10.1093/jnci/94.16.1197. [DOI] [PubMed] [Google Scholar]
- 2.Negendank W. Studies of human tumors by MRS: a review. NMR Biomed. 1992;5:303–324. doi: 10.1002/nbm.1940050518. [DOI] [PubMed] [Google Scholar]
- 3.Kurhanewicz J, Vigneron DB, Hricak H, Parivar F, Nelson SJ, Shinohara K, Carroll PR. Prostate cancer: metabolic response to cryosurgery as detected with 3D H-1 MR spectroscopic imaging. Radiology. 1996;200:489–496. doi: 10.1148/radiology.200.2.8685346. [DOI] [PubMed] [Google Scholar]
- 4.Bezabeh T, Smith IC, Krupnik E, Somorjai RL, Kitchen DG, Bernstein CN, Pettigrew NM, Bird RP, Lewin KJ, Briere KM. Diagnostic potential for cancer via 1H magnetic resonance spectroscopy of colon tissue. Anticancer Res. 1996;16:1553–1558. [PubMed] [Google Scholar]
- 5.Nelson SJ. Analysis of volume MRI and MR spectroscopic imaging data for the evaluation of patients with brain tumors. Magn Reson Med. 2001;46:228–239. doi: 10.1002/mrm.1183. [DOI] [PubMed] [Google Scholar]
- 6.Ruiz-Cabello J, Cohen JS. Phospholipid metabolites as indicators of cancer cell function. NMR Biomed. 1992;5:226–233. doi: 10.1002/nbm.1940050506. [DOI] [PubMed] [Google Scholar]
- 7.Ting YL, Sherr D, Degani H. Variations in energy and phospholipid metabolism in normal and cancer human mammary epithelial cells. Anticancer Res. 1996;16:1381–1388. [PubMed] [Google Scholar]
- 8.Bolan PJ, DelaBarre L, Baker EH, Merkle H, Everson LI, Yee D, Garwood M. Eliminating spurious lipid sidebands in 1H MRS of breast lesions. Magn Reson Med. 2002;48:215–222. doi: 10.1002/mrm.10224. [DOI] [PubMed] [Google Scholar]
- 9.Aboagye EO, Bhujwalla ZM. Malignant transformation alters membrane choline phospholipid metabolism of human mammary epithelial cells. Cancer Res. 1999;59:80–84. [PubMed] [Google Scholar]
- 10.Jagannathan NR, Kumar M, Seenu V, Coshic O, Dwivedi SN, Julka PK, Srivastava A, Rath GK. Evaluation of total choline from in-vivo volume localized proton MR spectroscopy and its response to neoadjuvant chemotherapy in locally advanced breast cancer. Br J Cancer. 2001;84:1016–1022. doi: 10.1054/bjoc.2000.1711. [DOI] [PMC free article] [PubMed] [Google Scholar]
- 11.Glunde K, Jie C, Bhujwalla ZM. Molecular causes of the aberrant choline phospholipid metabolism in breast cancer. Cancer Res. 2004;64:4270–4276. doi: 10.1158/0008-5472.CAN-03-3829. [DOI] [PubMed] [Google Scholar]
- 12.Podo F, Ferretti A, Knijn A, Zhang P, Ramoni C, Barletta B, Pini C, Baccarini S, Pulciani S. Detection of phosphatidylcholine-specific phospholipase C in NIH-3T3 fibroblasts and their H-ras transformants: NMR and immunochemical studies. Anticancer Res. 1996;16:1399–1412. [PubMed] [Google Scholar]
- 13.Eliyahu G, Kreizman T, Degani H. Phosphocholine as a biomarker of breast cancer: molecular and biochemical studies. Int J Cancer. 2007;120:1721–1730. doi: 10.1002/ijc.22293. [DOI] [PubMed] [Google Scholar]
- 14.Kent C. Regulatory enzymes of phosphatidylcholine biosynthesis: a personal perspective. Biochim Biophys Acta. 2005;1733:53–66. doi: 10.1016/j.bbalip.2004.12.008. [DOI] [PubMed] [Google Scholar]
- 15.Li Z, Vance DE. Phosphatidylcholine and choline homeostasis. J Lipid Res. 2008;49:1187–1194. doi: 10.1194/jlr.R700019-JLR200. [DOI] [PubMed] [Google Scholar]
- 16.Ramirez de Molina A, Gutierrez R, Ramos MA, Silva JM, Silva J, Bonilla F, Sanchez JJ, Lacal JC. Increased choline kinase activity in human breast carcinomas: clinical evidence for a potential novel antitumor strategy. Oncogene. 2002;21:4317–4322. doi: 10.1038/sj.onc.1205556. [DOI] [PubMed] [Google Scholar]
- 17.Warden CH, Friedkin M. Regulation of choline kinase activity and phosphatidylcholine biosynthesis by mitogenic growth factors in 3T3 fibroblasts. J Biol Chem. 1985;260:6006–6011. [PubMed] [Google Scholar]
- 18.Conejo-Garcia A, Banez-Coronel M, Sanchez-Martin RM, Rodriguez-Gonzalez A, Ramos A, Ramirez de Molina A, Espinosa A, Gallo MA, Campos JM, Lacal JC. Influence of the linker in bispyridium compounds on the inhibition of human choline kinase. J Med Chem. 2004;47:5433–5440. doi: 10.1021/jm0496537. [DOI] [PubMed] [Google Scholar]
- 19.Ramirez de Molina A, Rodriguez-Gonzalez A, Lacal JC. From Ras signalling to ChoK inhibitors: a further advance in anticancer drug design. Cancer Lett. 2004;206:137–148. doi: 10.1016/j.canlet.2003.08.031. [DOI] [PubMed] [Google Scholar]
- 20.Ramirez de Molina A, Rodriguez-Gonzalez A, Gutierrez R, Martinez-Pineiro L, Sanchez J, Bonilla F, Rosell R, Lacal J. Overexpression of choline kinase is a frequent feature in human tumor-derived cell lines and in lung, prostate, and colorectal human cancers. Biochem Biophys Res Commun. 2002;296:580–583. doi: 10.1016/s0006-291x(02)00920-8. [DOI] [PubMed] [Google Scholar]
- 21.Nakagami K, Uchida T, Ohwada S, Koibuchi Y, Suda Y, Sekine T, Morishita Y. Increased choline kinase activity and elevated phosphocholine levels in human colon cancer. Jpn J Cancer Res. 1999;90:419–424. doi: 10.1111/j.1349-7006.1999.tb00764.x. [DOI] [PMC free article] [PubMed] [Google Scholar]
- 22.Ramirez de Molina A, Penalva V, Lucas L, Lacal JC. Regulation of choline kinase activity by Ras proteins involves Ral-GDS and PI3K. Oncogene. 2002;21:937–946. doi: 10.1038/sj.onc.1205144. [DOI] [PubMed] [Google Scholar]
- 23.Aoyama C, Liao H, Ishidate K. Structure and function of choline kinase isoforms in mammalian cells. Prog Lipid Res. 2004;43:266–281. doi: 10.1016/j.plipres.2003.12.001. [DOI] [PubMed] [Google Scholar]
- 24.Ramirez de Molina A, Sarmentero-Estrada J, Belda-Iniesta C, Taron M, Ramirez de Molina V, Cejas P, Skrzypski M, Gallego-Ortega D, de Castro J, Casado E, et al. Expression of choline kinase alpha to predict outcome in patients with early-stage non-small-cell lung cancer: a retrospective study. Lancet Oncol. 2007;8:889–897. doi: 10.1016/S1470-2045(07)70279-6. [DOI] [PubMed] [Google Scholar]
- 25.Hernandez-Alcoceba R, Saniger L, Campos J, Nunez MC, Khaless F, Gallo MA, Espinosa A, Lacal JC. Choline kinase inhibitors as a novel approach for antiproliferative drug design. Oncogene. 1997;15:2289–2301. doi: 10.1038/sj.onc.1201414. [DOI] [PubMed] [Google Scholar]
- 26.Hernandez-Alcoceba R, Fernandez F, Lacal JC. In vivo antitumor activity of choline kinase inhibitors: a novel target for anticancer drug discovery. Cancer Res. 1999;59:3112–3118. [PubMed] [Google Scholar]
- 27.Glunde K, Raman V, Mori N, Bhujwalla ZM. RNA interference-mediated choline kinase suppression in breast cancer cells induces differentiation and reduces proliferation. Cancer Res. 2005;65:11034–11043. doi: 10.1158/0008-5472.CAN-05-1807. [DOI] [PubMed] [Google Scholar]
- 28.Mori N, Glunde K, Takagi T, Raman V, Bhujwalla ZM. Choline kinase down-regulation increases the effect of 5 fluorouracil in breast cancer cells. Cancer Res. 2007;67:11284–11290. doi: 10.1158/0008-5472.CAN-07-2728. [DOI] [PubMed] [Google Scholar]
- 29.Chen JH, Feig B, Agrawal G, Yu H, Carpenter PM, Mehta RS, Nalcioglu O, Su MY. MRI evaluation of pathologically complete response and residual tumors in breast cancer after neoadjuvant chemotherapy. Cancer. 2008;112:17–26. doi: 10.1002/cncr.23130. [DOI] [PubMed] [Google Scholar]
- 30.Tozaki M, Sakamoto M, Oyama Y, O'Uchi T, Kawano N, Suzuki T, Yamashiro N, Ozaki S, Sakamoto N, Higa K, et al. Monitoring of early response to neoadjuvant chemotherapy in breast cancer with (1)H MR spectroscopy: comparison to sequential 2-[18F]-fluorodeoxyglucose positron emission tomography. J Magn Reson Imaging. 2008;28:420–427. doi: 10.1002/jmri.21454. [DOI] [PubMed] [Google Scholar]
- 31.Al-Saffar NM, Troy H, Ramirez de Molina A, Jackson LE, Madhu B, Griffiths JR, Leach MO, Workman P, Lacal JC, Judson IR, et al. Noninvasive magnetic resonance spectroscopic pharmacodynamic markers of the choline kinase inhibitor MN58b in human carcinoma models. Cancer Res. 2006;66:427–434. doi: 10.1158/0008-5472.CAN-05-1338. [DOI] [PubMed] [Google Scholar]
- 32.Ramirez de Molina A, Gallego-Ortega D, Sarmentero-Estrada J, Lagares D, Gomez Del Pulgar T, Bandres E, Garcia-Foncillas J, Lacal JC. Choline kinase as a link connecting phospholipid metabolism and cell cycle regulation: Implications in cancer therapy. Int J Biochem Cell Biol. 2008;40:1753–1763. doi: 10.1016/j.biocel.2008.01.013. [DOI] [PubMed] [Google Scholar]
- 33.de Molina AR, Banez-Coronel M, Gutierrez R, Rodriguez-Gonzalez A, Olmeda D, Megias D, Lacal JC. Choline kinase activation is a critical requirement for the proliferation of primary human mammary epithelial cells and breast tumor progression. Cancer Res. 2004;64:6732–6739. doi: 10.1158/0008-5472.CAN-04-0489. [DOI] [PubMed] [Google Scholar]
- 34.Mankoff DA, Shields AF, Link JM, Graham MM, Muzi M, Peterson LM, Eary JF, Krohn KA. Kinetic analysis of 2-[11C]thymidine PET imaging studies: validation studies. J Nucl Med. 1999;40:614–624. [PubMed] [Google Scholar]
- 35.Shields AF, Grierson JR, Dohmen BM, Machulla HJ, Stayanoff JC, Lawhorn-Crews JM, Obradovich JE, Muzik O, Mangner TJ. Imaging proliferation in vivo with [F-18]FLT and positron emission tomography. Nat Med. 1998;4:1334–1336. doi: 10.1038/3337. [DOI] [PubMed] [Google Scholar]
- 36.Sherley JL, Kelly TJ. Regulation of human thymidine kinase during the cell cycle. J Biol Chem. 1988;263:8350–8358. [PubMed] [Google Scholar]
- 37.Kenny L, Coombes RC, Vigushin DM, Al-Nahhas A, Shousha S, Aboagye EO. Imaging early changes in proliferation at 1 week post chemotherapy: a pilot study in breast cancer patients with 3′-deoxy-3′-[(18)F]fluorothymidine positron emission tomography. Eur J Nucl Med Mol Imaging. 2007;34:1339–1347. doi: 10.1007/s00259-007-0379-4. [DOI] [PubMed] [Google Scholar]
- 38.Smyczek-Gargya B, Fersis N, Dittmann H, Vogel U, Reischl G, Machulla HJ, Wallwiener D, Bares R, Dohmen BM. PET with [18F]fluorothymidine for imaging of primary breast cancer: a pilot study. Eur J Nucl Med Mol Imaging. 2004;31:720–724. doi: 10.1007/s00259-004-1462-8. [DOI] [PubMed] [Google Scholar]
- 39.Nimmagadda S, Mangner TJ, Sun H, Klecker RW, Jr, Muzik O, Lawhorn-Crews JM, Douglas KA, Collins JM, Shields AF. Biodistribution and radiation dosimetry estimates of 1-(2′-deoxy-2′-18F-fluoro-1-{beta}-d-arabinofuranosyl)-5-bromouracil: PET imaging studies in dogs. J Nucl Med. 2005;46:1916–1922. [PubMed] [Google Scholar]
- 40.Sun H, Sloan A, Mangner TJ, Vaishampayan U, Muzik O, Collins JM, Douglas K, Shields AF. Imaging DNA synthesis with [(18)F]FMAU and positron emission tomography in patients with cancer. Eur J Nucl Med Mol Imaging. 2005;32:15–22. doi: 10.1007/s00259-004-1713-8. [DOI] [PubMed] [Google Scholar]
- 41.Hara T, Kosaka N, Kishi H. PET imaging of prostate cancer using carbon-11-choline. J Nucl Med. 1998;39:990–995. [PubMed] [Google Scholar]
- 42.Hara T, Kosaka N, Shinoura N, Kondo T. PET imaging of brain tumor with [methyl-11C]choline. J Nucl Med. 1997;38:842–847. [PubMed] [Google Scholar]
- 43.Som P, Atkins HL, Bandoypadhyay D, Fowler JS, MacGregor RR, Matsui K, Oster ZH, Sacker DF, Shiue CY, Turner H, et al. A fluorinated glucose analog, 2-fluoro-2-deoxy-d-glucose (F-18): nontoxic tracer for rapid tumor detection. J Nucl Med. 1980;21:670–675. [PubMed] [Google Scholar]
- 44.Warburg O. The Metabolism of Tumors. New York, NY: Richard R. Smith, Inc; 1931. pp. 1–129. [Google Scholar]
- 45.Gambhir SS, Czernin J, Schwimmer J, Silverman DH, Coleman RE, Phelps ME. A tabulated summary of the FDG PET literature. J Nucl Med. 2001;42:1S–93S. [PubMed] [Google Scholar]
- 46.Khan N, Oriuchi N, Ninomiya H, Higuchi T, Kamada H, Endo K. Positron emission tomographic imaging with 11C-choline in differential diagnosis of head and neck tumors: comparison with 18F-FDG PET. Ann Nucl Med. 2004;18:409–417. doi: 10.1007/BF02984484. [DOI] [PubMed] [Google Scholar]
- 47.Guo J, Higashi K, Yokota H, Nagao Y, Ueda Y, Kodama Y, Oguchi M, Taki S, Tonami H, Yamamoto I. In vitro proton magnetic resonance spectroscopic lactate and choline measurements, 18F-FDG uptake, and prognosis in patients with lung adenocarcinoma. J Nucl Med. 2004;45:1334–1339. [PubMed] [Google Scholar]


