Abstract
It is well established that leptin increases the sensitivity of carbohydrate metabolism to the effects of insulin. Leptin and insulin also have potent effects on lipid metabolism. However, the effects of leptin on the regulation of liver lipid metabolism by insulin have not been investigated. The current study addressed the effects of leptin on insulin-regulated hepatic very low-density lipoprotein (VLDL) metabolism in vivo in rats. A 90-min hyperinsulinemic/euglycemic clamp (4 mU/kg · min−1) reduced plasma VLDL triglyceride (TG) by about 50% (P < 0.001 vs. saline control). Importantly, a leptin infusion (0.2 μg/kg · min−1) in combination with insulin reduced plasma VLDL-TG by about 80% (P < 0.001 vs. insulin alone). These effects did not require altered skeletal muscle lipoprotein lipase activity but did include differential effects of insulin and leptin on liver apolipoprotein (apo) B and TG metabolism. Thus, insulin decreased liver and plasma apoB100/B48 levels (∼50%, P < 0.01), increased liver TGs (∼20%, P < 0.05), and had no effect on fatty acid oxidation. Conversely, leptin decreased liver TGs (∼50%, P < 0.01) and increased fatty acid oxidation (∼50%, P < 0.01) but had no effects on liver or plasma apoB levels. Importantly, the TG-depleting and prooxidative effects of leptin were maintained in the presence of insulin. We conclude that leptin additively increases the suppressive effects of insulin on hepatic and systemic VLDL metabolism by stimulating depletion of liver TGs and increasing oxidative metabolism. The net effect of the combined actions of insulin and leptin is to decrease the production and TG content of VLDL particles.
Leptin additively increases the suppressive effects of insulin on hepatic and systemic VLDL metabolism by stimulating depletion of liver triglycerides and increasing oxidative metabolism.
The regulation of liver very low density lipoprotein (VLDL) metabolism by insulin during the fasted to fed transition is accomplished predominantly through suppression of VLDL production and secretion and possibly inhibition of adipose tissue lipolysis, thus reducing plasma fatty acid delivery to the liver. The net effect of these actions is to decrease systemic VLDL-triglyceride (TG) levels. Insulin effects on VLDL production in liver are mediated by the stimulation of apolipoprotein B (apoB) degradation (1,2,3,4), an effect that results in a decrease in VLDL secretion. Recently we demonstrated that similar to insulin, the adipocyte-derived hormone leptin rapidly lowers plasma VLDL-associated TGs (5,6). The effects of leptin are mediated by the stimulation of liver oxidative metabolism, an effect involving inactivation of acetyl CoA carboxylase (ACC), which results in a depletion of the liver TG pool available for incorporation into VLDL particles (5,7). Together these studies suggest that insulin and leptin may act in concert to regulate hepatic lipid metabolism. However, although a number of studies have investigated the combined effects of leptin and insulin on the regulation of carbohydrate metabolism (8,9,10,11,12,13), there is nothing known of the interactions between leptin and insulin action on lipid metabolism. The primary goal of the current study was to address this issue. Our data demonstrate that: 1) leptin increases the suppressive effects of insulin on hepatic and systemic VLDL metabolism; 2) the mechanism of these effects involves complementary, but distinct, effects of insulin and leptin on apolipoprotein levels and oxidative metabolism, respectively, and 3) the TG-depleting and oxidative effects of leptin on lipid metabolism are maintained in the presence of insulin.
Materials and Methods
Animal care and maintenance
Male Wister rats were purchased from Charles River (Madison, WI). After arrival, rats were maintained on a constant 12-h light, 12-h dark cycle with free access to water and ad libitum fed with a standard chow diet and allowed to acclimate for at least a week. All procedures were approved by the Institutional Animal Care and Use Committee of the University of Pittsburgh, and were in accordance with the National Research Council’s Guide for the Care and Use of Laboratory Animals.
Implantation of chronic indwelling catheters
Animals were anesthetized with a ketamine-xylazine-acepromazine mix (60 mg/kg ketamine, 5 mg/kg xylazine, 1 mg/kg acepromazine). Catheters (PE-50, Intramedic; Becton Dickinson, Sparks, MD) were introduced into the left carotid artery (advanced to the aortic arch) and the right jugular vein (advanced to the right atrium) as previously described (14). The catheters were exteriorized at the back of the neck, filled with a sterile 3:1 glycerol-heparin mix and flame sealed. The wounds were closed with sutures and treated with Betadine. The animals were treated with ketoprofen (2 mg/kg) sc, and their recovery was monitored with special attention given to food intake, weight gain, and healing of wounds. Animals were allowed at least 4 d to recover, and only those that had achieved more than 90% of presurgery weights were used in studies.
Experimental design
For most experiments, four groups of animals were studied: 1) saline-infused; 2) insulin infused; 3) leptin infused; and 4) insulin and leptin infused. For leptin infusions, conscious 18-h fasted rats received a continuous iv infusion of either vehicle (saline) or recombinant leptin (R&D Systems, Inc., Minneapolis, MN) using a syringe pump (model 11; Harvard Apparatus, Holliston, MA) at a rate of 0.2 μg/kg · min−1 for 120 min (preceded by a 2 min priming dose of 2 μg/kg · min−1), as previously described (5,6). Volume delivery was 5 ml/kg · h−1 for both vehicle and leptin infusions. After the 120-min infusion of either saline or leptin, the animals continued receiving the respective infusions for another 90 min in the presence or absence of a 90-min hyperinsulinemia-euglycemic clamps (see below). Blood samples (∼600 μl) were taken before infusions and at 120 and 210 min for plasma parameters measurements. Hyperinsulinemia-euglycemic clamps were performed as previously described (14). Briefly, a venous infusion of recombinant human insulin (Humulin; Eli Lilly and Co., Indianapolis, IN) at 4 mU/kg · min−1 commenced in conjunction with a variable glucose (50%) infusion to maintain euglycemia (∼120 mg/dl). This rate of insulin infusion achieved a circulating insulin concentration that was within the physiological range and similar to the plasma insulin concentration in the fed state (Table 1). Arterial blood samples (∼30 μl) were taken every 10 min for plasma glucose measurements to determine the exogenous glucose infusion rate (GIR) necessary to maintain euglycemia. For studies requiring the measurement of VLDL-TG secretion by the liver, 300 mg/kg of the lipoprotein lipase inhibitor tyloxapol (Triton WR 1339; Sigma-Aldrich Corp., St. Louis, MO) was injected into the arterial line after infusions of leptin or insulin, with continued infusions of leptin or insulin for another 60 min, as described previously (5). Immediately before and 60 min after the tyloxapol injections, intraarterial blood samples were taken. At the end of all experiments, the rats were anesthetized, blood samples taken, liver and skeletal muscle promptly removed, snap frozen in liquid nitrogen, and stored at −80 C until analysis.
Table 1.
Body weight, metabolic variables, and GIR for euglycemic hyperinsulinemic clamp experiments
| Saline | Leptin | Insulin | Leptin/insulin | |
|---|---|---|---|---|
| Body weight, g | 281 ± 5 | 286 ± 5 | 278 ± 7 | 277 ± 6 |
| Glucose, mg/dl | ||||
| Basal | 114 ± 5 | 126 ± 6 | 93 ± 9 | 93 ± 8 |
| After clamp | NA | NA | 122 ± 6 | 115 ± 6 |
| Leptin, ng/ml | ||||
| Basal | 0.5 ± 0.1 | 14.0 ± 1.2a | 0.6 ± 0.02 | 14.3 ± 1.5a,b |
| After clamp | NA | NA | 0.8 ± 0.07 | 15.0 ± 1.6b |
| Insulin, ng/ml | ||||
| Basal | 1.3 ± 0.4 | 1.1 ± 0.3 | 1.0 ± 0.5 | 1.3 ± 0.6 |
| After clamp | NA | NA | 4.4 ± 4c | 4.3 ± 0.7c |
| FFA, mm | ||||
| Basal | 0.86 ± 0.06 | 0.91 ± 0.09 | 0.53 ± 0.03 | 0.66 ± 0.06 |
| After clamp | NA | NA | 0.19 ± 0.04c | 0.20 ± 0.03c |
| GIR, mg/kg · min−1 | NA | NA | 17.6 ± 1.0 | 23.4 ± 1.3b |
Values are means ± se; n = minimum six animals/group. GIR calculated over the 30 min of the glucose clamp. NA, Not applicable.
Significantly different from saline.
Significantly different from insulin.
Significantly different from preclamp value.
Tissue and plasma measurements
Tissue and plasma triglycerides were determined as described previously (5,9). Briefly, about 50 mg of frozen liver was extracted in 1 ml of a chloroform-methanol mix (2:1). After redissolving the lipid pellet in 60 μl of tert-butanol and 40 μl of a Triton X-114-methanol (2:1) mix, the extracted liver triglycerides were measured spectrophotometrically (DU 530; Beckman Coulter, Fullerton, CA) using the glycerol phosphate oxidase-TG kit and Lintrol lipids as standard (Sigma-Aldrich). Plasma triglycerides were measured in a similar fashion. In preliminary experiments we determined that more than 95% of plasma triglycerides were associated with VLDL particles, as expected (data not shown). ApoB containing lipoproteins (VLDL) in plasma were isolated by density gradient ultracentrifugation of plasma samples (500 μl plasma were adjusted to 1000 μl with a 0.9% NaCl solution, d = 1.006 g/ml) at 90,000 rpm (436,000 × g) for 2.5 h at 16 C in a Sorvall M120 GX centrifuge (rotor S100; Kendro Laboratory Products, Newtown, CT). The upper fraction (500 μl), containing VLDL (d < 1.006 g/ml), was collected by glass pipette and then immediately diluted 1:5 with saline and subsequently boiled after mixing with 4% sodium dodecyl sulfate sample buffer. An equivalent of 5 μl of the diluted VLDL fraction was resolved by SDS-PAGE using a 5% gel, and apoB-100 and apoB-48 were assessed by standard immunoblotting techniques using an antibody kindly provided by Dr. Roger A. Davis (15).
For measurements of apoBs in liver, protein extracts were prepared using a standard protein extraction buffer and 10 μg protein was assayed for apoB content using the same immunoblotting approach as above. For the measurement of skeletal muscle total extractable lipoprotein lipase (LPL) activity (16,17,18), which includes the activity of LPL within and outside cells, frozen skeletal muscle (mixed gastrocnemius and soleus) samples were homogenized [1:3 (wt/vol)] in ice-cold buffer (pH 8.2) containing 25 mmol/liter NH3, 5 mmol/liter EDTA, 1% Triton X-100, 0.1% sodium dodecyl sulfate, 25 IU heparin/ml, protease inhibitors (Complete Mini, 1836153; Roche, Indianapolis, IN) and centrifuged at 10,000 × g for 10 min at 4 C. Triplicate 5 μl of supernatant and 95 μl of Krebs-Ringer-phosphate buffer were incubated with 100 μl of substrate prepared by sonication of 10 μCi of 1-14C-glycerol triolein, 50 mg unlabeled triolein, and 6 mg lecithin in 8 ml of 0.233 m Tris buffer (pH 8.2) containing 7% free fatty acid (FFA)-free BSA and 400 μl fasting monkey serum (source of apolipoprotein CII). The enzyme reaction was stopped after 45 min at 37 C by addition of Belfrage’s extraction mixture to separate labeled FFAs from unreacted substrate. The labeled FFAs were quantitated by liquid scintillation counting and, after correction for recovery during extraction, LPL activity was expressed as micromoles FFAs produced per minute per gram tissue weight. FFA oxidation and ACC phosphorylation were measured as previously described (5). Plasma FFA concentrations were determined spectrophotometrically (NEFA-C kit; Waco, Richmond, VA, respectively). In clamp studies, glucose concentrations were determined using a Glucose Analyzer II (Beckman, Palo Alto, CA). Insulin and leptin were measured using commercial RIA kits.
Statistical methods
All results are expressed as mean ± se. Statistical significance was determined by one-way ANOVA and Bonferroni post hoc tests where appropriate using the Systat statistical program (Evanston, IL). Statistical significance was assumed at P < 0.05.
Results
Physiological variables during leptin and hyperinsulinemia-euglycemic clamps
There were no significant differences in body weight, plasma glucose, FFA, or insulin concentrations between any of the four groups examined (Table 1). The leptin concentration achieved during infusions was in a range that is approximately 2-fold greater then that found in the fed state of a rat of similar age and weight (data not shown). At the end of a 90-min glucose clamp, plasma insulin was elevated approximately 4-fold over the fasted basal concentration and was comparable with the range of the plasma insulin concentration during the fed state. Plasma glucose was clamped in the range between the fasted and fed states (Table 1) in both leptin and saline groups. The circulating FFA concentration was suppressed by insulin to the same extent in the insulin and insulin/leptin groups. Notably however, an infusion of leptin increased the exogenous GIR required to maintain euglycemia (Table 1).
Insulin and leptin additively decrease plasma VLDL-TGs
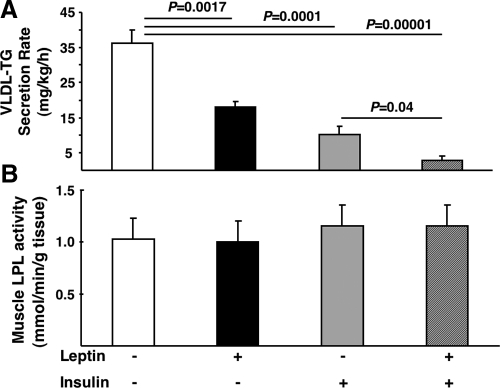
Both insulin (1,3,19,20,21) and leptin (5,6) acutely lower systemic TG levels. However, the combined effects of these two hormones are unknown. Thus, we first evaluated the effects of insulin and leptin alone and in combination on plasma VLDL-TG concentrations. Ninety minutes of physiological hyperinsulinemia (Table 1) under euglycemic conditions were sufficient to decrease plasma VLDL-TG by 61 ± 9% compared with a saline infused control (Fig. 1). When a leptin infusion (Table 1) was concurrently administered with insulin the plasma VLDL-TG concentration decreased by 87 ± 7%, whereas a leptin infusion alone decreased VLDL-TG by 32 ± 7% compared with saline controls (Fig. 1), as previously reported (5). The effects of insulin and leptin could be explained by alterations in liver VLDL metabolism and/or secretion because in the presence of the LPL inhibitor toloxapol, the appearance of TG in plasma was reduced by both insulin or leptin (Fig. 2A) and muscle LPL activity was unchanged by insulin or leptin (Fig. 2B).
Figure 1.
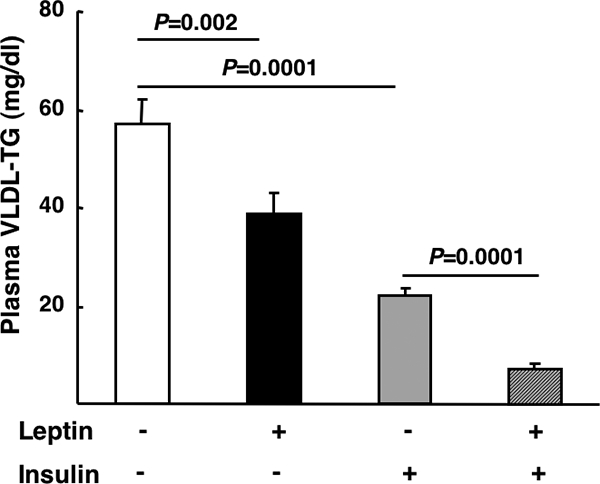
The effects of insulin and leptin on plasma VLDL-TGs. Fasted (18 h) rats fed a standard chow diet received a continuous iv infusion of either vehicle, leptin, insulin, or combined leptin and insulin as described in Materials and Methods. Subsequently blood was taken and TGs were measured as described in Materials and Methods (n = minimum of six animals/group). Results are presented as mean ± se. Significant differences are indicated.
Figure 2.
The effects of insulin and leptin on liver VLDL secretion and skeletal muscle lipoprotein lipase activity. A, Fasted (18 h) rats fed a standard chow diet received an injection of the LPL inhibitor toloxapol and a continuous iv infusion of vehicle, insulin, or leptin as described in Materials and Methods. Blood samples were obtained before the beginning of infusions and after the completion of infusions. Subsequently plasma VLDL-TG was measured as described in Materials and Methods. B, Fasted (18 h) rats fed a standard chow diet received a continuous iv infusion of vehicle, insulin, or leptin as described in Materials and Methods. Subsequently skeletal muscle was isolated and LPL activity was measured as described in Materials and Methods (n = minimum of six animals/group). Results are presented as mean ± se. Significant differences are indicated.
Insulin decreases plasma and liver apoB-48 and apoB-100, an effect that is not augmented by leptin
Insulin has well-described suppressive effects on the production of apoBs in the liver, an effect that lowers hepatic VLDL secretion. Therefore, we next determined whether leptin alters insulin regulation of hepatic apoB metabolism. As expected, insulin lowered both systemic (57 ± 17%, P = 0.001 vs. saline control) and liver (30 ± 2%, P = 0.003 vs. saline control) apoB-48, and systemic (44 ± 10%, P = 0.001 vs. saline control) and liver (40 ± 3%, P = 0.005 vs. saline control) apoB-100 levels (Figs. 3A and 4A). Leptin in combination with insulin (Figs. 3B and 4B) did not augment the effects of insulin, whereas leptin alone had no effect on either liver or plasma apoB levels (Figs. 3C and 4C).
Figure 3.
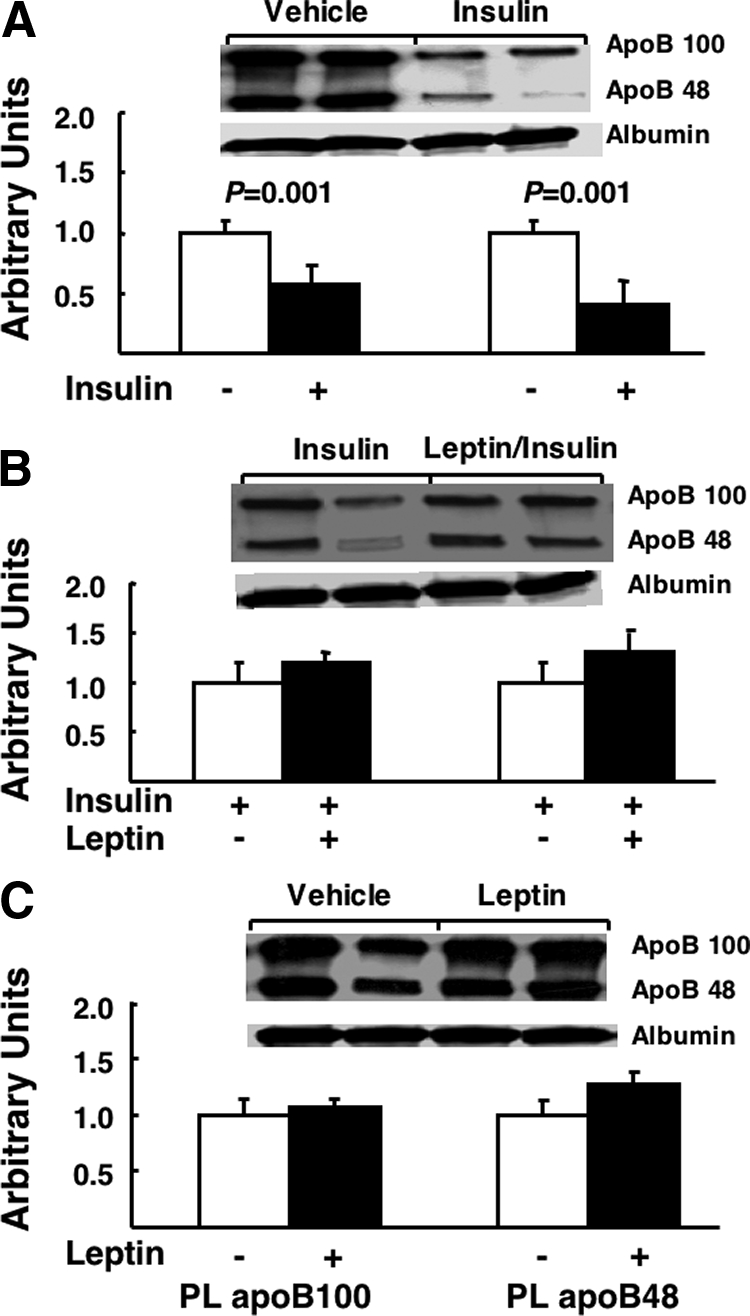
The effects of insulin and leptin on plasma apoB-100 and apoB-48. Fasted (18 h) rats fed a standard chow diet received a continuous iv infusion of vehicle, insulin, leptin, or combined leptin and insulin as described in Materials and Methods. Subsequently blood was taken, VLDL was isolated, and apoB-100 and apoB-48 were measured by immunoblot as described in Materials and Methods. Autoradiograph composites from each experimental condition for apoB-100 and apoB-48 and albumin are presented and the quantification of the total data for each condition is presented below each autoradiograph (n = minimum of six animals/group). Results are presented as mean ± se. Significant differences are indicated. A, Vehicle vs. insulin; B, insulin vs. leptin/insulin; C, vehicle vs. leptin. PL, Plasma.
Figure 4.
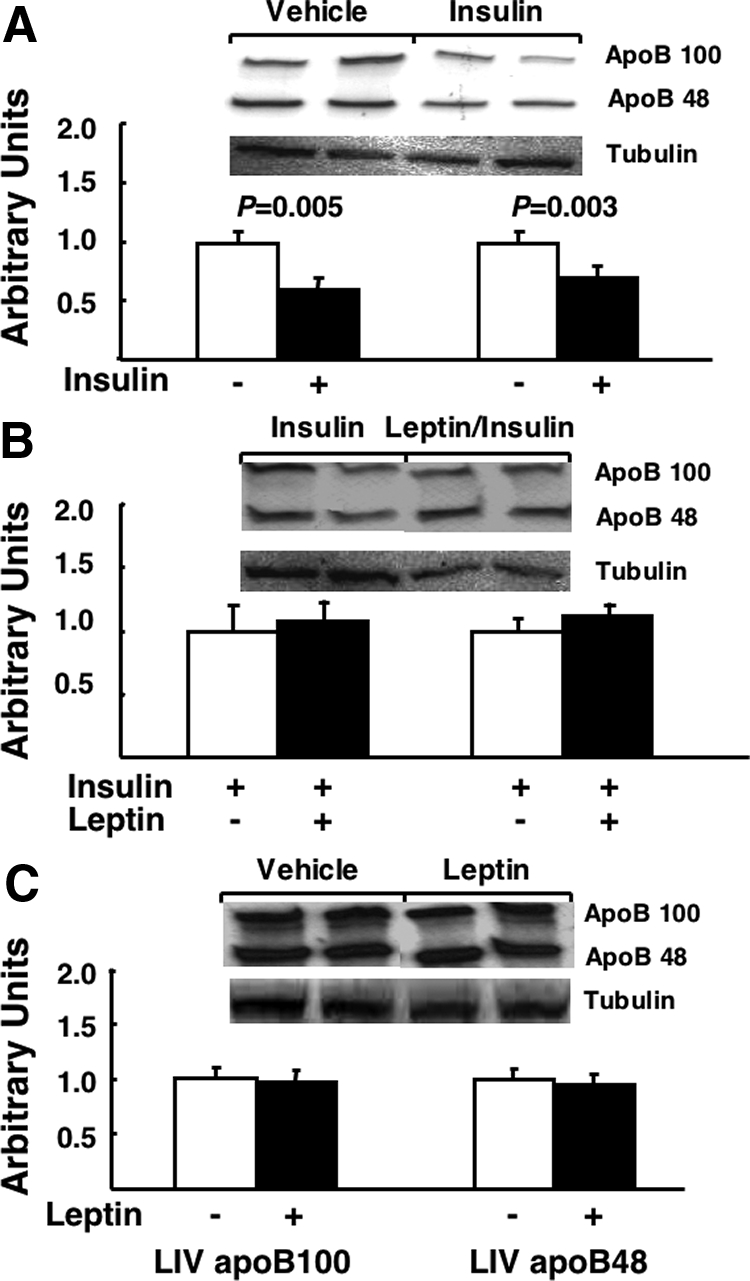
The effects of insulin and leptin on liver apoB-100 and apoB-48. Fasted (18 h) rats fed a standard chow diet received a continuous iv infusion of vehicle, insulin, leptin, or combined leptin and insulin as described in Materials and Methods. Subsequently liver was taken and apoB-100 and apoB-48 were measured by immunoblot as described in Materials and Methods. Autoradiograph composites from each experimental condition for apoB-100 and apoB-48 and tubulin are presented and the quantification of the total data for each condition is presented below each autoradiograph (n = minimum of six animals/group). Results are presented as mean ± se. Significant differences are indicated. A, Vehicle vs. insulin; B, insulin vs. leptin/insulin; C, vehicle vs. leptin. LIV, Liver.
Leptin augmentation of insulin suppression of plasma VLDL-TG is explained by the stimulation of oxidation of liver TGs
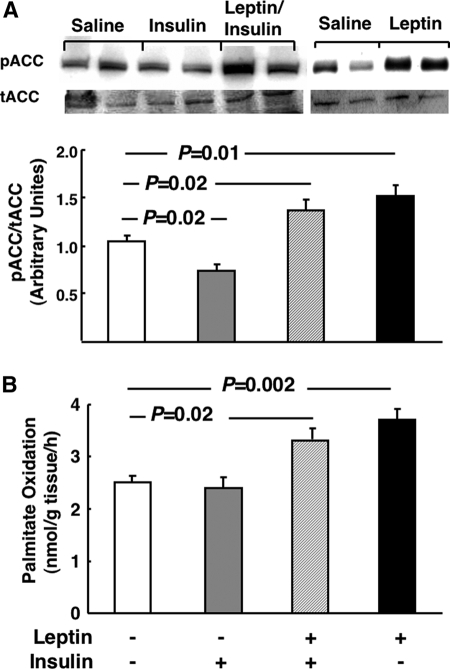
The data above demonstrate that the additive effects of leptin and insulin on VLDL-TG cannot be explained by leptin increasing insulin suppression of apoB levels. This observation led us to investigate other potential mechanisms to explain the additive effects of insulin and leptin on plasma VLDL-TG. Previous studies demonstrated that leptin lowers liver TGs (5,6,7). As expected, a leptin infusion decreased liver TG by 47 ± 4% vs. saline controls (P = 0.001), whereas insulin alone significantly elevated TGs by 18 ± 4% vs. saline controls (P = 0.03) (Fig. 5). Importantly, the capacity of leptin to lower liver TGs was maintained in the presence of insulin (Fig. 5). Insulin decreased ACC phosphorylation (Fig. 6A), but leptin counteracted the effects of insulin and further increased ACC phosphorylation compared with saline-infused controls (Fig. 6A). Furthermore, leptin increased fatty acid oxidation in the presence of insulin to the same extent as in the absence of insulin (Fig. 6B), emphasizing that the capacity of leptin to lower TGs and elevate oxidative metabolism were dominant over the opposing effects of insulin. Finally, there were trends toward decreased and increased fatty acid esterification in the presence of leptin and insulin, respectively, but neither effect reached statistical significance (data not shown).
Figure 5.
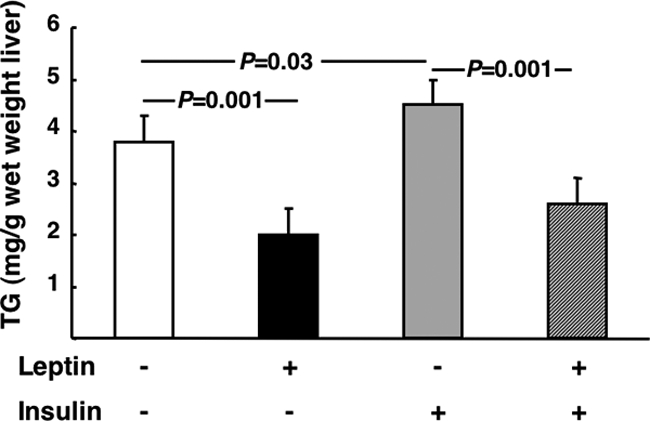
The effects of insulin and leptin on liver TG levels. Fasted (18 h) rats fed a standard chow diet received a continuous iv infusion of vehicle, insulin, leptin, or combined leptin and insulin as described in Materials and Methods. Subsequently liver was taken and TGs were measured as described in Materials and Methods (n = minimum of six animals/group). Results are presented as mean ± se. Significant differences are indicated.
Figure 6.
The effects of insulin and leptin on liver ACC phosphorylation and fatty acid oxidation. Fasted (18 h) rats fed a standard chow diet received a continuous iv infusion of vehicle, insulin, leptin, or combined leptin and insulin as described in Materials and Methods. Subsequently liver was taken and ACC phosphorylation was measured by immunoblot (A) or fatty acid oxidation was assessed (B) as described in Materials and Methods. For phospho (p) and total (t) ACC, autoradiograph composites from each experimental condition are presented and the quantification of the total data for each condition is presented below each autoradiograph. B, n = minimum of six animals/group. Results are presented as mean ± se. Significant differences are indicated. Lep, Leptin; Ins, insulin.
Discussion
The primary goal of the current study was to investigate interactions between leptin and insulin in the regulation of hepatic VLDL metabolism. The reason for undertaking this study was the current lack of understanding of these interactions, previous studies demonstrating leptin effects on insulin regulation of carbohydrate metabolism, and the important role of insulin and leptin in the regulation of lipid metabolism. Several novel observations arise from our studies. We demonstrate that: 1) leptin additively increases the suppressive effects of insulin on hepatic and systemic VLDL metabolism; 2) the mechanism of these effects involves complementary, but distinct, effects of insulin and leptin on liver apolipoprotein levels and oxidative metabolism, respectively; and 3) the TG-depleting and oxidative effects of leptin on lipid metabolism are maintained in the presence of insulin, a predominantly prolipogenic, antioxidative hormone.
We have established in the current study that the combined actions of insulin and leptin on VLDL metabolism are greater then the effects of either hormone alone. Furthermore, the net effects of leptin and insulin are to decrease not only the number of VLDL particles in the circulation (mediated by insulin) because one molecule of apoB represents one VLDL particle but also the triglyceride content of the VLDL particle (mediated by leptin). The potential physiological significance of these observations is perhaps most relevant to the fasting-to-fed transition and to the obese state, a condition of insulin and leptin resistance. Under normal physiological conditions, as the liver transitions from the fasted to the fed state, hepatic glucose output is suppressed (by decreasing gluconeogenesis and glycogenolysis) and VLDL secretion is reduced. Insulin plays a central role in regulating these processes, whereas a role for leptin is implied, based on the effects of leptin on liver lipid metabolism (5,6,7,11,13). Because leptin levels are increased by feeding, the data in the current study suggest that in addition to insulin, an elevation of leptin in the fed state may play a role in suppression of VLDL metabolism. In obesity, resistance to the actions of insulin and leptin reduces their capacity to effect liver metabolic processes. Indeed, in previous studies from our group (7), we demonstrated that diet-induced obesity results in a loss of leptin action on liver lipid metabolism. Thus, under experimental conditions similar to those in the current study, leptin failed to reduce liver or plasma VLDL-TGs and did not increase liver fatty acid oxidation in obese rats. Taken with the data in the current study, it can be proposed that a decrease of liver responsiveness to leptin would promote the development of steatosis, elevated VLDL secretion, and increased VLDL particle size. However, it should be stated that dyslipidemia may be present even in the absence of leptin resistance, as is the case in the nonobese high fructose-fed rat (6). Clearly further studies are required to address the combined roles of insulin and leptin in the regulation of hepatic VLDL metabolism, and more broadly, liver lipid metabolism.
Numerous studies have demonstrated the capacity of chronic leptin administration to improve insulin sensitivity, as it pertains to glucose metabolism (8,9,11,13). It has also been reported that acute leptin administration increases the capacity of insulin to suppress hepatic glucose output (12). The mechanisms of these effects include increased insulin suppression of glycogenolysis (12) and gluconeogenesis (8) in liver, increased insulin-stimulated glucose uptake in skeletal muscle (8,9,11,13), and increased insulin-stimulated skeletal muscle phosphatidylinositol 3-kinase and Akt activity (22). Because of these observations, we initially postulated that a mechanism of improved insulin suppression of plasma VLDL-TG would be an increase in the capacity of insulin to decrease apoB levels. This proved not to be the case. Indeed, although the effects of insulin and leptin on VLDL metabolism were complementary, their mechanisms of action were distinct. Thus, whereas insulin targeted suppression of apoB levels, leptin targeted a reduction in the triglyceride pool by increasing oxidative metabolism. Thus, in the context of an acute administration, leptin does not effect insulin action on VLDL metabolism. However, we cannot rule out that a more chronic administration of leptin, in which effects on insulin sensitivity are most pronounced, may also effect insulin regulation of lipid metabolism.
It is noteworthy that the capacity of leptin to decrease the liver TG pool and increase fatty acid oxidation was maintained in the presence of insulin. Stimulation of fatty acid oxidation by leptin and insulin inhibition of fatty acid oxidation are two well-established effects of these hormones. An important mechanism of these effects is the phosphorylation/dephosphorylation of ACC, a critical player in the regulation of fatty acid oxidation. Activation (dephosphorylation) of ACC by a number of stimuli including insulin increases the conversion of acetyl CoA to malonyl CoA, the latter being the primary allosteric inhibitor of the rate-determining enzyme of fatty acid oxidation, carnitine palmitoyl transferase 1. In previous studies, we established that similar to skeletal muscle (23), leptin increases ACC phosphorylation (an inactivating event) in liver (5,7) and presumably lowers malonyl-CoA levels, allowing increased entry of fatty acyl CoAs into mitochondria. In the current study, the effects of insulin on ACC were overcome by leptin, to the extent that there was an increase in ACC phosphorylation compared with saline controls when insulin and leptin were present. The mechanism by which leptin overcomes the effects of insulin is unclear. However, it is unlikely to involve AMP-activated protein kinase (AMPK), a target of leptin action in skeletal muscle (23) because previous work from our group established that leptin had no effect on AMPK activity in liver (5,7). Of note, unlike skeletal muscle, leptin also does not activate AMPK in cardiac muscle (24).
In conclusion, we have demonstrated that leptin augments the suppressive effects of insulin on hepatic VLDL production by decreasing liver triglycerides and stimulating oxidative metabolism. These data imply a role for leptin, in addition to insulin, in the acute suppression of hepatic VLDL metabolism. Furthermore, in addition to insulin resistance, we propose that leptin resistance may contribute to the development of hypertriglyceridemia and increased VLDL particle size in obesity.
Acknowledgments
We thank Lisa G. McFarland for excellent technical assistance with the LPL assay. We appreciate the consultations on plasma VLDL isolation with Dr. Rhobert Even and Ms. Beth Ann Hauth.
Footnotes
This work was supported by National Institutes of Health Grants RO1 DK058855 and RO1 DK072162 (both to R.M.O.) and the Claude D. Pepper Older Americans Independence Center Grant P30-AG28747 (to H.K.O.).
Disclosure Summary: The authors have nothing to disclose.
First Published Online January 15, 2009
Abbreviations: ACC, Acetyl CoA carboxylase; AMPK, AMP-activated protein kinase; apoB, apolipoprotein B; FFA, free fatty acid; GIR, glucose infusion rate; LPL, lipoprotein lipase; TG, triglyceride; VLDL, very low-density lipoprotein.
References
- Carpentier A, Taghibiglou C, Leung N, Szeto L, Van Iderstine SC, Uffelman KD, Buckingham R, Adeli K, Lewis GF 2002 Ameliorated hepatic insulin resistance is associated with normalization of microsomal triglyceride transfer protein expression and reduction in very low density lipoprotein assembly and secretion in the fructose-fed hamster. J Biol Chem 277:28795–28802 [DOI] [PubMed] [Google Scholar]
- Sparks JD, Sparks CE 1994 Insulin regulation of triacylglycerol-rich lipoprotein synthesis and secretion. Biochim Biophys Acta 1215:9–32 [DOI] [PubMed] [Google Scholar]
- Lewis GF, Uffelman KD, Szeto LW, Steiner G 1993 Effects of acute hyperinsulinemia on VLDL triglyceride and VLDL apoB production in normal weight and obese individuals. Diabetes 42:833–842 [DOI] [PubMed] [Google Scholar]
- Taghibiglou C, Rashid-Kolvear F, Van Iderstine SC, Le-Tien H, Fantus IG, Lewis GF, Adeli K 2002 Hepatic very low density lipoprotein-ApoB overproduction is associated with attenuated hepatic insulin signaling and overexpression of protein-tyrosine phosphatase 1B in a fructose-fed hamster model of insulin resistance. J Biol Chem 277:793–803 [DOI] [PubMed] [Google Scholar]
- Huang W, Dedousis N, Bandi A, Lopaschuk GD, O'Doherty RM 2006 Liver triglyceride secretion and lipid oxidative metabolism are rapidly altered by leptin in vivo. Endocrinology 147:1480–1487 [DOI] [PubMed] [Google Scholar]
- Huang W, Dedousis N, O'Doherty RM 2007 Hepatic steatosis and plasma dyslipidemia induced by a high-sucrose diet are corrected by an acute leptin infusion. J Appl Physiol 102:2260–2265 [DOI] [PubMed] [Google Scholar]
- Huang W, Dedousis N, Bhatt BA, O'Doherty RM 2004 Impaired activation of phosphatidylinositol 3-kinase by leptin is a novel mechanism of hepatic leptin resistance in diet-induced obesity. J Biol Chem 279:21695–21700 [DOI] [PubMed] [Google Scholar]
- Barzilai N, Wang J, Massilon D, Vuguin P, Hawkins M, Rossetti L 1997 Leptin selectively decreases visceral adiposity and enhances insulin action. J Clin Invest 100:3105–3110 [DOI] [PMC free article] [PubMed] [Google Scholar]
- Buettner R, Newgard CB, Rhodes CJ, O'Doherty RM 2000 Correction of diet-induced hyperglycemia, hyperinsulinemia, and skeletal muscle insulin resistance by moderate hyperleptinemia. Am J Physiol Endocrinol Metab 278:E563–E569 [DOI] [PubMed] [Google Scholar]
- Kamohara S, Burcelin R, Halaas JL, Friedman JM, Charron MJ 1997 Acute stimulation of glucose metabolism in mice by leptin treatment. Nature 389:374–377 [DOI] [PubMed] [Google Scholar]
- Petersen KF, Oral EA, Dufour S, Befroy D, Ariyan C, Yu C, Cline GW, DePaoli AM, Taylor SI, Gorden P, Shulman GI 2002 Leptin reverses insulin resistance and hepatic steatosis in patients with severe lipodystrophy. J Clin Invest 109:1345–1350 [DOI] [PMC free article] [PubMed] [Google Scholar]
- Rossetti L, Massillon D, Barzilai N, Vuguin P, Chen W, Hawkins M, Wu J, Wang J 1997 Short term effects of leptin on hepatic gluconeogenesis and in vivo insulin action. J Biol Chem 272:27758–27763 [DOI] [PubMed] [Google Scholar]
- Shimomura I, Hammer RE, Ikemoto S, Brown MS, Goldstein JL 1999 Leptin reverses insulin resistance and diabetes mellitus in mice with congenital lipodystrophy. Nature 401:73–76 [DOI] [PubMed] [Google Scholar]
- Commerford SR, Peng L, Dubé JJ, O'Doherty RM 2004 In vivo regulation of SREBP-1c in skeletal muscle: effects of nutritional status, glucose, insulin, and leptin. Am J Physiol Regul Integr Comp Physiol 287:R218–R227 [DOI] [PubMed] [Google Scholar]
- Davis RA, Clinton GM, Borchardt RA, Malone-McNeal M, Tan T, Lattier GR 1984 Intrahepatic assembly of very low density lipoproteins. Phosphorylation of small molecular weight apolipoprotein B. J Biol Chem 259:3383–3386 [PubMed] [Google Scholar]
- Belfrage P, Vaughan M 1969 Simple liquid-liquid partition system for isolation of labeled oleic acid from mixtures with glycerides. J Lipid Res 10:341–344 [PubMed] [Google Scholar]
- Bergö M, Olivecrona G, Olivecrona T 1997 Regulation of adipose tissue lipoprotein lipase in young and old rats. Int J Obes Relat Metab Disord 21:980–986 [DOI] [PubMed] [Google Scholar]
- Iverius PH, Brunzell JD 1985 Human adipose tissue lipoprotein lipase: changes with feeding and relation to postheparin plasma enzyme. Am J Physiol 249:E107–E114 [DOI] [PubMed] [Google Scholar]
- Lewis GF, Steiner G 1996 Acute effects of insulin in the control of VLDL production in humans. Implications for the insulin-resistant state. Diabetes Care 19:390–393 [DOI] [PubMed] [Google Scholar]
- Mittendorfer B, Patterson BW, Klein S, Sidossis LS 2003 VLDL-triglyceride kinetics during hyperglycemia-hyperinsulinemia: effects of sex and obesity. Am J Physiol Endocrinol Metab 284:E708–E715 [DOI] [PubMed] [Google Scholar]
- Zammit VA, Waterman IJ, Topping D, McKay G 2001 Insulin stimulation of hepatic triacylglycerol secretion and the etiology of insulin resistance. J Nutr 131:2074–2077 [DOI] [PubMed] [Google Scholar]
- Dube JJ, Bhatt BA, Dedousis N, Bonen A, O'Doherty RM 2007 Leptin, skeletal muscle lipids, and lipid-induced insulin resistance. Am J Physiol Regul Integr Comp Physiol 293:R642–R650 [DOI] [PubMed] [Google Scholar]
- Minokoshi Y, Kim YB, Peroni OD, Fryer LG, Müller C, Carling D, Kahn BB 2002 Leptin stimulates fatty-acid oxidation by activating AMP-activated protein kinase. Nature 415:339–343 [DOI] [PubMed] [Google Scholar]
- Atkinson LL, Fischer MA, Lopaschuk GD 2002 Leptin activates cardiac fatty acid oxidation independent of changes in the AMP-activated protein kinase-acetyl-CoA carboxylase-malonyl-CoA axis. J Biol Chem 277:29424–29430 [DOI] [PubMed] [Google Scholar]


