Abstract
Correction to: Molecular Systems Biology 5:245. doi:10.1038/msb.2009.2; published online 17 February 2009
Correction to: Molecular Systems Biology 5:245. doi:10.1038/msb.2009.2; published online 17 February 2009
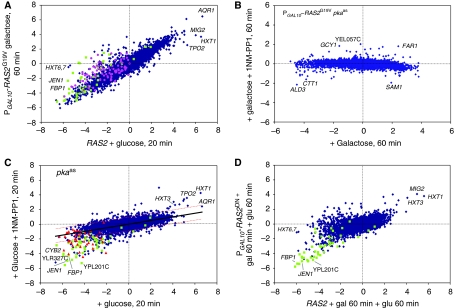
Since the publication of this paper, the authors have noticed an error in Figure 1. The legend on the x-axis in Figure 1 A should read ‘RAS2+glucose, 20 min' rather than ‘RAS2+galactose, 60 min'.
Please see the corrected figure below
Figure 1.
PKA mediates the primary transcriptional response of cells to glucose. Scatter plots of microarray data for ca. 5600 yeast genes, obtained from two different strains or conditions. Each point represents the log(2) change in levels of the mRNA for a single gene for one strain under one condition in the horizontal dimension and the log(2) change in mRNA levels for that gene in a different strain or condition in the vertical dimension. (A) Expression changes of all genes in a PGAL10-RAS2G19V strain (Y2866) pregrown on SC+3% glycerol, 60 min after the addition of 2% galactose relative to that at 0 min (vertical axis), versus a RAS2 strain (Y2864) pregrown on SC+3% glycerol, 20 min after glucose addition relative to 0 min (horizontal axis). (B) Both x- and y-axes show expression changes in PGAL10-RAS2G19V tpk1astpk2astpk3as (strain Y3621) pregrown on SC+3% glycerol, 60 min following the addition of galactose relative to 0 min. For the experiment in the vertical axis, 100 nM 1NM-PP1 was added concurrently with galactose. (C) Both x- and y-axes show expression changes in tpk1astpk2astpk3as (strain Y3561) grown on SC+3% glycerol 20 min following the addition of 2% glucose relative to 0 min. For the experiment in the vertical axis, 100 nM 1NM-PP1 was added concurrently with glucose. Solid black line shows the linear regression (y=0.26x), with the dotted red lines the two-fold limits from the regression line. (D) PGAL10-RAS2S24N (strain Y3168), pregrown on SC-glycerol and then preinduced with 2% galactose, 60 min after glucose addition relative to 0 min (vertical axis), versus RAS2 (strain Y2864) under the same conditions (horizontal axis). In all plots, genes whose expression is repressed more than two-fold by inactivation of Snf1 (see Figure 4) are shown in green, genes reported to be regulated by the Hap2/3/4/5 complex are shown in pink and those repressed more than two-fold by 125 μM glucose are shown in red.
The authors apologize for any inconvenience caused.


