Abstract
Peptide immunohistochemistry (IHC) controls are a new quality control format for verifying proper IHC assay performance, offering advantages in high throughput automated manufacture and standardization. We previously demonstrated that formalin-fixed peptide epitopes, covalently attached to glass microscope slides, behaved (immunochemically) in a similar fashion to the native protein in tissue sections. To convert this promising idea into a practical clinical laboratory quality control tool, we tested the hypothesis that the quality assurance information provided by peptide IHC controls accurately reflects IHC staining performance amongst a diverse group of clinical laboratories. To test the hypothesis, we first designed and built an instrument for reproducibly printing the controls on microscope slides and a simple software program to measure the color intensity of stained controls. Automated printing of peptide spots was reproducible, with CVs of 4−8%. Moreover, the peptide controls were stable at ≤4° C for at least seven months, the longest time duration we tested. A national study of 109 participating clinical laboratories demonstrated a good correlation between a laboratory's ability to properly stain formalin-fixed peptide controls to their ability in properly staining a 3+ HER-2 formalin-fixed tissue section mounted on the same slide (r = 0.87). Therefore, peptide IHC controls accurately reflect the analytical component of an IHC stain, including antigen retrieval. Besides its use in proficiency survey testing, we also demonstrate the feasibility of applying peptide IHC controls for verifying intra-laboratory IHC staining consistency, using Levy-Jennings charting.
Keywords: Immunohistochemistry, Controls, Standardization, Peptide, HER-2, Quality Control
INTRODUCTION
With the widespread use of immunohistochemical methods for producing semi-quantitative data, there is broad agreement that more rigorous quality assurance methods are required. Although most attention has focused on the accurate measurement of HER-2 1-4, similar needs apply to other immunohistochemical markers, such as estrogen and progesterone receptors 5-8, and EGFR 9-11. The use of immunohistochemistry (IHC) for the semi-quantitative measurement of analytes in tissue sections has created the need for improved IHC staining assay precision and linearity. These terms are somewhat foreign to clinical immunohistochemistry laboratories, which historically viewed IHC as a qualitative assay that produced either “positive” or “negative” results. Quantitative quality assurance methods used in the clinical chemistry laboratory, such as Levy-Jennings charting and the application of Westgard rules, are as yet impractical to apply in a clinical IHC laboratory. An important limiting factor is the absence of reproducible and quantitative IHC assay controls. Without them, relatively large IHC staining deviations remain undetected, potentially resulting in erroneous IHC test interpretations. Field studies suggest that the problem is real. Estimates from multi-center clinical trials indicate that the error rate for HER-2 testing is approximately 20% nationally. 1-3, 12 To help address this problem, we developed a reproducible and quantitative IHC control that can be applied to every slide.
We previously described quantitative IHC staining controls comprised of peptides, applied as 2−3 mm diameter spots that are covalently bound to glass microscope slides.13, 14 The peptides, typically approximately 20 amino acids long, represent the epitopes for commonly used monoclonal antibodies. Immunohistochemical staining results in the formation of color on both the tissue and the peptide spot, simultaneously. The intensity of the spot color is proportional to the staining intensity on tissue sections.14
Consequently, errors in tissue staining are detected as a failure in the corresponding control as well. Unlike cells and tissues, peptides can be printed on glass slides in a high throughput and reproducible fashion. The peptides can also be fixed in formalin, similar to formalin fixation of tissues, and behave immunochemically like the native antigen in tissue.15, 16 By comparing the staining of formalin-fixed peptides to unfixed peptides, IHC staining errors associated with antigen retrieval can be distinguished from errors in other analytic steps of the assay.12 In this report, we describe the results of a validation process, testing the hypothesis that the peptide controls reflect the performance quality of the analytical component (including antigen retrieval) for IHC staining.
MATERIALS AND METHODS
Production of peptide controls on slides
HER-2 controls were manufactured in a 2 − 3 step process: (1) chemical activation of the glass slides with a protected isocyanate coating, (2) deposition of microliter peptide spots at the appropriate concentrations and, optionally, (3) formalin fixation of the peptide spots.
Chemical activation of glass microscope slides. Standard microscope glass slides were chemically modified so as to create a protected isocyanate coating, as previously described.17-19 The protected isocyanate coating has the functional reactivity of an isocyanate, facilitating rapid attachment of peptides, but is also chemically stable. The stability is the result of an imidazole protecting group that is displaced by amines, hydroxyl, and carboxyl groups but is not displaced by water. Isocyanates tend to otherwise be so reactive that they react with water or water vapor, such as the humidity in the air. At the end of the first step, we have chemically activated slides, ready for covalent attachment to peptides. No further chemical cross-linking reagents are required. The activated slides are stable for months at 4° C.
Printing peptides on slides. Peptides (approximately 1 − 2 microliters per spot) are deposited onto the slides using a custom-designed slide printer that automatically and reproducibly deposits the peptide spots on the slides. The peptide used for HER-2 immunostaining corresponds to the portion of HER-2 containing the epitopes of both the CB11 mouse monoclonal antibody and Herceptest polyclonal rabbit antibody. Both of these antibodies recognize the same fragment of HER-2. The peptides comprising the epitopes for ER 1D5 and PR 636 were also previously described.13, 14
For coupling to isocyanate-coated microscope slides, appropriate working dilutions of peptides were made in a 0.5 mol/L potassium phosphate pH 8.9 buffer. Briefly, various peptides (1 μl) were spotted onto activated, isocyanate-derivatized microscope glass slides. The peptides were permitted to covalently couple to the glass for 3 minutes at 50° C, on the automated slide printer. The slides were then rinsed in running distilled water, and the remaining reactive isocyanate groups were quenched with a protein cocktail containing 0.2% casein and 0.2% bovine gamma globulins (Sigma Chemical Co., St. Louis, MO) in 250 mM KPO4 buffer, pH 8.9.
Formalin fixation of peptide controls. The peptides can be fixed in formalin through a process that we previously described.15, 16, 18 Most peptides do not contain a sufficient number of formalin-reactive amino acid side chains to result in a loss of immunoreactivity after exposure to formalin. However, we discovered that by first coating the slides with a protein, followed by vapor fixation with formalin, we can create formaldehyde cross-links between the protein and the peptide, thereby abrogating immunoreactivity. Antigen retrieval restores immunoreactivity.
Slides for fixation are first coated with 2% casein in 0.25 mol/L potassium phosphate pH 8.9 buffer for one hour at room temperature. The slides are then fixed in formalin vapor, at 37° C overnight. The slides are then rinsed in deionized water and stored at 4° C.
Peptides and Primary Antibody Reagents
Monoclonal antibody clones ER 1D5, PR636, and the Herceptest kit were obtained from Dako Corporation, Carpinteria, CA. HER-2 monoclonal antibody CB11 was obtained from Leica Biosystems, Newcastle upon Tyne, UK. Antibodies are diluted out as per manufacturer's recommendations. Synthetic peptides were custom manufactured to our specification by CSBio Corporation, Menlo Park, CA. Each peptide comprises approximately 20 amino acids and has a single free terminal amine group for covalent coupling to the activated glass microscope slide.
Immunohistochemical Staining
Peptides controls were subjected to a standard immunohistochemical staining procedure.14 If tissue or cells were immunostained, the sections were first deparaffinized in xylene, dipped in decreasing concentrations of ethyl alcohol, and then rehydrated in water. Antigen retrieval for HER-2 was performed in a water bath pre-heated to 98° C for 40 minutes using the antigen retrieval solution provided with the Herceptest kit. Antigen retrieval for other immunostains was performed by incubating the slides in a pressure cooker (Nordic Ware, Minneapolis, MN) for 30 minutes in a 0.01 mol/L citrate buffer (pH 6.0).
Except for the ER 1D5 primary antibody, all antibody incubations were performed at 37° C. Primary antibodies were incubated for 20 minutes for HER-2 and PR 636 or 40 minutes for ER 1D5. After the primary antibody incubation, the slides were rinsed in PBS and then incubated with biotin-conjugated horse anti-mouse IgG secondary antibody (Vector Laboratories, Burlingame, CA) for 20 minutes. The slides were then rinsed again and incubated with horseradish peroxidase-conjugated streptavidin (Vector Laboratories, Burlingame, CA) for 20 minutes. Color is then produced with a liquid stable diaminobenzidine (3, 3'-diaminobenzidine tetrahydrochloride)/hydrogen peroxide for 10 minutes and subsequently enhanced with 5% (wt/vol) copper enhancer (cupric sulfate pentahydrate) for 10 minutes, all from Sigma Chemical Corp., St. Louis, MO.
Construction of the slide printer
The slide printer deposits eight small droplets (containing peptides) in a 4 × 2 array and does so in a high throughput assembly-line fashion. The slide printer consists of two subassemblies. The first is a pneumatically-driven slide tray for conveying chemically-activated glass microscope slides under a dispenser. The subassembly also incorporates an electrical heater, under microprocessor control, for warming the slides after the peptide droplets have been applied to the slides. The second subassembly is the dispenser itself. Eight reservoirs, each capable of holding up to 4 mL of liquid, are pressurized through a manifold. The reservoirs are connected to dispense nozzles, each through an electrically-actuated valve. The amount of peptide dispensed is controlled both by the amount of time that the valve is opened and the pressure within the manifold that drives the fluid droplets.
Measurement of spot intensity
The peptide controls were quantified by scanning on a flatbed document scanner using a custom software program. The custom software application was written in C++ using Microsoft Foundation Classes (MFC) technology from Microsoft and the LEADTOOLS Raster Imaging Pro imaging toolkit from LEAD Technologies. The software application accepts input from either an image file (.bmp format) from a previously saved scan or directly from a color flatbed scanner. We also utilize a special slide holder that mounts on the flatbed scanner and positions up to twelve slides in pre-designated locations. The software finds the proper area of interest in the image data. Once the data have been imported, the software breaks the image into twelve distinct areas for each of the twelve slides possible on the scanner. The operator is stepped through a process of selecting the background levels first. For each slide, the operator designates three points on the slide as representative of the background color intensity for that slide. The three background points are averaged. The operator then selects one or more locations of interest on the slide, locations that have stained peptide control spots. For each location, the image data in the selected location are averaged, background subtracted, and the resulting value displayed for that area. These steps are repeated for each slide. The data can be saved into a data file with the image data and selected areas highlighted. In addition, the images and data can be printed.
HER-2 cell lines
Slides with sections of cell blocks comprising four HER-2 cell lines (SK-BR-3, MDAMB-453, MDA-MB-175, MDA-MB-231), expressing HER-2 at 3+, 2+, 1+, and 0 levels (respectively), were kindly provided by Leica Biosystems Newcastle Ltd, Newcastle Upon Tyne, UK. The cells had been fixed in formalin and embedded in paraffin blocks prior to sectioning and mounting on glass microscope slides. These cell blocks have been used extensively in proficiency surveys, as part of UKNEQAS – Immunocytochemistry and more recently by NordiQC and in Canada by QMPLS.
Image quantification of tissue sections
Serial sections of a 3+ breast carcinoma that were stained for HER-2 by study participants were submitted for image analysis, in order to quantify the degree of staining in an objective fashion. Immunohistochemical expression levels of the tissue sections were evaluated by an automated quantification system using image digitization (Ariol®, Applied Imaging, Corporation, now Genetix, San Jose, CA). There are several Ariol® IHC image analysis modules, the selection of which are dependant on the location of the protein identified by the immunohistochemical technique. Classifiers containing colorimetric and morphometric parameters are optimized to detect color intensities for specific object compartments (i.e. nuclear, cytoplasmic, and membrane). The Hersight™ module was used to evaluate the tissue sections as it is optimized for the analysis and quantification of membrane proteins. The slides were automatically loaded, whole tissue sections digitized at 200x magnification, and analyzed for HER-2 membrane staining. Data captured for each slide by this automated system include membrane intensity, percentage stained, and distribution of staining. The quantitative variables for each slide were then exported from the Ariol® Data Grid for subsequent review. The program output includes both a relative numerical score and, after instrument calibration, a HER-2 staining score of 0 − 3+, which is interpreted by a pathologist in making clinical decisions.
Image quantification by laser scanning cytometry of cell lines and peptide spots
Fully automated data acquisition and analysis was performed on an iCys® Imaging Cytometer (CompuCyte, MA).20 Laser light absorbance at 488nm and 633nm wavelengths was measured to quantify the expression of diaminobenzidine-stained HER-2 protein. For the cell lines, the HER-2 absorbance signal was isolated from the Hematoxylin counterstain. Three separate areas within the cell line elements and a single area within the peptide spots were measured. Mean values in relative absorbance units were reported.
RESULTS
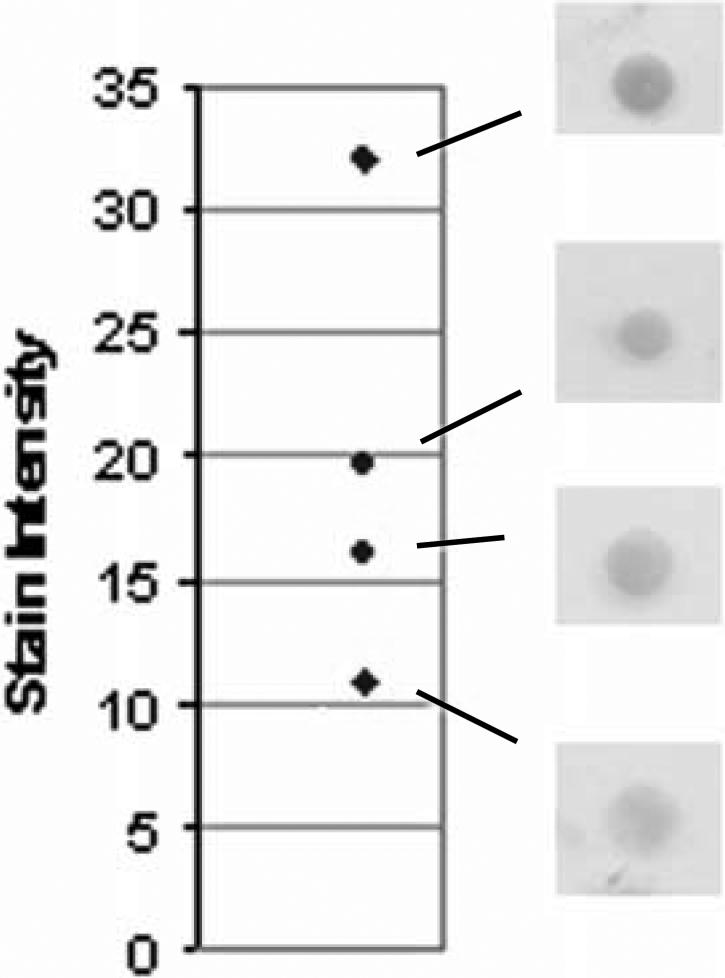
Examples of peptide controls at varying levels of intensity are illustrated in Figure 1. Since there is no national or international reference standard for IHC intensity staining21, we used a relative scale for measuring peptide spot intensity in units of mean pixel intensity. We measure spot intensity on a 1−256 linear scale.
Figure 1.
Examples of stained peptide control spots and their respective numerical scores. The y axis is expressed as mean pixel intensity, in relative units, and is not calibrated against a color intensity reference standard.
To measure the intensity of our peptide controls, we developed a system for quantification by scanning the slides on a flatbed document scanner. To foster reproducibility, all measurements were performed on the same computer and flatbed scanner. Although there were existing software packages for quantification of the controls, they were not designed for this purpose. Consequently, numerous manual steps were required for each measurement, rendering the process tedious. To simplify peptide control quantification, we developed a software program that integrates the functions together. The software drives the scanner, sends the images to a computer, and then quantifies the intensity of a circular area that is designated by the operator.
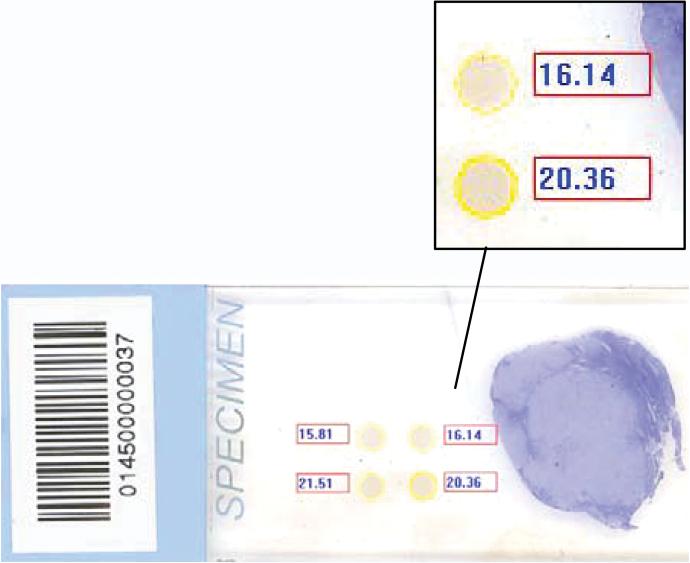
Figure 2 illustrates the appearance of an exemplary slide with stained peptide controls. The mean pixel intensity is calculated from the area within the yellow circle. The program initially scans up to twelve slides at a time and shows the peptide spots for each slide on the computer screen. The operator is first prompted to select three areas of the slide representing a background level of color intensity. The operator then places the cursor over the center of a peptide control spot and clicks the mouse button. A circle is deposited on the image and a readout of the color intensity is provided (with the background intensity already subtracted). The circle's position can be adjusted using the arrow keys.
Figure 2.
Software program screen for measuring stained peptide spot intensity. After subtracting the background level of intensity over irrelevant areas of the slide (not shown), color intensity is measured over the stained peptide spots (contained within the yellow circles). The value, in mean pixel intensity, is depicted in the higher magnification inset. The peptide control spots shown in the inset are not duplicates of each other, but rather serial dilutions. Duplicate peptide controls were printed with a horizontal orientation on the slide.
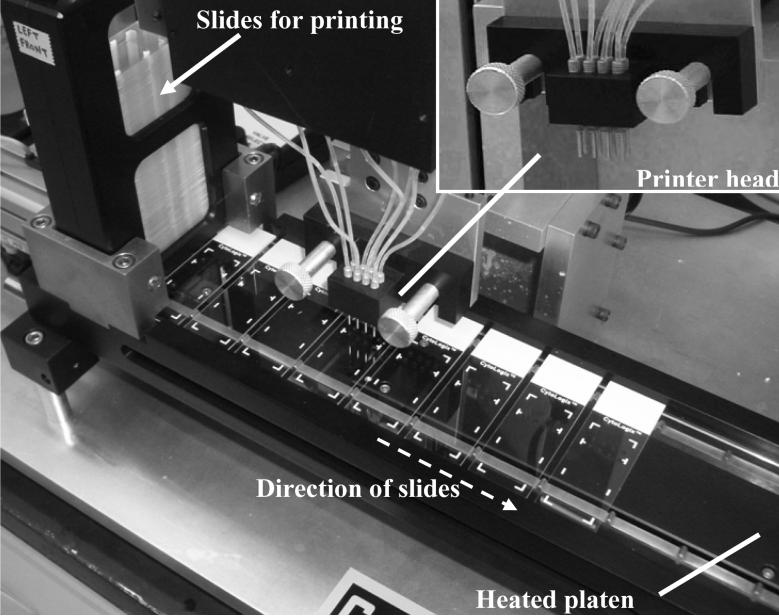
Before testing this new IHC controls technology in national clinical trials, a reproducible method for printing peptides on slides was required. It is important that the printing method result in a high degree of slide-to-slide reproducibility so as to confidently detect laboratory-related errors (rather than printing variability). Printing spots on slides is an established technology, in the context of creating microarrays. However, there were several limitations of microarray printers that precluded their use for this purpose. Most important, we found that contact spotting (using pins that make contact with the glass surface) produced inconsistent spots due to variability in the transfer of liquid from the pin to the glass surface (data not shown). Therefore, we developed a non-contact printing method that ejects small droplets onto the glass slide surface. Another important difference relative to microarray printers is that our needs were for printing a limited number of spots per slide (e.g., eight), but to print those spots on hundreds of slides. Microarray spotters, on the other hand, are designed for printing hundreds (or thousands) of different spots, but on a small number of slides. This influenced the design configuration of our printer, shown in Figure 3.
Figure 3.
Photograph of the prototype slide printer, with a higher magnification of the printer head (inset), showing eight nozzles, each of which dispense microliter-sized droplets of peptide onto passing slides. As the slides proceed towards the right, they pass onto a heated platen, which accelerates the peptide coupling reaction to the activated glass surface.
Figure 3 is a photograph of a portion of the peptide controls slide printer. A stack of microscope slides, ready for printing, is shown at the far left. The slides are automatically ejected from the stack, one at a time, and moved to the right so as to position them under the print head. The print head has eight nozzles arranged in the 4 × 2 array, out of which microliter-sized droplets are ejected onto an underlying slide. The slide conveyer then advances, placing a new slide under the nozzles, and the process repeats. The conveyer also incorporates a heating tray to warm the slides, for maximal peptide coupling efficiency. The slides are ultimately collected in a stack similar to the one shown at the far left.
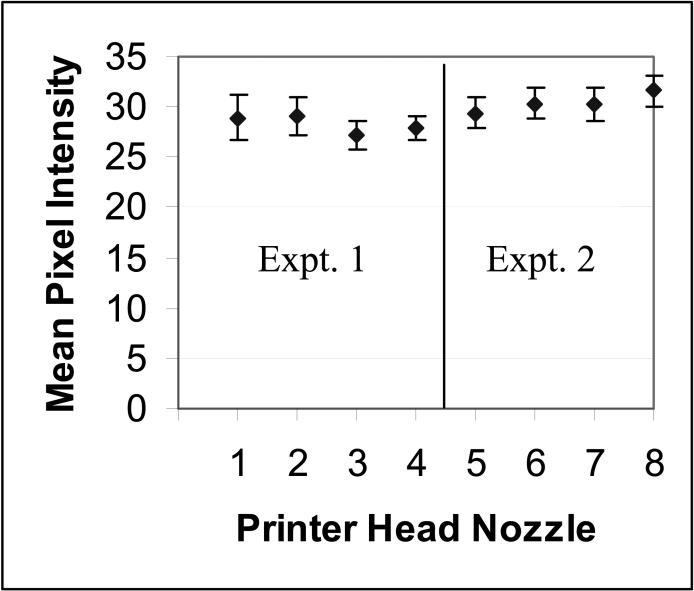
Attaining a high level of printer reproducibility is important if these peptide controls are to be helpful in assessing laboratory staining variability. To assess the reproducibility of printing, we measured the intensity of 96 replicate peptide spots using the ER peptide (specific for clone 1D5), at two different peptide concentrations (10 μM and 50 μM). For each experiment, twenty-four slides were printed, each with four peptide controls (yielding 96 spots in total). To measure the spot intensity, we stained the peptide controls with an immunohistochemical stain for ER, using the 1D5 mAb. In order to minimize the variability associated with the IHC stain, slides were dipped as a batch (of 24 slides) into staining buckets that contained the appropriate primary, secondary, or tertiary staining reagents. Although this uses more reagent, it fosters better staining reproducibility. Therefore, any variability is more likely to be due to printing rather than staining. Figure 4 illustrates the mean and standard deviation (SD) of printing peptide controls, from two experiments. The CV of the dispense volume from the same nozzle ranged from 4.5 − 7.5%. The CV of dispense volume between nozzles was 6.6% in experiment 1 (left-hand side of Figure 4) and 5.5% for experiment 2 (right-hand side of Figure 4).
Figure 4.
Consistency of slide-to-slide printing of peptide controls for each of the eight printer nozzles. The tight SD for each printer head nozzle demonstrates the high reproducibility in printing. Two separate experiments are shown.
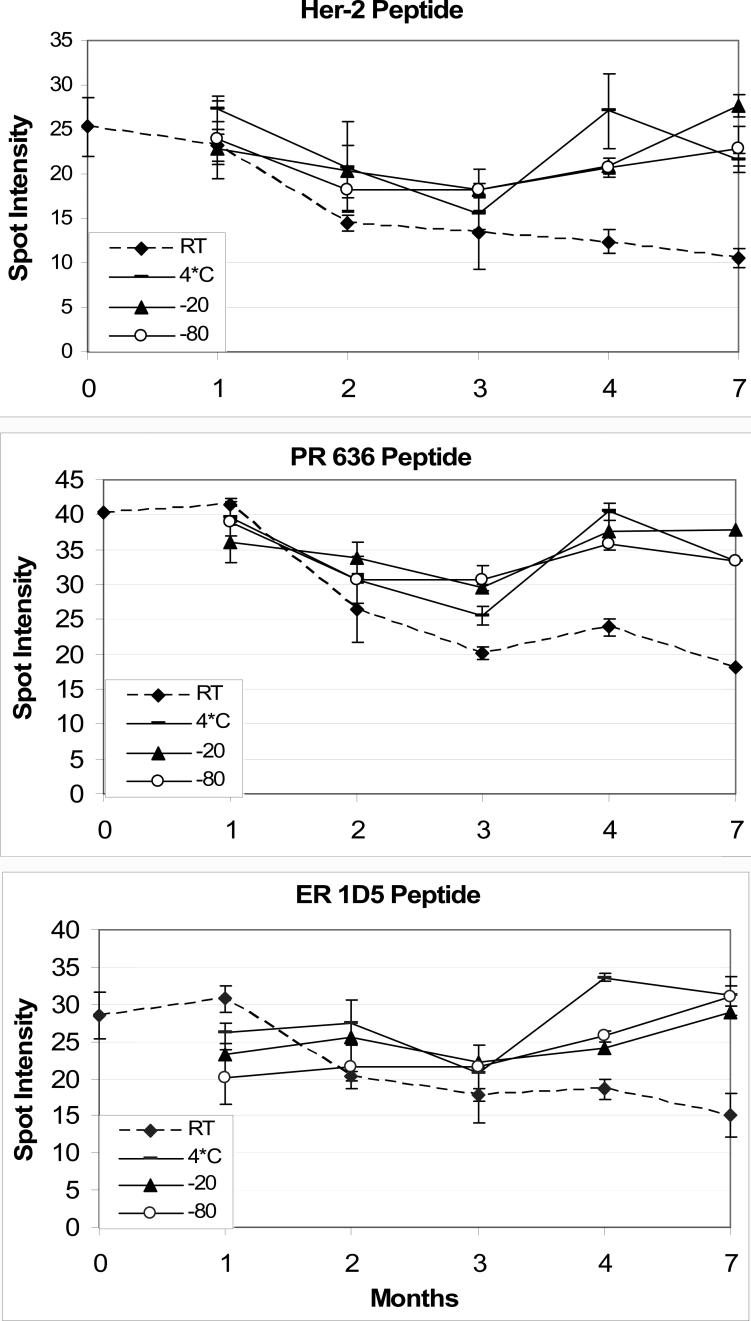
Another important prerequisite for large-scale clinical trials is that the peptide controls must be stable. Without stability, inter- or intra-laboratory variability could instead be ascribed to differences in the peptide controls’ length of storage. Peptide instability could obscure differences in the analytical component of immunohistochemical staining. Therefore, we conducted a stability test over a seven month time span to identify the optimal storage condition. We tested four different temperatures for storage of peptide controls: room temperature, refrigeration (4−7° C), a conventional freezer (−20 ° C), and an ultra-cold freezer (−80 ° C). We measured the peptide spot intensity (by immunohistochemistry) as a measure of the amount of immunoreactive peptide that was printed and attached to the slide after staining the controls. Since the immunohistochemical stains were, of necessity, performed at different times, we aliquoted and stored the IHC reagents at −80 ° C until they were needed.
Figure 5 illustrates the results from the stability study, for peptides specific for HER-2 (same peptide for both Herceptest and clone CB11), ER (1D5 clone), and PR (636 clone) peptide controls. Despite our aliquoting and freezing a common set of reagents for each immunostain time interval, there is still month-to-month variability in IHC staining. The variability is not due to degradation of the peptide controls, since there is no consistent trend. Despite the variability, the data illustrate that the slides stored at room temperature have a noticeably lower staining intensity than the others, even after one month. For the slides stored at 4−7° C, −20 ° C, and −80 ° C, there was no difference in any of the peptide controls out to seven months; no degradation of staining intensity is apparent after seven months.
Figure 5.
Stability of peptide controls, for HER-2 (top panel), progesterone receptor (PR) 636 monoclonal antibody (middle panel), and estrogen receptor (ER) 1D5 monoclonal antibody (bottom panel). The dotted line represents the immunoreactivity of peptide controls stored at room temperature. The slight dip in immunoreactivity at the 3 month time interval is related to a slight inconsistency in the staining protocol (immunohistochemical detection) rather than an actual decrease in stability. Each time point is the mean ± SD of four replicate peptide controls.
Having addressed methods for consistent printing and storage of the peptide controls, and a method for their measurement, we then conducted a national clinical study. One of the study's goals was to determine if formalin-fixed peptide controls provide an accurate measure of laboratory staining performance. The details of this study have already been described.12 Briefly, slides containing both breast carcinoma tumor samples and peptide controls (for HER-2) were sent out as part of a College of American Pathologists (CAP) proficiency survey. Laboratories voluntarily stained the slides and returned them. We then measured the staining intensity of the peptide controls using the software package described in association with Figure 2. We measured the tissue staining intensity with the Ariol® image analysis instrument (Materials and Methods).
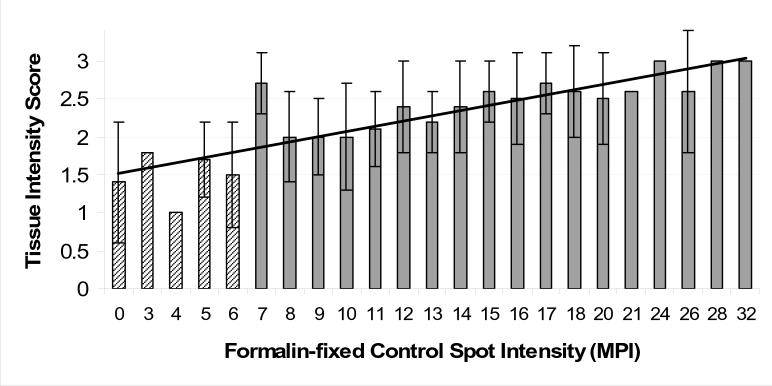
Figure 6 depicts the relationship between the staining intensity of peptide controls and a 3+ HER-2 positive breast carcinoma on the same slide. The data for Figure 6 are derived from 109 participating laboratories. Each category on the x axis represents the mean of 1 − 4 laboratories. We considered laboratories that stained the tissue section with a result less than a 2+ staining intensity as “failing”, and wanted to know what peptide controls score that correlates with. This initial study was for research only and had no impact on passing or failing the proficiency survey. The data indicate that the threshold corresponding to a tissue score less than 2+ was a mean pixel intensity of less than 7. There was a positive correlation between tissue intensity and peptide controls intensity, with an r value of 0.87. A best-fit straight line is also depicted in Figure 6.
Figure 6.
Relationship of the HER-2 staining intensity of a 3+ tissue biopsy section to the staining intensity of a 50 micromolar HER-2 peptide control spot on a glass microscope slide. The peptide spot intensities (x axis) are measured in units of mean pixel intensity (MPI). When error bars are shown, then the value represents the mean ± SD of more than one participating laboratory for that level of HER-2 peptide staining. The absence of an error bar means that only one laboratory returned a HER-2 peptide control value at that particular level of staining (expressed as “mean pixel intensity”, on the x axis). We fit the data with a best-fitting curve using a linear regression line.
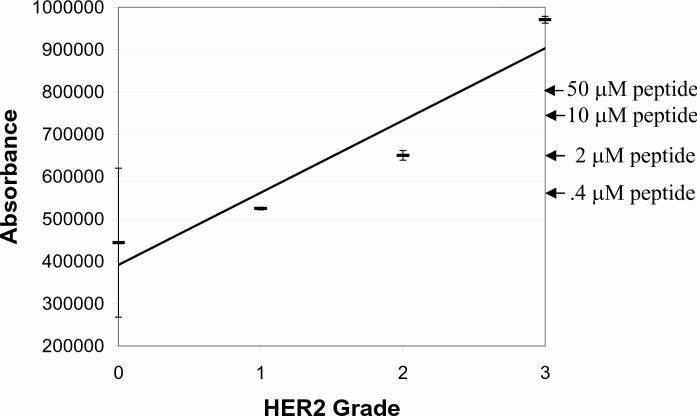
For peptide controls quantification, the data presented so far all used a relative scale in units of mean pixel intensity. It would be helpful to correlate this relative scale with the more traditional semi-quantitative 0 − 3+ HER-2 staining intensity scale. To do this, we stained both HER-2 peptide controls and HER-2 cell lines side-by-side. Similar cell lines were previously characterized for use in proficiency survey testing.22 In the absence of internationally agreed-upon HER-2 standards 21, we felt that these cell lines are the next best choice. We measured the staining intensity of both the cell lines and peptide controls using laser scanning cytometry and compared them on the same absorbance scale. Figure 7 depicts the relationship. The important conclusion is that the intensity of the (50 μM) peptide control approximately correlates with a 2 − 2.5+ cell staining intensity.
Figure 7.
Image intensity comparison between peptide IHC controls (50, 10, 2, and 0.4 μM concentration, whose intensities are shown at the right by the arrows) and HER-2 cell lines previously calibrated to 0, 1+, 2+, and 3+ staining intensity. The regression line has a correlation coefficient (r) = 0.95. The absorbance units on the y axis are relative units generated by the iCys laser scanning Cytometer.
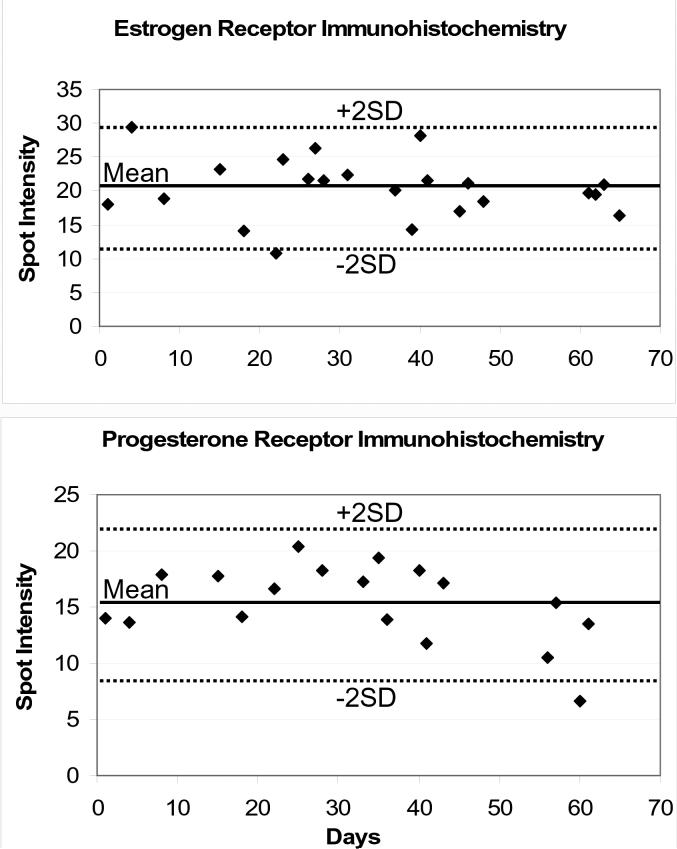
An important opportunity for peptide controls is its application to the measurement of intra-laboratory (day-to-day) staining variability. As a first proof-of-principle, we used formalin-fixed controls for estrogen and progesterone-receptor measurement. ER and PR peptide controls were immunostained in conjunction with each day's cases. The controls were quantified and plotted, in a Levy-Jennings graph format, shown in Figure 8. There were no staining failures during this time.
Figure 8.
Levy-Jennings charting for estrogen and progesterone receptor immunohistochemistry, over a two month period. The mean and ± 2SD boundaries are also shown. No staining failures occurred in this time frame.
DISCUSSION
When they are introduced commercially in 2009, peptide immunohistochemistry controls will offer clinical IHC laboratory staff a new method for precise quality control (QC). The technology has already been transferred from our research laboratory to ThermoFisher Corporation, where it is transitioning to commercial-scale manufacture. This study represents a research-to-commercialization transition, testing the accuracy of the peptide controls in assessing a laboratory's IHC staining performance.
Translating research concepts to practical products often involves pursuits that do not always fall within the typical academic realm. For this project, it included developing methods for reproducible manufacture of peptide controls and a software program for their measurement. Addressing these aspects was required in order to take the next step in shepherding the technology along. Proving that peptide controls can serve as accurate measures of IHC stains required a large national study, the details of which were recently published.12 This was especially true because peptide controls are a departure from the traditional type of IHC control, comprised of tissue sections or other biological material.
We determined that peptide controls are stable in the short-term at room temperature but should be stored long-term in a refrigerator. Clinical testing showed a positive correlation between staining of tissue sections and formalin-fixed peptide controls, although peptide controls produce a less intense image than a 3+ HER-2 cell line. Lastly, we conducted the first-ever IHC intra-laboratory quality assurance study adaptable to Levy-Jennings charting, demonstrating the utility of the peptide controls for daily laboratory quality assurance.
Peptide controls have important similarities and differences to prior methods of IHC QC using cell lines or tissue sections. Immunochemically, there is little difference between the two. With peptide controls, the primary staining antibody binds to its antigen in an identical fashion as if the antigen were in a cell or tissue section. Namely, the primary antibody binds to a peptide epitope that is identical to the linear epitope in the native protein. Antigen retrieval also induces a similar chemical reaction with peptide controls as occurs with formalin-fixed cells or tissue sections.15, 16 On the other hand, the methods for printing (Figure 3) and image quantification (Figure 2) underscore an important difference between peptide immunohistochemistry controls and prior methods of IHC QC. Unlike paraffin-embedded cell lines or tissue sections, peptide controls are amenable to high volume automated production methods, fostering manufacturing reproducibility and lower costs of production. The method of quantification is also different, in that peptide controls can be quantified using an off-the-shelf flatbed scanner and computer.
One of the important conclusions from the national study (Figure 6) is that formalin-fixed peptide controls serve as a measure of the staining parameters for tissue sections. The correlation, however, shows some variability (r = 0.87) amongst the data points. One potential source of this variability is due to differences in protein expression amongst the cells within a single tumor. Another source of variability relates to the distance from the peptide controls to the tissue section on the glass microscope slide. The peptide controls were positioned about an inch from the tissue section. During the study, we became aware that some laboratories dispensed an inadequate amount of reagent to cover both the tissue section and the peptide controls. Before the peptide controls are stained, they are invisible. Without seeing a tissue section to stain, some histotechnologists may not have provided a sufficient dispense volume to adequately cover them. This artifact became apparent when the control spot closer to the tissue section stained better than the duplicate that was positioned further away. We eliminated such samples from our calculations. The commercialized version will better denote the location of the peptide controls on the microscope slide.
It is a maxim in clinical laboratory testing that checks must be established to verify assay performance. Performing the test on an automated instrument does not obviate the need for quality assurance. Clinical tests that produce quantitative data, such as in the clinical chemistry laboratory, are amenable to quality assurance methods incorporating quantitative statistical tools. Westgard rules are the best known of these.23 Clinical immunohistochemistry laboratories have never before incorporated quantitative statistical quality assurance methods, since the QC data are qualitative in nature. Without quantitative measures, significant deviations in laboratory IHC test performance can occur before they would be noticed. Therefore, developing quantitative IHC quality assurance measures is important for fostering consistency and reproducibility within and between laboratories. As a first proof-of-principle, we performed a two month trial of using quantitative IHC measures for ER and PR staining. The data were graphed in a Levy-Jennings format, demonstrating the scope of variability experienced in a clinical IHC lab.
A comparison of the staining intensity associated with a 3+ HER-2 tissue section and the most intensely staining HER-2 peptide control (at 50 μM) revealed that they are not the same (Figure 7). Peptide controls stain at a level typically associated with a 2+ − 2.5+ intensity. This is not surprising, since tissue sections are considerably thicker. Tissue sections are usually cut at around 4−6 microns thick whereas the peptide controls are positioned on a single molecular plane of glass. The density of attachment to a solid phase is also different. Peptides are covalently attached to glass through a silane linker whereas the HER-2 protein is a transmembrane glycoprotein. From a functional (clinical) standpoint, a mid-range (2+) control is ideal for detecting changes in IHC staining; deviations resulting in either more or less intense staining are readily detected.
In summary, we demonstrate that peptide IHC controls can be manufactured reproducibly, are stable for storage, and can be accurately measured using readily available equipment. We also demonstrated the accuracy of peptide IHC controls in detecting staining problems. The fact that the peptide controls are highly reproducible makes them an attractive QC material for clinical application. Peptide controls may also be useful when biological controls, such as pathologic discard material or cell lines expressing the appropriate antigen, are not readily available.
ACKNOWLEDGEMENTS
This work was supported by grants CA106847 and CA94557 from the National Cancer Institute.
LITERATURE CITED
- 1.Paik S, Bryant J, Tan-Chiu E, et al. Real-world performance of HER2 testing -National Surgical Adjuvant Breast and Bowel Project experience. J. Natl. Cancer Inst. 2002;94(11):852–854. doi: 10.1093/jnci/94.11.852. [DOI] [PubMed] [Google Scholar]
- 2.Perez E, Suman V, Davidson N, et al. HER2 testing by local, central, and reference laboratories in specimens from the North Central Cancer Treatment Group N9831 Intergroup adjuvant trial. J Clin Oncol. 2006;24(19):3032–3038. doi: 10.1200/JCO.2005.03.4744. [DOI] [PubMed] [Google Scholar]
- 3.Roche P, Suman V, Jenkins R, et al. Concordance between local and central laboratory HER2 testing in the breast intergroup trial N9831. J Natl Cancer Inst. 2002;94:855–857. doi: 10.1093/jnci/94.11.855. [DOI] [PubMed] [Google Scholar]
- 4.Wolff A, Hammond M, Schwartz J, et al. American Society of Clinical Oncology/College of American Pathologists guideline recommendations for Human Epidermal Growth Factor Receptor 2 testing in breast cancer. Arch. Pathol. & Lab. Med. 2007;131:18–43. doi: 10.5858/2007-131-18-ASOCCO. [DOI] [PubMed] [Google Scholar]
- 5.Chung G, Zerkowski M, Ghosh S, Camp R, Rimm D. Quantitative analysis of estrogen receptor heterogeneity in breast cancer. Lab Invest. 2007;87(7):662–669. doi: 10.1038/labinvest.3700543. [DOI] [PubMed] [Google Scholar]
- 6.Moeder C, Giltnane J, Harigopal M, et al. Quantitative justification of the change from 10% to 30% for human epidermal growth factor receptor 2 scoring in the American Society of Clinical Oncology/College of American Pathologists guidelines: tumor heterogeneity in breast cancer and its implications for tissue microarray based assessment of outcome. J Clin Oncol. 2007;25(34):5418–5425. doi: 10.1200/JCO.2007.12.8033. [DOI] [PubMed] [Google Scholar]
- 7.Rhodes A, Jasani B, Balaton A, et al. Study of interlaboratory reliability and reproducibility of estrogen and progesterone receptor assays in Europe: Documentation of poor reliability and identification of insufficient microwave antigen retrieval time as a major contributory element of unreliable assays. Anat. Pathol. 2001;115:44–58. doi: 10.1309/H905-HYC1-6UQQ-981P. [DOI] [PubMed] [Google Scholar]
- 8.Ross J, Symmans W, Pusztai L, Hortobagyi G. Standardizing slide-based assays in breast cancer: hormone receptors, HER2, and sentinel lymph nodes. Clin Can Res. 2007;13(10):2831–2835. doi: 10.1158/1078-0432.CCR-06-2522. [DOI] [PubMed] [Google Scholar]
- 9.D'Andrea M, Gasparini G. The future of anti-EGFR therapy. Int J Biol Markers. 2007;22(1 Suppl 4):S88–93. [PubMed] [Google Scholar]
- 10.Dei Tos A, Ellis I. Assessing epidermal growth factor receptor expression in tumours: what is the value of current test methods? [Review]. Eur J Cancer. 2005;41(10):1383–1392. doi: 10.1016/j.ejca.2005.03.018. [DOI] [PubMed] [Google Scholar]
- 11.Eberhard D, Giaccone G, Johnson B. Biomarkers of Response to Epidermal Growth Factor Receptor Inhibitors in Non–Small-Cell Lung Cancer Working Group: Standardization for Use in the Clinical Trial Setting. J Clin Oncol. 2008;26(6):983–994. doi: 10.1200/JCO.2007.12.9858. [DOI] [PubMed] [Google Scholar]
- 12.Vani K, Sompuram S, Fitzgibbons P, Bogen S. National HER2 proficiency test results using standardized quantitative controls: characterization of laboratory failures. Arch Pathol & Lab Med. 2008;132(2):211–216. doi: 10.5858/2008-132-211-NHPTRU. [DOI] [PubMed] [Google Scholar]
- 13.Sompuram S, Kodela V, Ramanathan H, Wescott C, Radcliffe G, Bogen S. Synthetic peptides identified from phage-displayed combinatorial libraries as immunodiagnostic assay surrogate quality control targets. Clin. Chem. 2002;48(3):410–420. [PubMed] [Google Scholar]
- 14.Sompuram S, Kodela V, Zhang K, et al. A novel quality control slide for quantitative immunohistochemistry testing. J. Histochem. Cytochem. 2002;50:1425–1434. doi: 10.1177/002215540205001101. [DOI] [PubMed] [Google Scholar]
- 15.Sompuram S, Vani K, Bogen S. A molecular model of antigen retrieval using a peptide array. Amer. J. Clin. Pathol. 2006;125:91–98. [PubMed] [Google Scholar]
- 16.Sompuram S, Vani K, Hafer L, Bogen S. Antibodies immunoreactive with formalin-fixed tissue antigens recognize linear protein epitopes. Amer J Clin Pathol. 2006;125(1):82–90. 125(1):82−90. [PubMed] [Google Scholar]
- 17.Sompuram S, McMahon D, Vani K, Ramanathan H, Bogen S. A novel microscope slide adhesive for poorly adherent tissue sections. J. Histotechnol. 2003;26:1–7. [Google Scholar]
- 18.Sompuram S, Vani K, Messana E, Bogen S. A molecular mechanism of formalin-fixation and antigen retrieval. Amer. J. Clin. Pathol. 2004;121:190–199. doi: 10.1309/BRN7-CTX1-E84N-WWPL. [DOI] [PubMed] [Google Scholar]
- 19.Sompuram S, Vani K, Wei L, Ramanathan H, Olken S, Bogen S. A water-stable protected isocyanate glass array substrate. Anal. Biochem. 2004;326:55–68. doi: 10.1016/j.ab.2003.11.008. [DOI] [PubMed] [Google Scholar]
- 20.Luther E, Kamentsky L, Henriksen M, Holden E. Next-generation laser scanning cytometry. Methods Cell Biol. 2004;75:185–218. doi: 10.1016/s0091-679x(04)75008-6. [DOI] [PubMed] [Google Scholar]
- 21.Hammond M, Barker P, Taube S, Gutman S. Standard reference material for Her2 testing: Report of a National Institute of Standards and Technology-sponsored consensus workshop. Appl. Immunohistochem. & Mol. Morphol. 2003;11(2):103–106. [PubMed] [Google Scholar]
- 22.Rhodes A, Jasani B, Couturier J, et al. A formalin-fixed, paraffin-processed cell line standard for quality control of immunohistochemical assay of HER-2/neu expression in breast cancer. Amer. J. Clin. Pathol. 2002;117:81–89. doi: 10.1309/4NCM-QJ9W-QM0J-6QJE. [DOI] [PubMed] [Google Scholar]
- 23.Westgard J, Barry P, Hunt M, Groth T. A multi-rule Shewhart chart for quality control in clinical chemistry. Clin. Chem. 1981;27(3):493–501. [PubMed] [Google Scholar]


