Beale et al. (1) reported that species–climate associations estimated with envelope models were no better than expected by chance for 68% of the European birds studied. Beale et al. estimated species–climate associations with 4 variables, including soil water availability and ignored ≈11% of the available bird species records for Europe, i.e., all probable and confirmed records with <10 breeding pairs and all possible breeding records.
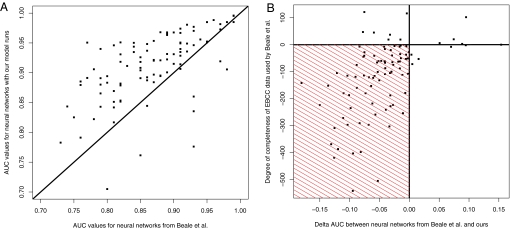
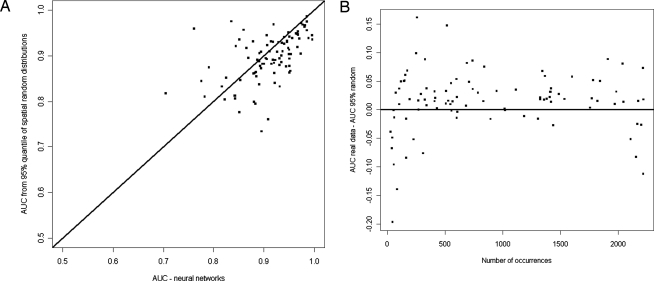
To investigate the consequences of these choices, we replicated their study using the complete set of available bird records for Europe (2). We restricted analysis to climate variables expected to impose direct constraints on bird distributions (3). Our models had higher area under the curve (AUC) values than those of Beale et al. 90% of the time (Fig. 1A). Improved model performance was mainly due to the use of more complete species distributions data (Fig. 1B). Most importantly, measured species–climate associations were better than expected by chance 72% of the time (P < 0.05), rather than 32%, as estimated by Beale et al. (1) (Fig. 2A). Estimates of significance were affected by species range size with models failing to measure associations among restricted- and wide-ranging species (Fig. 2B). Comparable results were obtained with alternative null distributions provided by Beale and Lennon (Fig. 3).
Fig. 1.
Performance of climate envelopes in Beale et al. (1) and in our analysis. (A) AUC values obtained with artificial neural networks (ANN) for each of the 94 bird species modeled [out of 100 species modeled by Beale et al. (1)]. In addition to including more occurrence records per species, our analysis further differs from Beale et al. (1) in that we excluded Iceland, a few grid cells in Russia, and some of the former Soviet Republics. Axis x represents the AUC values obtained by Beale et al. (1) using annual growing degree days, mean temperature of the coldest month, soil water availability, and the coefficient of variation in the mean monthly temperature. Axis y represents AUC values obtained with the same implementation of ANN, but using growing degree days, mean temperature of the coldest month, annual precipitation, and an index of humidity calculated as the ratio of mean annual actual evapotranspiration over the mean annual potential evapotranspiration. (B) Delta between ANN AUC values obtained by Beale et al. (1) and our ANN AUC models with improved data (x), against degree of completeness in the bird species data (y), whereby negative values indicate the number of records missing in Beale et al.'s analysis. The red-shaded area shows where our ANN models yielded higher AUC values over Beale et al. (1) models because of improved completeness of the species distribution data.
Fig. 2.
Performance of our climate envelopes against the null model. (A) AUC values for real species obtained with our ANN model runs (y axis in Fig. 1A) against the AUC values obtained with a null model that generates virtual species with the same prevalence and spatial structure as the real species (the published null model Beale and colleagues). AUC values for the null distributions are the top 5% scores from random trials (i.e., P < 0.05). When using ANN models with improved response and predictor variables, real models were better than expected by chance 72% of the time [instead of 32% in Beale et al. (1)]. (B) Improvement of AUC scores for ANN models using real data as compared with ANN models with null distributions (top 5% AUC scores from random trials) against range size. Models with real data tend to under-perform with restricted- and wide-ranging species.
Fig. 3.
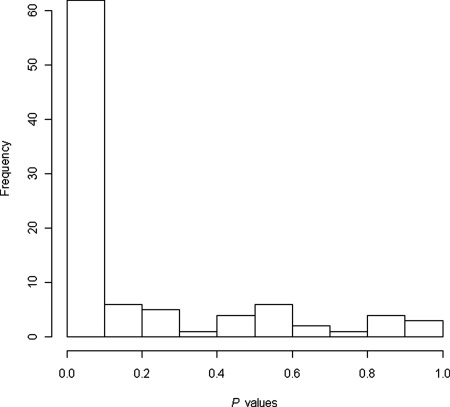
Analyses in Fig. 2 were repeated with an analogous, unpublished, null model provided by Beale et al. With the new null distributions, models with real data were better than expected by chance 55% of the time (instead of 32% in Beale et al.). To formally examine the null hypothesis (H0) that climate does not drive bird distributions in Europe, we combined significance values for all species using Fisher's exact test (7). When P values approach 0, it leads to rejection of the null hypothesis, thus supporting the alternative hypothesis of a statistically significant relationship between species distributions and climate. Here, the combination of P values yielded an overall P < 0.0001. Under H0, the frequency distribution of P values should also be uniform between 0 and 1, a condition that is not met with these data.
We agree with Beale et al. (1) that there are algorithmic as well as ecological uncertainties with envelope models (4–6). However, we found no evidence that species–climate associations among European birds and climate are no stronger than expected by chance. Their conclusions are, therefore, overstated.
Footnotes
The authors declare no conflict of interest.
References
- 1.Beale CM, Lennon JJ, Gimona A. Opening the climate envelope reveals no macroscale associations with climate in European birds. Proc Natl Acad Sci USA. 2008;105:14908–14912. doi: 10.1073/pnas.0803506105. [DOI] [PMC free article] [PubMed] [Google Scholar]
- 2.Hagemeijer WJM, Blair MJ. The EBCC Atlas of European Breeding Birds, Their Distribution and Abundance. London: Poyser; 1997. [Google Scholar]
- 3.Root TL. Environmental factors associated with avian distributional boundaries. J Biogeogr. 1988;15:489–505. [Google Scholar]
- 4.Thuiller W, et al. Uncertainty in predictions of extinction risk. Nature. 2004 doi: 10.1038/nature02716. [DOI] [PubMed] [Google Scholar]
- 5.Araújo MB, Rahbek C. How does climate change affect biodiversity? Science. 2006;313:1396–1397. doi: 10.1126/science.1131758. [DOI] [PubMed] [Google Scholar]
- 6.Thuiller W, et al. Predicting climate change impacts on plant diversity: Where to go from here? Perspect Plant Ecol, Evol, Syst. 2008;9:137–152. [Google Scholar]
- 7.Fisher RA. Combining independent tests of significance. Am Stat. 1948;2:30. [Google Scholar]


