Abstract
Posttranscriptional processes often involve specific signals in mRNAs. Because mRNAs of integral membrane proteins across evolution are usually translated at distinct locations, we searched for universally conserved specific features in this group of mRNAs. Our analysis revealed that codons of very hydrophobic amino acids, highly represented in integral membrane proteins, are composed of 50% uracils (U). As expected from such a strong U bias, the calculated U profiles of mRNAs closely resemble the hydrophobicity profiles of their encoded proteins and may designate genes encoding integral membrane proteins, even in the absence of information on ORFs. We also show that, unexpectedly, the U-richness phenomenon is not merely a consequence of the codon composition of very hydrophobic amino acids, because counterintuitively, the relatively hydrophilic serine and tyrosine, also encoded by U-rich codons, are overrepresented in integral membrane proteins. Interestingly, although the U-richness phenomenon is conserved, there is an evolutionary trend that minimizes usage of U-rich codons. Taken together, the results suggest that U-richness is an evolutionarily ancient feature of mRNAs encoding integral membrane proteins, which might serve as a physiologically relevant distinctive signature to this group of mRNAs.
Keywords: evolution, hydrophobicity scale, mRNA targeting, U-rich mRNA
In addition to protein-coding information, mRNAs sometimes harbor signals required for posttranscriptional regulatory pathways, such as processing, translation, degradation, and localization (1, 2). For selective targeting, mRNAs use various protein-interaction determinants (structural, sequence specific, or nonspecific) (3), mostly in untranslated regions, although unique exceptions have been described (e.g., ref. 4). mRNAs of integral membrane proteins across evolution are usually translated at distinct locations, and our studies in Escherichia coli have suggested a step through which these mRNAs might be selectively targeted to membrane-bound ribosomes (5–7). Therefore, we investigated the possibility that mRNAs encoding integral membrane proteins have species-independent characteristic features, which might provide an evolutionarily conserved means for their selective recognition and targeting to the membrane. As a basis for our analysis, we reasoned that because prokaryotes express polycistronic transcripts, sometimes encoding a mixture of membrane and cytosolic proteins, targeting signals might be located inside ORFs in addition to untranslated regions.
Results and Discussion
Analysis of the Genetic Code in mRNAs Encoding Integral Membrane Proteins.
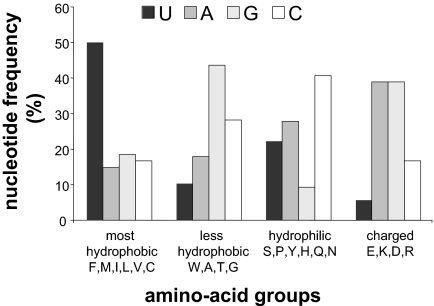
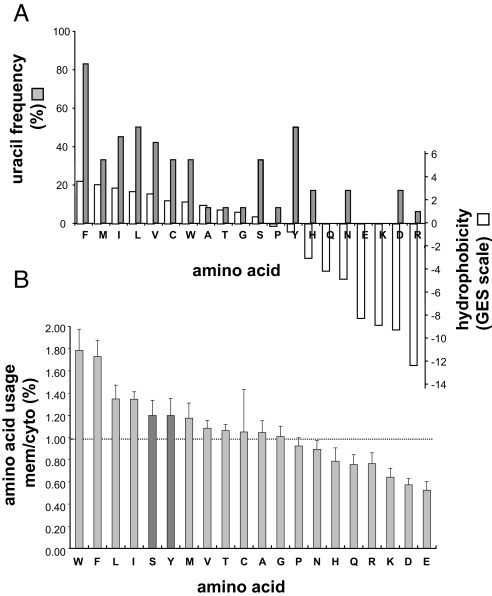
A unique property of integral membrane proteins is that they have stretches containing very hydrophobic amino acid residues (≈20). Therefore, we analyzed the nucleotide composition of very hydrophobic codons [according to the Goldman, Engelman, Steitz (GES) scale] (8), in the context of the entire genetic code. Since the first description of the nearly universal genetic code (for a review see ref. 9), various explanations of its organization and the assignment of the 64 triplets have been offered (10, 11). It was soon realized that chemically similar amino acids are often encoded by relatively similar codons (12, 13) and that very hydrophobic amino acids are encoded by codons having uracil (U) in the second position (14). Our analysis revealed that, in addition to their second position, codons of very hydrophobic amino acids have a remarkably high U content in general (Fig. 1). Specifically, 50% of the combined numbers of nucleotides in these codons are Us. In contrast, the U content in codons of all other groups of amino acids is ≤22%, and the total U content in all of the 61-aa coding triplets is 24.6%, suggesting a strong U bias in mRNAs encoding integral membrane proteins. Next, we investigated whether the proposed U bias is an inherent requirement for mRNAs encoding integral membrane proteins or merely a trivial consequence of the high U content in codons of very hydrophobic amino acids. As shown in Fig. 2A, there are 2 relatively hydrophilic amino acids, serine and tyrosine, both encoded by U-rich codons (33% and 50% U, respectively). On the basis of the chemical nature of serine and tyrosine, we predicted that both of them should be more abundant in soluble proteins. In contrast, analysis of their usage in multipass membrane and cytoplasmic proteins from various organisms (supporting information Tables S1 and S2) revealed higher content of serine and tyrosine in the membrane protein group (≈20% more) (Fig. 2B). These results strongly suggest that integral membrane protein transcripts might have been programmed or had evolved to contain high contents of U.
Fig. 1.
Distribution of nucleotides in groups of codons encoding chemically similar amino acids. Amino acids were classified according to their hydrophobicity values by using the GES scale (8). The frequency of each nucleotide was calculated by dividing its occurrence by the sum of nucleotides in each group of codons.
Fig. 2.
U usage, hydrophobicity, and amino acid usage in membrane proteins. (A) U usage in codons of each amino acid and the hydrophobicity of each amino acid according to the GES scale. (B) Usage of each amino acid in multipass membrane proteins (mem) divided by its usage in cytoplasmic proteins (cyto) selected from 11 organisms (see Tables S1 and S2). Error bars indicate SD (among the various species, Table S2).
Analysis of the Distribution of U in Membrane Protein mRNAs.
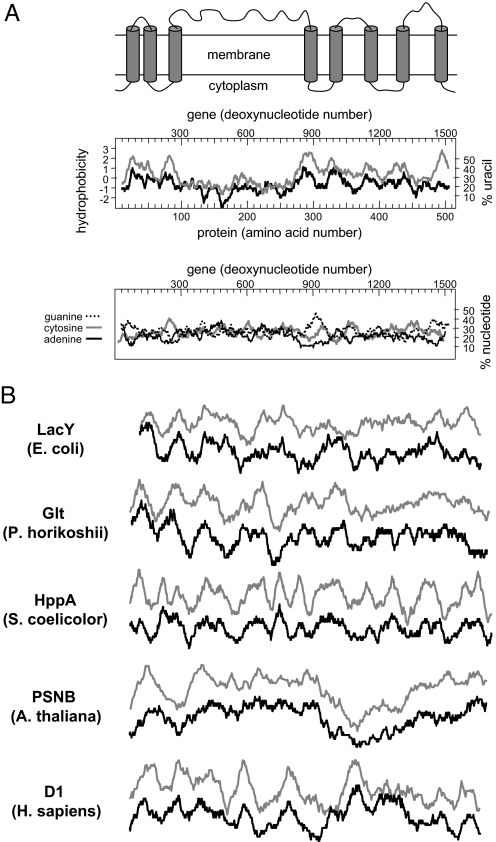
Traditionally, integral membrane proteins are analyzed for their hydrophobicity profiles (15), using algorithms that help identify their transmembrane helices. We wondered whether our discovery of the high U content of very hydrophobic codons might be helpful in identifying integral membrane proteins through the analysis of U profiles of genes. Initially, we compared the hydrophobicity profiles of several integral membrane proteins with the U profiles of their mRNAs. Fig. 3 shows several examples in which both curves are strikingly similar. MalF is a complex integral membrane protein with 8 transmembrane helices and a large external hydrophilic domain (Fig. 3A, Top) (16). The calculated Kyte-Doolittle-based hydrophobicity profile of MalF (Fig. 3A, Middle) supports the proposed secondary structure model. Remarkably, the calculated U profile of the malF mRNA also supports this model, and the 2 profiles are very similar. Notably, although similar, there are subtle differences that might indicate the importance of features other than the identified relationship between the protein hydrophobicity and U content and distribution in the gene, as shown above for serine and tyrosine. In contrast to the similarity observed with the U profile, the profiles of the other nucleotides adenine (A), cytosine (C), and guanine (G) are completely different from that of the hydrophobicity profile (Fig. 3A, Bottom). Next, we analyzed other proteins from different species and found that in all cases, the hydrophobicity profiles and the U profiles closely resemble each other (Fig. 3B), suggesting that U profiles might be used to identify cDNAs encoding integral membrane proteins in various organisms, even in the absence of information about ORFs. Our analysis is qualitative, but it would be interesting to test whether U profiles can improve current membrane-protein topology prediction methods (17). For example, serine and tyrosine, which are more abundant in membrane proteins, might reduce the prediction power of hydrophobicity-based algorithms. In contrast, the contribution of serine and tyrosine should be readily observed in the U profiles of genes because of the high U content of their codons (Fig. 2A).
Fig. 3.
Comparison between hydrophobicity profiles and U profiles. (A) Top: Topology model of MalF (16). Middle: Hydrophobicity profile of MalF is shown in gray, and U profile of MalF mRNA is shown in black. Bottom: Distribution of A (black), C (gray), and G (dashed) in the MalF mRNA is shown using the same scale as in Middle. (B) Superposition of the hydrophobicity plots (gray) and U profiles (black) of the indicated integral membrane proteins and their respective mRNAs. The Kyte-Doolittle hydrophobicity plots (window of 19 residues) and the U plots (window of 55 nucleotides) were calculated using DNA Strider 1.4f6.
Large-Scale Comparison of Hydrophobicity and U Richness.
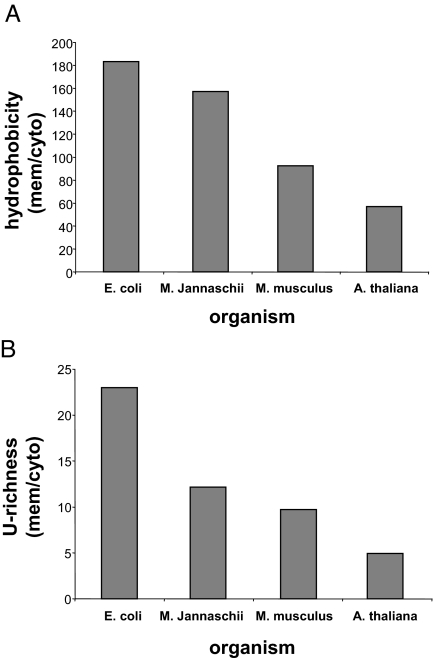
To obtain a preliminary large-scale view of the U-richness phenomenon, we selected annotated Swiss-Prot entries for hundreds of multipass membrane proteins and cytoplasmic ones from E. coli, Methanococcus Jannaschii, Arabidopsis thaliana, and Mus musculus. Each entry was analyzed for its hydrophobicity and U-richness, using rather arbitrary parameters for the hydrophobicity (window of 20 residues, value of 1.5 according to the Kyte-Doolitle scale) and U-richness (window of 60 nucleotides, value of 40% U) (see Methods). The summation of the obtained scores clearly shows that multipass membrane proteins have significantly higher values than cytoplasmic proteins in all of the test organisms (Fig. 4). Obviously, the values represent qualitative indications, and quantitative distinction between cytoplasmic and multipass membrane proteins requires optimization of both parameters (windows and values) and calibration according to the GC content of each organism. Nevertheless, even the nonrefined analysis shows clearly that the U-richness values follow the hydrophobicity values, with E. coli having the highest ratios between multipass membrane proteins and cytoplasmic proteins. Interestingly, the differences between multipass membrane proteins and cytoplasmic proteins seem to decrease through evolution, both regarding the hydrophobicity and U-richness, in a manner that fits the phylogenetic tree of life according to Carl Woese (18). One possible contribution to this tendency would be that membrane proteins have acquired more soluble domains through evolution (19, 20), thus reducing the overall proteins' hydrophobicities and the U-richness of their encoding mRNAs. This development complicates examining possible (predicted) effects of the genome GC content on the U bias. Nevertheless, we examined the situation in the extremely high GC genomes of the ancient Gram-positive bacteria Mycobacterium leprae (57.8%) and Streptomyces Coelicolor (72.1%). In these cases the distinction between mRNAs encoding multipass membrane proteins and cytoplasmic proteins is achieved by using lower U content limits (see Methods).
Fig. 4.
Overall hydrophobicity and U-richness in multipass membrane proteins vs. cytoplasmic proteins. (A) Average hydrophobicity of multipass membrane vs. cytoplasmic proteins in the indicated organisms. (B) Average U-richness in multipass membrane vs. cytoplasmic proteins of the indicated organisms. mem, membrane; cyto, cytoplasmic.
Evolution of U-Richness in Membrane Protein mRNAs.
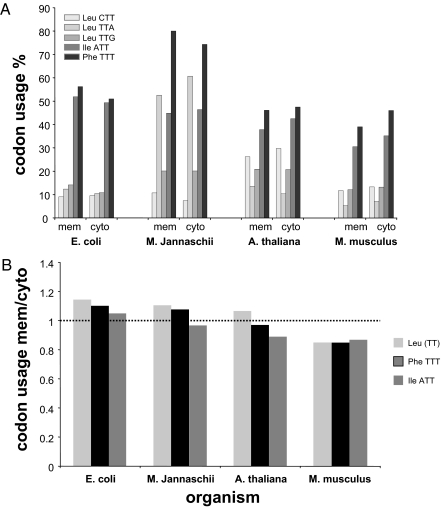
Another possible contribution to the decreased U-richness in membrane proteins of higher eukaryotes could be the reduced use of U-rich codons, even in the case of hydrophobic amino acids. To address this issue, we examined whether the membrane protein mRNAs' codon-usage preferences differ from those of mRNAs encoding cytoplasmic proteins (Fig. S1). Here we focused on the usage of U-rich codons of the 3 most hydrophobic amino acids: phenylalanine (Phe), isoleucine (Ile), and leucine (Leu). Fig. 5 shows that the genes of E. coli membrane proteins use relatively high U-rich codons for these 3 hydrophobic residues compared with cytoplasmic proteins. However, this preference decreases through evolution, given that with M. musculus a clear bias is observed for relatively U-poor codons in multipass membrane protein genes compared with cytoplasmic ones. Noteworthy is the fact that there is a lower limit to the usage of U-poor codons for these hydrophobic amino acids, which are inherently U-rich (the minimal U content is 67% in Phe and 33% in Ile or Leu). It would be interesting to perform a similar analysis only with gene segments encoding transmembrane helices, but this requires a database that is currently unavailable. Nonetheless, our observations suggest that the U-richness phenomenon in membrane proteins' genes was determined early in evolution. Because U-rich mRNAs are probably less structured and consequently less stable (21), a possible evolutionary driving force for minimizing U-richness late in evolution would be a tendency to increase the stability of mRNAs encoding membrane proteins.
Fig. 5.
T-rich Leu, Phe, and Ile codon usage in multipass membrane proteins vs. cytoplasmic proteins. (A) Codon usage of each codon for Leu, Phe, and Ile is shown for multipass membrane proteins and cytosolic proteins. (B) The cumulative codon usage of TTA + TTG + CTT [for Leu, marked as (TT)], TTT (for Phe), and ATT (for Ile) (shown separately in A) in genes encoding multipass membrane vs. cytoplasmic proteins in the indicated organisms (Table S3). The usage of all codons in multipass and cytoplasmic proteins is shown in Fig. S1. mem, membrane; cyto, cytoplasmic.
Concluding Remarks.
Taken together, our results suggest that the U-richness phenomenon represents an ancient predisposed requirement for mRNAs encoding integral membrane proteins. Why U? This question raises ancient evolutionary considerations. It is believed that DNA uses a thymine instead of U to allow discrimination against Us obtained by cytosine deamination, damage that is efficiently repaired by base excision (22). However, such damage could be repaired by alternative mismatch recognition pathways (23). In any case, our findings offer an additional explanation for the difference between DNA and mRNA if Us indeed serve as specific recognition determinants that are reserved for mRNA. Notably in this regard, there are examples of nucleic acids binding proteins that do (24) or do not discriminate between single-strand RNA and DNA (25).
In addition to the proposed early and late evolutionary implications, which we find challenging to examine experimentally, we speculate that the unique primary structures of mRNAs encoding integral membrane proteins might be distinctly recognized by presently unknown cellular factors involved in their stabilization and targeting to membranes. Whether this phenomenon is restricted to ORFs is currently unknown. Our studies do not rule out the possibility that a similar U-richness signature might also exist in untranslated regions of mRNAs, and experiments in that direction are currently in progress. In addition, searches for cellular components that specifically bind model U-rich mRNAs and attempts to identify differences between the cellular locations of newly transcribed U-rich vs. U-poor mRNAs are currently underway.
Methods
Nucleotide Distribution.
The number of either U, A, G, or C used in an indicated group of codons (whether it is a single amino acid or a group of amino acids) was divided by the overall number of nucleotides in the same group of codons.
Datasets.
Annotated Swiss-Prot (ftp://ftp.uniprot.org/pub/databases/uniprot/) entries from several organisms, classified as “multipass” membrane proteins or cytoplasmic proteins, were selected for further analysis. All of the datasets are available as Excel files upon request. The datasets include (specie/cytoplasmic proteins/multipass membrane proteins) E. coli/503/660, M. Jannaschii/116/114, A. thaliana/445/604, M. musculus/980/1438, Mycobacterium leprae/163/71, Streptomyces Coelicolor/207/55, Archaeoglobus fulgidus/99/29, Bacillus subtilis/325/382, Caenorhabditis elegans/251/382, Saccharomyces cerevisiae/535/456, and Homo sapiens/1028/1914.
Analysis of Amino Acid Usage.
For calculating average amino acid usage, annotated entries from 11 organisms (see above) were selected. Amino acid usage of each annotated Swiss-Prot entry was calculated. An average amino acid usage was computed for each group of proteins from each organism, and the ratio of usage in multipass membrane/cytoplasmic proteins was calculated (Table S1). The obtained values were averaged, yielding a ratio of amino acid usage in multipass membrane proteins/cytoplasmic proteins for all of the entries in the 11 test organisms (Table S2).
Large-Scale Hydrophobicity Analysis.
The Kyte-Doolitle hydrophobicity scale (15) was used, and each protein sequence in the Swiss-Prot datasets was scanned using a sliding 20-aa-long window. Every entry received a number indicating how many windows achieved an averaged hydrophobicity value of 1.5. The hydrophobicity values in each group of proteins were averaged and then divided by the summed protein lengths in the group. Finally, a ratio between the averaged hydrophobicity in the multipass membrane protein group and the cytoplasmic protein group of each organism was calculated.
Large-Scale U-Richness Analysis.
The corresponding Swiss-Prot entry genes were scanned using a 60-bp-long sliding window. Every entry received a number (a U-richness value) indicating how many windows contained at least 24 Us. The U-richness values in each group were averaged and then divided by the summed gene lengths in the group. Finally, a ratio between the averaged U-richness of the multipass membrane protein group and the cytoplasmic protein group of each organism was calculated. For the high GC genomes the limit of 24 Us per 60-bp-long window was reduced to 16 for S. Coelicolor and 21 for M. leprae.
Codon Usage Analysis.
Codon usage for Ile, Leu, and Phe was calculated for the combined Swiss-Prot entry genes in each group of proteins, and the ratio between usage in multipass membrane proteins and cytoplasmic proteins was calculated for each organism (Table S3).
Supplementary Material
Acknowledgments.
We thank N. Citri, D. Tawfik, O. Amster-Choder, and J. Beckwith for encouragement, advice, and helpful discussions.
Footnotes
The authors declare no conflict of interest.
This article contains supporting information online at www.pnas.org/cgi/content/full/0902029106/DCSupplemental.
References
- 1.Moore MJ. From birth to death: The complex lives of eukaryotic mRNAs. Science. 2005;309:1514–1518. doi: 10.1126/science.1111443. [DOI] [PubMed] [Google Scholar]
- 2.St. Johnston D. Moving messages: The intracellular localization of mRNAs. Nat Rev Mol Cell Biol. 2005;6:363–375. doi: 10.1038/nrm1643. [DOI] [PubMed] [Google Scholar]
- 3.Serganov A, Patel DJ. Towards deciphering the principles underlying an mRNA recognition code. Curr Opin Struct Biol. 2008;18:120–129. doi: 10.1016/j.sbi.2007.12.006. [DOI] [PMC free article] [PubMed] [Google Scholar]
- 4.Palazzo AF, et al. The signal sequence coding region promotes nuclear export of mRNA. PLoS Biol. 2007;5:2862–2874. doi: 10.1371/journal.pbio.0050322. [DOI] [PMC free article] [PubMed] [Google Scholar]
- 5.Herskovits AA, Bibi E. Association of Escherichia coli ribosomes with the inner membrane requires the signal recognition particle receptor but is independent of the signal recognition particle. Proc Natl Acad Sci USA. 2000;97:4621–4626. doi: 10.1073/pnas.080077197. [DOI] [PMC free article] [PubMed] [Google Scholar]
- 6.Herskovits AA, Shimoni E, Minsky A, Bibi E. Accumulation of endoplasmic membranes and novel membrane-bound ribosome-signal recognition particle receptor complexes in Escherichia coli. J Cell Biol. 2002;159:403–410. doi: 10.1083/jcb.200204144. [DOI] [PMC free article] [PubMed] [Google Scholar]
- 7.Herskovits AA, Bochkareva ES, Bibi E. New prospects in studying the bacterial signal recognition particle pathway. Mol Microbiol. 2000;38:927–939. doi: 10.1046/j.1365-2958.2000.02198.x. [DOI] [PubMed] [Google Scholar]
- 8.Engelman DM, Steitz TA, Goldman A. Identifying nonpolar transbilayer helices in amino acid sequences of membrane proteins. Annu Rev Biophys Biophys Chem. 1986;15:321–353. doi: 10.1146/annurev.bb.15.060186.001541. [DOI] [PubMed] [Google Scholar]
- 9.Nirenberg M. Historical review: Deciphering the genetic code—a personal account. Trends Biochem Sci. 2004;29:46–54. doi: 10.1016/j.tibs.2003.11.009. [DOI] [PubMed] [Google Scholar]
- 10.Crick FH. The origin of the genetic code. J Mol Biol. 1968;38:367–379. doi: 10.1016/0022-2836(68)90392-6. [DOI] [PubMed] [Google Scholar]
- 11.Sella G, Ardell DH. The coevolution of genes and genetic codes: Crick's frozen accident revisited. J Mol Evol. 2006;63:297–313. doi: 10.1007/s00239-004-0176-7. [DOI] [PubMed] [Google Scholar]
- 12.Pelc SR. Correlation between coding-triplets and amino-acids. Nature. 1965;207:597–599. doi: 10.1038/207597a0. [DOI] [PubMed] [Google Scholar]
- 13.Goldberg AL, Wittes RE. Genetic code: Aspects of organization. Science. 1966;153:420–424. doi: 10.1126/science.153.3734.420. [DOI] [PubMed] [Google Scholar]
- 14.Wolfenden RV, Cullis PM, Southgate CC. Water, protein folding, and the genetic code. Science. 1979;206:575–577. doi: 10.1126/science.493962. [DOI] [PubMed] [Google Scholar]
- 15.Kyte J, Doolittle RF. A simple method for displaying the hydropathic character of a protein. J Mol Biol. 1982;157:105–132. doi: 10.1016/0022-2836(82)90515-0. [DOI] [PubMed] [Google Scholar]
- 16.Froshauer S, Green GN, Boyd D, McGovern K, Beckwith J. Genetic analysis of the membrane insertion and topology of MalF, a cytoplasmic membrane protein of Escherichia coli. J Mol Biol. 1988;200:501–511. doi: 10.1016/0022-2836(88)90539-6. [DOI] [PubMed] [Google Scholar]
- 17.Bernsel A, et al. Prediction of membrane-protein topology from first principles. Proc Natl Acad Sci USA. 2008;105:7177–7181. doi: 10.1073/pnas.0711151105. [DOI] [PMC free article] [PubMed] [Google Scholar]
- 18.Woese CR. On the evolution of cells. Proc Natl Acad Sci USA. 2002;99:8742–8747. doi: 10.1073/pnas.132266999. [DOI] [PMC free article] [PubMed] [Google Scholar]
- 19.Barabote RD, et al. Extra domains in secondary transport carriers and channel proteins. Biochim Biophys Acta. 2006;1758:1557–1579. doi: 10.1016/j.bbamem.2006.06.018. [DOI] [PubMed] [Google Scholar]
- 20.Chung YJ, Krueger C, Metzgar D, Saier MH., Jr Size comparisons among integral membrane transport protein homologues in bacteria, Archaea, and Eucarya. J Bacteriol. 2001;183:1012–1021. doi: 10.1128/JB.183.3.1012-1021.2001. [DOI] [PMC free article] [PubMed] [Google Scholar]
- 21.Varani G. Exceptionally stable nucleic acid hairpins. Annu Rev Biophys Biomol Struct. 1995;24:379–404. doi: 10.1146/annurev.bb.24.060195.002115. [DOI] [PubMed] [Google Scholar]
- 22.Coulondre C, Miller JH, Farabaugh PJ, Gilbert W. Molecular basis of base substitution hotspots in Escherichia coli. Nature. 1978;274:775–780. doi: 10.1038/274775a0. [DOI] [PubMed] [Google Scholar]
- 23.Gallinari P, Jiricny J. A new class of uracil-DNA glycosylases related to human thymine-DNA glycosylase. Nature. 1966;383:735–738. doi: 10.1038/383735a0. [DOI] [PubMed] [Google Scholar]
- 24.Hall TM. Multiple modes of RNA recognition by zinc finger proteins. Curr Opin Struct Biol. 2005;15:367–373. doi: 10.1016/j.sbi.2005.04.004. [DOI] [PubMed] [Google Scholar]
- 25.Horn G, Hofweber R, Kremer W, Kalbitzer HR. Structure and function of bacterial cold shock proteins. Cell Mol Life Sci. 2007;64:1457–1470. doi: 10.1007/s00018-007-6388-4. [DOI] [PMC free article] [PubMed] [Google Scholar]
Associated Data
This section collects any data citations, data availability statements, or supplementary materials included in this article.


