Abstract
Steatosis is a critical stage in the pathology of alcoholic liver disease (ALD), and preventing steatosis could protect against later stages of ALD. PKCε has been shown to contribute to hepatic steatosis in experimental non-alcoholic fatty liver disease (NAFLD); however, the role of PKCε in ethanol-induced steatosis has not been determined. The purpose of this study was to therefore test the hypothesis that PKCε contributes to ethanol-induced steatosis. Accordingly, the effect of acute ethanol on indices of hepatic steatosis and insulin signaling were determined in PKCε knockout mice and in wild-type mice that received an antisense oligonucleotide (ASO) to knockdown PKCε expression. Acute ethanol (6 g/kg i.g.) caused a robust increase in hepatic non-esterified free fatty acids (NEFA), which peaked 1 h after ethanol exposure. This increase in NEFA was followed by elevated diacylglycerols (DAG), as well as by the concomitant activation of PKCε. Acute ethanol also changed the expression of insulin-responsive genes (i.e. increased G6Pase, downregulated GK), in a pattern indicative of impaired insulin signaling. Acute ethanol exposure subsequently caused a robust increase in hepatic triglycerides. The accumulation of triglycerides caused by ethanol was blunted in ASO-treated or in PKCε−/− mice. Taken together, these data suggest that the increase in NEFA caused by hepatic ethanol metabolism leads to an increase in DAG production via the triacylglycerol pathway. DAG then subsequently activates PKCε, which then exacerbates hepatic lipid accumulation by inducing insulin resistance. These data also suggest that PKCε plays a causal role in at least the early phases of ethanol-induced liver injury.
INTRODUCTION
Alcoholic liver disease is one of the leading causes of death in the world [1], affecting millions of people per year. From 1985 to 1992, it is estimated that over $148 billion was spent to treat people with ALD in the US alone [2]. However, due to poor understanding of the mechanisms underlying ALD, there is still no FDA-approved therapy to prevent or reverse the progression of this devastating disease. The molecular mechanisms responsible for ALD must be delineated in order to identify an effective therapy to halt or reverse the pathological changes associated with ALD.
The first histological change associated with ALD is hepatic steatosis. Whereas steatosis was once thought to be an inert pathology of ALD, more recent evidence has indicated that blunting or blocking steatosis could help prevent the progression of ALD [3–5]. It has long been established that the metabolism of alcohol directly contributes to hepatic steatosis caused by this drug [6]. Specifically, the metabolism of alcohol increases the ratio of NADH:NAD+, which subsequently inhibits β-oxidation of fatty acids by hepatocytes. Alcohol metabolism also increases the rate of esterification of fatty acids [7]. These changes in fatty acid flux caused by ethanol metabolism subsequently cause hepatic triglycerides to accumulate. However, previous studies suggest that other factors may contribute to steatosis caused by ethanol. Specifically, many pharmacologic agents and genetic alterations (e.g. knockout mice) have been shown to block hepatic steatosis in rodent models of alcohol exposure; for example, mice deficient in prooxidant-producing enzymes (e.g., NADPH oxidase and iNOS) [8,9] or LPS binding/signaling molecules (e.g., CD14, TLR4, and LBP), all have less steatosis in response to alcohol compared to wild-types [10–12]. However, these pharmacologic/genetic changes, which protected against steatosis in previous studies, had no apparent effect on alcohol metabolism. It is therefore likely alcohol metabolism is not the sole causal factor in ethanol-induced steatosis.
One alternate mechanism by which ethanol may cause steatosis is via inducing hepatic insulin resistance. It has been reported that both chronic and acute ethanol exposure cause hepatic insulin resistance in animal models [13]. The effect of impaired insulin signaling on hepatic lipid accumulation is well-documented, especially in non-alcoholic fatty liver disease (NAFLD; see [14] for review). Whereas less well-characterized, it is likely that insulin resistance causes a similar effect on lipid metabolism in alcohol-induced liver disease. Furthermore, insulin resistance is a known risk factor for the development of ALD in humans [15]. Recent work from this group has shown that the insulin-sensitizing drug, metformin, blocks fatty liver caused by ethanol exposure, supporting a link between insulin resistance and hepatic steatosis after ethanol exposure [16].
A possible mechanism by which ethanol is causing hepatic insulin resistance and the subsequent steatosis is via activating Protein Kinase C epsilon (PKCε) [14]. It is proposed that PKCε inhibits the tyrosine phosphorylation of insulin receptor substrate-2 (IRS-2) and thereby impairs hepatic insulin signaling [14]. It was recently shown that the activation of PKCε plays a causal role in hepatic insulin resistance in experimental NAFLD [17], suggesting that activation of this kinase contributes to steatosis in the human disease. Here, using an acute mouse model, the hypothesis was tested that ethanol exposure activates PKCε and that PKCε also contributes to hepatic steatosis caused by alcohol.
Materials and Methods
Animals and Treatments
Mice were housed in a pathogen-free barrier facility accredited by the Association for Assessment and Accreditation of Laboratory Animal Care and procedures were approved by the University of Louisville Institutional Animal Care and Use Committee. Six week old C57BL/6J mice were obtained from Jackson Laboratory (Bar Harbor, ME). PKCε knockout mice were a generous gift from the laboratory of Dr. Aruni Bhatnagar (University of Louisville). All knockout mice used in this study were generated by intercrossing 129SvJaexC57BL/6 hybrid PKCε+/− mice as described previously [18]. Food and tap water were ad libitum prior to experimentation.
Mice were gavaged with a bolus dose of ethanol (6 g/kg) as a 20% solution in saline [16]. Isocaloric/isovolumetric maltose-dextrin was given as a control. With this dosage, blood ethanol levels reached ~250–300 mg/dL; whereas animals were ataxic, they did not lose consciousness and there were no deaths owing to alcohol overdose. Some mice received a PKCε antisense oligonucleotide (ASO). The PKCε ASO (sequence: 5′-CTCGCAGATTTTGATCTTAA-3′) was a kind gift from Dr. Brett Monia (Isis Pharmaceuticals Inc). The method of injection for the ASO was similar to the protocol described in Samuel et al [19] but with slight modifications to account for the use of mice. Specifically, mice received the PKCε ASO or vehicle saline at a dose of 25 mg/kg (i.p.) twice a week for four weeks. Mice were sacrificed 0–12 hours after ethanol gavage. Animals were anesthetized with ketamine/xylazine (100/15 mg/kg, i.m.) and blood collected from the vena cava just prior to sacrifice. Citrated plasma was stored at −80°C until further analysis. Plasma insulin was quanitified using an ELISA kit purchased from ALPCO Diagnostics (Salem, NH). Plasma levels of glucose were determined by a glucose assay kit from BioAssay Systems (Hayward, CA). Portions of liver tissue were frozen immediately in liquid nitrogen, while others were frozen-fixed in OCT mounting media (Tissue Tek, Hatfield, PA) for subsequent sectioning and mounting on microscope slides.
Immunoblots
Western Blotting for PKCε was done as described previously [20]. Specifically, total hepatic protein was isolated from snap-frozen liver samples using isolation buffer [50 mM Tris-HCl (pH 7.5), 10 mM EGTA, and 50 mM β-mercaptoethanol] containing protease inhibitors (Roche, Penzberg, Germany). The homogenates were centrifuged at 100×G to remove the unbroken cells. The supernatant was then centrifuged at 100,000×G for 1 h at 4°C. The resulting supernatant represented the cytosolic fraction. To solubilize the pellet, the pellet was resuspended into the isolation buffer with 0.1% NP-40, and incubated 30 min on ice followed by brief sonication. All buffers used for protein extraction contained protease, tyrosine phosphatase, and serine/threonine phosphatase inhibitor cocktails (Sigma, St. Louis, MO). Respective lysates (100 μg protein/well) were separated on 10% SDS-polyacrylamide gel. Proteins were then transferred to polyvinylidene difluoride membranes using a semidry electroblotter (Amersham, Piscataway, NJ). The resulting blots were probed with antibodies against PKCε (BD Transduction Laboratories, San Jose, CA) and bands visualized with the ECL plus kit (Amersham Biosciences, Piscataway, NJ). To ensure equal loading, all blots were stained with Ponceau red.
Lipid Determinations
For hepatic lipid staining, frozen sections of liver (10 μm) were stained with oil red O (Sigma Chemical Co., St. Louis, MO) for 10 min, washed, and counter-stained with hematoxylin for 45 s. To determine hepatic triglycerides and NEFA, mouse livers were homogenized in 2× phosphate buffered saline. Tissue lipids were extracted with methanol:chloroform (1:2), dried in an evaporating centrifuge, and resuspended in 5% fat-free bovine serum albumin. Hepatic triglycerides were determined as described in Bergheim et al [16]. Colorimetric assessment of non-esterified fatty acids (NEFA) was carried out using a standard kit (Roche, Penzberg, Germany). Values were normalized to protein in homogenate prior to extraction as determined by the Bradford assay (Bio-Rad Laboratories, Hercules, CA). For the determination of hepatic DAG levels, hepatic lipids were extracted by an aqueous solution of chloroform and methanol as described by Bligh and Dyer [21]. Quantification of DAG was performed as described in Callender et al [22]. Specifically, DAG was separated from phospholipids by silica gel column chromatography with 65:35:0.7 CHCl3:CH3OH:H2O as the elution buffer. Before use, each column was plugged with glass wool and packed with 6 cm of silica gel and equilibrated with 10 ml of the eluent. To recover DAG, the first 2 ml of eluent were collected and dried in a vacuum and then resuspended in 120 μl of 9:1 CH3OH:CHCl3 with 5 μl of 100 mM CH3COONa. To evaluate the recovery of DAG during separation, all liver extracts were spiked with 100 pmoles of a known DAG standard (DAG 28:0). Samples were then analyzed by electrospray ionization mass spectrometry on a Micromass ZMD equipped with a Harvard Apparatus syringe pump at an infusion rate of 10 μl/min in a positive ionization mode at a range of m/z 20 to 2,000. Na+ adducts were used for the detection of individual DAG species. Select peaks were quantified by comparing to previously determined standards and then identified by fragmentation via ESI/MS/MS.
RNA Isolation and Real-Time RT-PCR
Message levels of select genes were detected by real-time reverse-transcriptase PCR, which is routine in this group [9,16,23]. Total RNA was extracted from liver tissue samples by a guanidium thiocyanate-based method (Tel-Test, Austin, TX). RNA concentrations were determined spectrophotometrically, and 1 μg total RNA was reverse transcribed using an AMV reverse transcriptase kit (Promega, Madison, WI) and random primers. Primers were designed using Primer 3 (Whitehead Institute for Biomedical Research, Cambridge, MA); see Table I or were purchased from Applied Biosystems as kits (Foster City, CA; PKCε). The comparative CT method was used to determine fold differences between samples and the purity of PCR products was verified by gel electrophoresis.
Table 1.
Primers and Probes used for real-time RT-PCR detection of expression
| Forward (3′-5′) | Reverse(3′-5′) | Probe(3′-5′) | |
|---|---|---|---|
| G6Pase | GGAGTCTTGTCAGGCATTGCT | TGTAGATGCCCCGGATGTG | GGCTGAAACTTTCA |
| GK | CAAGCTGCACCCGAGCTT | TGTCAGCCTGCGCACACT | AGGAGCGGTTTCAC |
| β-actin | GGCTCCCAGCACCATGAA | AGCCACCGATCCACACAGA | AAGATCATTGCTCCTCCTGAGCGCAAGTA |
G6Pase Activity
The enzymatic activity of glucose-6-phosphatase was measured by the production of phosphate from glucose-6-phosphate as described by Kaidanovich-Beilin et al [24] with minor modifications. Using a hand-held homogenizer, livers (~100 mg) were homogenized in 500 μl of 250 mM sucrose-HEPES buffer (pH 7.4). Homogenates were centrifuged for 10 min at 3000×G (4°C). To 100 μl of this supernatant, 25 μl of taurocholic acid was added and incubated on ice for 30 min. After incubation, 175 μl of homogenization buffer was mixed with this solution. A 60 μl aliquot was then mixed with 140 μl of reaction buffer (90 mM Tris HCl, pH 6.5, 14 mg/ml bovine serum albumin, 28 mM glucose-6-phosphate). This solution was then incubated at 37°C and 140 μl of stop solution (15% ice cold trichloroacetic acid) was added after 0 and 20 min. The samples were then centrifuged at 3000×G for 10 min at 4°C. To 140 μl of supernatant, phosphate reagent [5% ammonium molybdate tetrahydrate in 4 N HCl and 1% Iron (II) sulfate heptahydrate] was added. This solution was incubated at 37°C for 10 min. The difference in absorbance between the timepoints was read for each sample at 650 nm and the results were normalized to protein content.
GK Activity
The activity of glucokinase was measured by monitoring the absorbance of NADH formed from glucose-6-phosphate dehydrogenase as described by Rossetti et al [25]. Briefly, livers (~100mg) were homogenized in 1 ml of HEPES buffer (50 mM, pH 7.4) containing 100 mM KCl, 1 mM EDTA, 5 mM MgCl2, and 2.5 mM dithioerythritol. The homogenates were then centrifuged at 100,000×G for 45 min at 4°C. 50 μl of supernatant was then mixed with an ATP reagent buffer (100 mM KCl, 7.5 mM MgCl2, 5 mM ATP, 2.5 mM dithioerythritol, 10 mg/ml bovine serum albumin, 100 mM glucose, 0.5 mM NAD+, 4 units/ml of glucose-6-phosphate dehydrogenase in 50 mM HEPES buffer, pH 7.4). The absorbance of NADH was read at 340 nm at 37°C for 20 min and results normalized to protein.
Statistical analyses
Results are reported as means ± SEM (n = 4–6). ANOVA with Bonferroni’s post-hoc test or the Mann-Whitney rank sum test was used for the determination of statistical significance among treatment groups, for parametric and non-parametric data, respectively. A p value less than 0.05 was selected before the study as the level of significance.
Results
Ethanol increases hepatic lipids
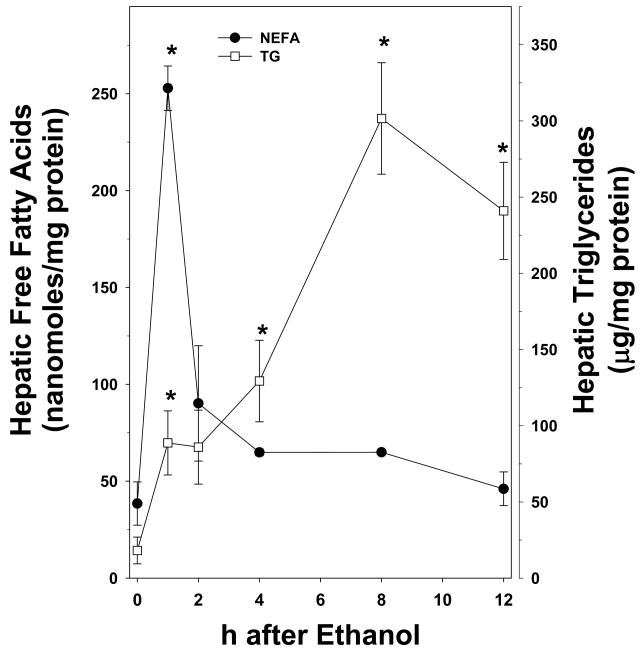
Figure 1 shows the effect of acute ethanol on hepatic triglycerides and non-esterified fatty acids (NEFA) in wild-type mice. The hepatic triglyceride content in isocaloric maltose-dextrin mice was similar to those for naïve animals. As has been observed previously (e.g., [16]), ethanol caused a progressive increase in triglycerides during the course of the study; at the 12 h timepoint, values were ~20 fold higher than maltose-dextrin controls (Figure 1, open squares). Acute ethanol also increased hepatic NEFA content, but the temporal pattern differed from the response of hepatic triglycerides. Specifically, hepatic NEFA were significantly increased by ethanol ~5 fold 1 h after exposure, and then progressively returned to basal levels by the 12 h timepoint (Figure 1, closed circles).
Figure 1. Effect of acute ethanol on hepatic triglycerides and NEFA.
Animals and treatments are described in Materials and Methods. Quantitation of triglycerides (open squares) and NEFA (closed circles) was determined via colorimetric assays. Data represent means±SEM (n=4–6) and are normalized to mg protein. *, p<0.05 compared to the absence of ethanol (t = 0 h).
Effect of ethanol on hepatic DAG levels and PKCε activation
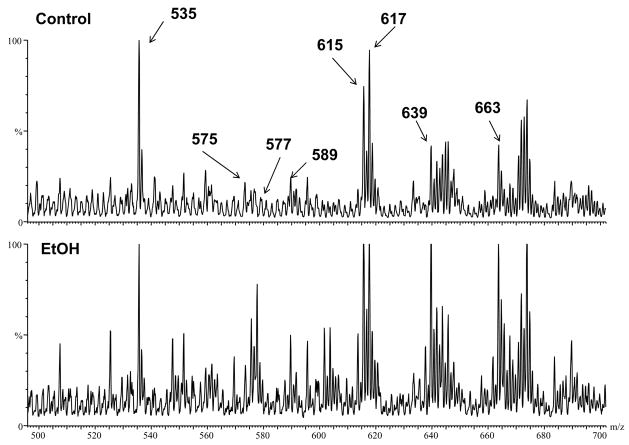
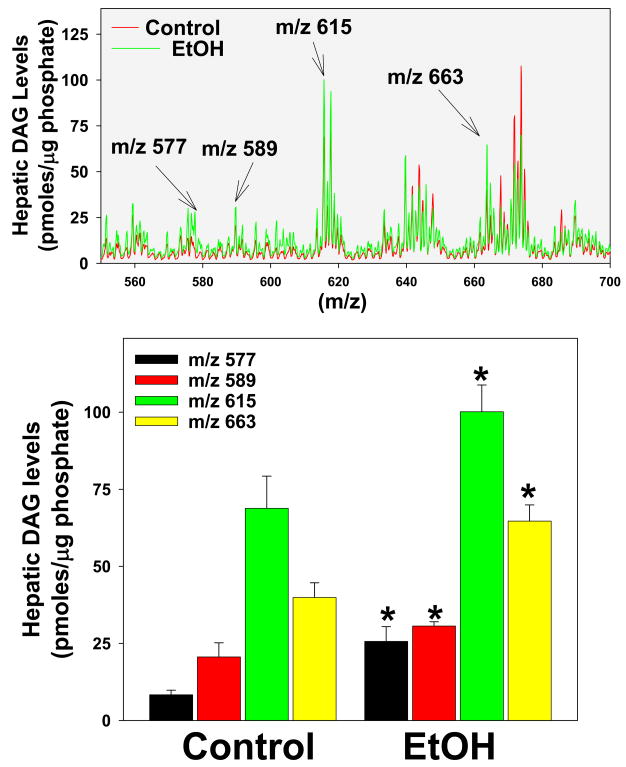
As mentioned previously, DAG are major mediators of PKCε activation [14]. Since de novo DAG synthesis requires NEFA, it was hypothesized that the increase in NEFA caused by alcohol may also increase DAG levels in the liver. Therefore, the effect of acute ethanol on hepatic DAG was determined (Figure 2 and 3). Figure 2 shows representative chromatograms from control and ethanol treated mice, while Figure 3 shows summary data. Whereas long chained DAG were in general increased 2 h after ethanol exposure (Figure 2 and 3, upper panel, not all species responded equally. The effect of ethanol on four specific DAG species was determined in Figure 3. DAG 32:1 (m/z 589), DAG 34:2 (m/z 615) and DAG 38:6 (m/z 663) were all significantly increased (~1.5 fold) due to acute ethanol. DAG 32:0 (m/z 577) with an ether linkage at the Sn1 position showed an even more robust effect of ethanol with values ~3 fold higher than controls (Figure 3). Interestingly, only long chained DAG were affected, whereas short and medium chained DAG were not increased by ethanol.
Figure 2. Effect of acute ethanol on hepatic DAG levels.
Positive electron spray ionization mass spectrums are shown from liver extracts after chromatographic separation on a silica gel column to remove polar phospholipids. 1.48 μg phosphate of sample was loaded per column. Since Na+ adducts were used to detect DAG species, the m/z value represents the molecular weight of the respective DAG plus the weight of a sodium molecule (M+Na+). Representative chromatograms of livers from control and ethanol-exposed mice are shown with peaks identified by fragmentation to be a known DAG: DAG 32:1 with an ether linkage (M+Na+=575), DAG 32:0 with an ether linkage (M+Na+=577), DAG 32:1 (M+Na+=589), DAG 34:2 (M+Na+=615), DAG 34:1 (M+Na+=617), DAG 36:4 (M+Na+=639) and DAG 38:6 (M+Na+=663). The series numbers indicate the total number of carbons in the acyl chains on the DAG molecule. The peak at m/z 535 corresponds to the internal standard (DAG 28:0).
Figure 3. Effect of acute ethanol on specific DAG species.
Quantification of DAG was performed as described in Materials and Methods. Summary data of mean results of control (red) and ethanol-exposed (green) mice are shown in the upper panel (see also Figure 2). The lower panel compares and summarizes the relative amounts of select DAG identified in the upper panel. Data represent means±SEM (n=4–6) and are normalized to μg phosphate. *, p<0.05 compared to the absence of ethanol.
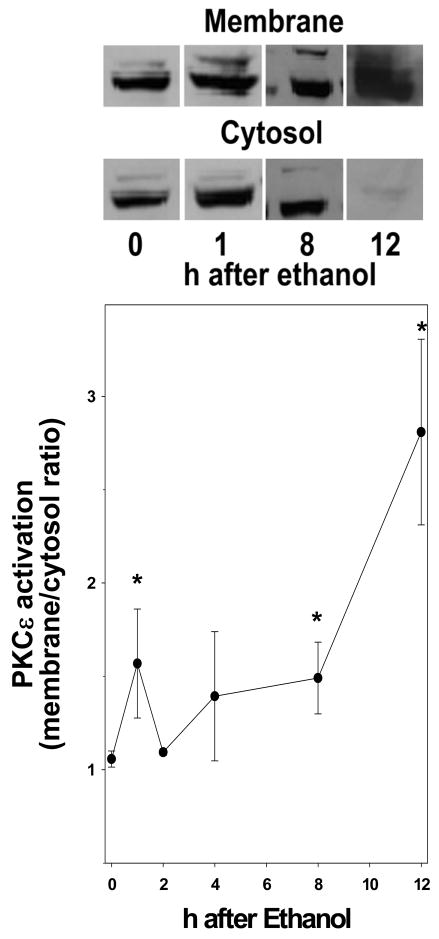
Figure 4 shows the effect of ethanol on the ratio of membrane to cytosolic PKCε. An increase in this ratio is an index of increased activation of this enzyme. Maltose dextrin administration had no significant effect on the translocation of PKCε to the membrane compared with naïve mice. At 1 h after ethanol exposure, there was a significant increase (~50%) in PKCε membrane localization. This effect diminished initially to basal levels, but then returned at 8 h and progressively increased with values ~3 fold higher than controls 12 h after ethanol exposure (Figure 4).
Figure 4. Effect of acute ethanol on the activation of PKCε in mouse liver.
Western blot of PKCε was performed as described in Materials and Methods. Representative blots are shown depicting the membrane and cytosolic fractions of PKCε. The data represent means±SEM (n=4–6). *, p<0.05 compared to the absence of ethanol (t = 0 h).
Effect of ethanol on plasma insulin and glucose and expression of insulin-responsive genes
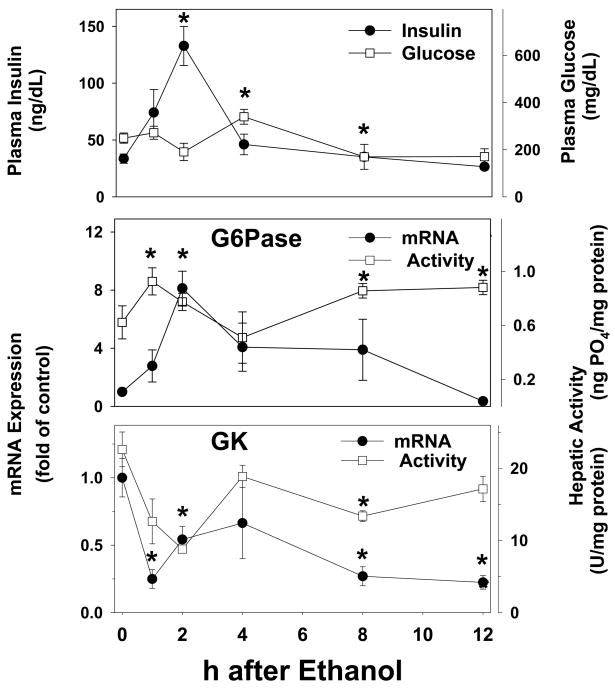
As mentioned in the Introduction, it is known that acute and chronic ethanol causes hepatic insulin resistance in rodents. For example, Onishi et al. [13] showed that bolus ethanol caused insulin resistance within 2 h after administration, as determined by both hyperinsulinemic-euglycemic clamp, as well as by the phosphorylation status of IR and IRS-1 and -2. To corroborate these previous findings under the current conditions, the effect of ethanol on surrogate markers of insulin resistance and signaling were determined. Accordingly, the effect of ethanol on plasma insulin and glucose was determined (Figure 5, upper panel). 2 h after ethanol exposure, there was a significant increase (~3 fold) in plasma insulin levels (Figure 5, upper panel, closed circles), which then progressively decreased to basal levels ~12 h after ethanol exposure. Despite this increase in plasma insulin, the concentration of plasma glucose did not significantly decrease. Indeed, ethanol caused a significant increase (~50%) in plasma glucose concentrations, 4 h after ethanol exposure (Figure 5, upper panel, open squares).
Figure 5. Effect of acute ethanol on the plasma concentrations of insulin and glucose and on the expression/activity of insulin-responsive genes in mouse liver.
Plasma concentrations of insulin (upper panel, closed circles) and glucose (upper panel, open squares) were determined by ELISA. Real-time rtPCR for G6Pase (upper panel, closed circles) and GK (lower panel, closed circles) was performed as described in Materials and Methods, and results were normalized to β-actin. G6Pase (upper panel, open squares) and GK (lower panel, open squares) protein activity was determined spectrophotometrically as described in Materials and Methods. Data are means±SEM (n=4–6) and real-time rtPCR data are reported as fold of control values. *, p<0.05 compared to the absence of ethanol (t = 0 h).
In addition to determining plasma concentrations of insulin and glucose, the effect of ethanol on the expression and activity of insulin-responsive genes was also determined. Specifically, the effect of ethanol on mRNA and protein activity of 2 key genes regulated by insulin was determined (Figure 5). Messenger RNA levels of G6Pase, which is downregulated by insulin, was significantly upregulated by ethanol (Figure 5, middle panel, closed circles) with a maximal value (~8 fold) 2 h after exposure. After the 2 h timepoint, expression progressively returned to basal with values 12 h after exposure not significantly different than controls. Bolus ethanol also caused a significant increase in hepatic G6Pase protein activity (Figure 5, middle panel, open squares), but the effect of ethanol on enzyme activity was not as robust as observed with mRNA expression. Messenger RNA levels of GK, a gene which is upregulated by insulin, was significantly decreased ~5 fold by ethanol (Figure 5, lower panel, closed circles) and this effect was maintained throughout the course of the study. GK enzyme activity was also significantly decreased by ethanol (Figure 5, lower panel, open squares), but this effect on protein activity was again less robust than observed with mRNA expression, and had recovered by ~4 h after ethanol exposure.
PKCε knockdown or knockout blunts ethanol-induced steatosis
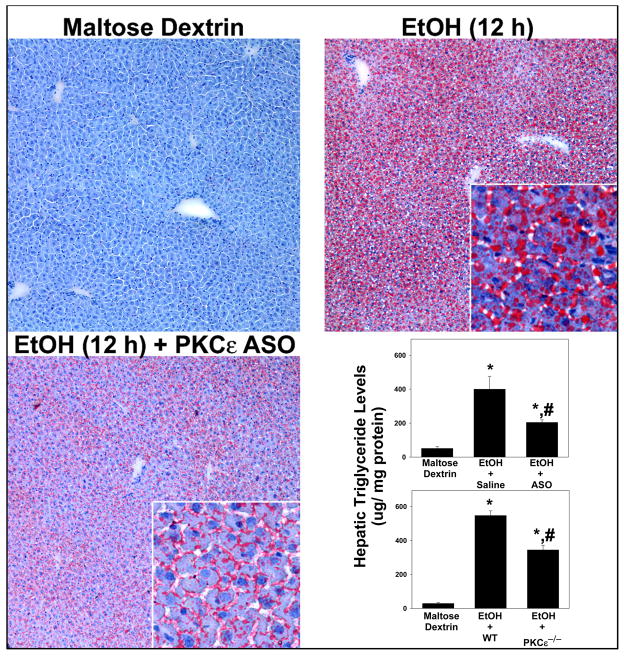
As mentioned in the Introduction, PKCε contributes to steatosis in models of NAFLD [17]. Since PKCε was activated by ethanol in the current work (Figure 4), the effect of ‘knocking-down’ PKCε with ASOs or genetic ablation of the PKCε gene (‘knockout’) on ethanol-induced steatosis was determined by oil red O staining and by quantitation of hepatic triglycerides (Figure 6). Steady state levels of PKCε mRNA in ASO-exposed mice were significantly decreased to 23.3 ± 4.7% of levels found in ethanol-exposed mice. Lipid staining from mice receiving maltose dextrin was minimal and similar to naïve chow-fed animals (Figure 6, upper left panel). Analogous to previous studies in this model [16], ethanol increased oil red O staining in the liver (Figure 6, upper right panel) with both macro- and micro-vesicular steatosis observable at the 12 h timepoint. This effect of ethanol on lipid accumulation was blunted in livers from PKCε ASO-treated mice; this protective effect in the ASO mice appeared to affect macrovesicular steatosis (large lipid droplets) more robustly than the microvesicular droplets (Figure 6, lower left panel). ASO administration also blunted the increase in triglycerides caused by ethanol by ~50%; a similar protective effect was observed in PKCε knockout mice (Figure 6, lower right).
Figure 6. Effect of PKCε ASO on ethanol-induced steatosis.
Oil red O staining was performed as described in Materials and Methods. Representative photomicrographs (200×magnification) of saline-treated wild-type mice receiving maltose-dextrin (upper right panel) and ethanol (upper left panel), as well as PKCε ASO treated-mice receiving ethanol (lower left panel) are shown. Quantitation of triglycerides (lower right panel) was performed via a colorimetric assay as described in Materials and Methods. Data represent means±SEM (n=4–6) and are normalized to mg protein. *, p<0.05 compared to the absence of ethanol; #, p<0.05 compared with wild-type or saline-treated mice exposed to ethanol.
The effect of a PKCε ASO on ethanol-induced changes on insulin-responsive genes
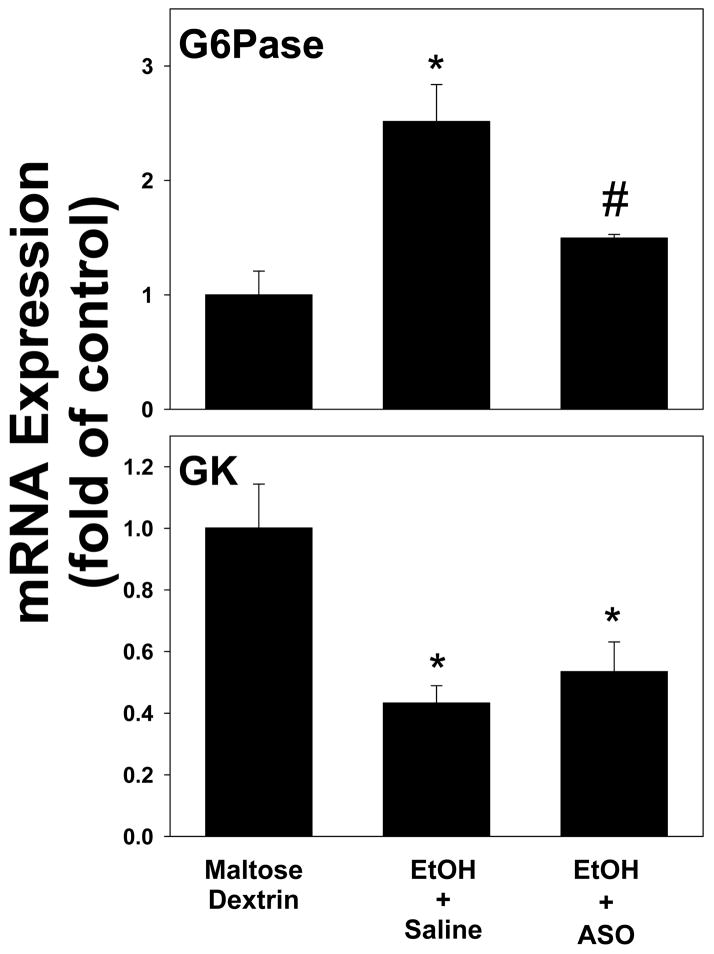
As mentioned in the Introduction, PKCε activation and insulin resistance have been linked in experimental NAFLD [17]. The effect of a knocking down PKCε on the ethanol-induced alterations in insulin-responsive genes (see Figure 5) caused by alcohol was therefore determined under these conditions (Figure 7). Pretreatment with the PKCε ASO significantly (~2 fold) blunted the upregulation of G6Pase owing to ethanol (Figure 7, upper panel); however the downregulation of GK caused by ethanol was not significantly affected in PKCε ASO-treated mice (Figure 7, lower panel).
Figure 7. The effect of the PKCε ASO on ethanol-induced changes on the expression of insulin-responsive genes 1 hour after ethanol exposure in mouse liver.
Real-time rtPCR for G6Pase (upper panel) and GK (lower panel) was performed as described in Materials and Methods, and results were normalized to β-actin. Data are means±SEM (n=4–6) and are reported as fold of control values. *, p<0.05 compared to the absence of ethanol as determined; #, p<0.05 compared with saline-treated exposed to ethanol.
Discussion
Steatosis is a critical stage in the pathology of ALD, as it has been shown that the degree of steatosis can be predictive of future stages of this disease in humans [4]. Also, the prevention of steatosis could actually protect against more severe stages of ALD such as fibrosis and cirrhosis [3]. Thus, studying the causes of lipid accumulation in this acute model is useful not only for screening new mechanisms of alcohol-induced steatosis, but it may also identify therapies to treat ALD. It was previously shown that PKCε plays a causal role in hepatic steatosis in experimental NAFLD [17]. However, the role of PKCε in ethanol-induced steatosis has not been determined and was subsequently the focus of this study. Here, using an acute model of ethanol exposure [16], results were provided that support a causal relationship between PKCε activation and ethanol-induced steatosis. First, it was demonstrated that ethanol increases the activation of PKCε, concomitant with indices of insulin resistance. Next, it was determined that the inhibition of PKCε leads to protection against insulin resistance as well as steatosis both owing to acute ethanol.
How does PKCε cause fatty liver?
One possible mechanism by which PKCε causes fatty liver is by impairing hepatic insulin signaling [14]. In previous studies, it has been shown that both acute and chronic exposure to ethanol, causes hepatic insulin resistance in rodents (e.g., [13]). To verify this effect of ethanol under these conditions, plasma levels of insulin and glucose, as well as the expression of insulin responsive genes (GK and G6Pase) were investigated. An index of insulin resistance is hyperinsulinemia as a consequence of the body no longer responding to the normal levels of insulin. Acute ethanol significantly increased (~3 fold) plasma concentrations of insulin (Figure 5, upper panel, closed circles), but had no effect on plasma glucose; this apparent inability of insulin to decrease plasma glucose under these conditions is in line with previous studies using euglycemic clamps [13]. Ethanol also changed the expression profiles of the insulin responsive genes in a manner that is suggestive of insulin resistance (Figure 5, middle/lower panel).
Specifically during times of unimpaired insulin signaling, GK expression is upregulated by insulin while G6Pase expression is downregulated. This effect of insulin contributes to the shift in the metabolism of the cell from glucose production to glucose utilization. However, Figure 5 illustrates that acute ethanol increases G6Pase expression while decreasing GK, which is a pattern opposite to that caused by insulin. Taken together, these data support the hypothesis that ethanol causes hepatic insulin resistance in vivo under the current conditions.
The effect of ethanol on insulin responsive genes was also determined in mice that received the PKCε ASO (Figure 7). Interestingly, whereas the upregulation of G6Pase caused by ethanol was almost completely blunted by the ASO, the downregulation in GK was not affected by the ASO. These data indicate that PKCε mediates some aspects of insulin resistance, but not others. This may not be surprising, given the fact that these two genes are regulated by insulin via different downstream signaling cascades [26,27]. Therefore, PKCε could inhibit the cascade that causes downregulation of G6Pase by insulin, but not be involved in the cascade that causes upregulation of GK by insulin. These results suggest that PKCε may be a causal player in part, for the impaired hepatic insulin signaling caused by this model of acute ethanol exposure.
Potential mechanism by which ethanol activates PKCε
One of the well-known metabolic effects of ethanol metabolism is an increase in the NADH:NAD+ ratio; as mentioned in the Introduction, this increased pyridine nucleotide redox ratio inhibits the β-oxidation of free fatty acids, which then causes NEFA to accumulate [6]. The rapid and robust increase in hepatic NEFA observed here (Figure 1) are likely attributable to this mechanism. DAG can be produced by a number of different mechanisms, including de novo synthesis via the triacylglycerol pathway. In addition to increasing NEFA supply for DAG synthesis, the metabolic effect of ethanol metabolism is likely to increase other metabolites that are required DAG synthesis. (e.g., dihydroxyacetone phosphate, α-glycerophosphate, etc.) [28]. For example, glyceraldehyde phosphate dehydrogenase is inhibited and glycerol-3-phosphate dehydrogenase is activated by an increase in the NADH:NAD+ ratio [29]; such an effect will be expected to cause dihydroxyacetone phosphate and α-glycerophosphate to accumulate, which would further favor DAG formation from NEFA.
The blockade of expression of PKCε was only able to confer partial protection against fatty liver owing to acute ethanol exposure. This result suggests that other mechanisms independent of PKCε are also playing a role in steatosis caused by ethanol. For example, there are many isoforms of PKC besides ε that have been shown to cause insulin resistance [30]. Therefore, it is possible that one or more of these PKC isoforms could be collaborating with PKCε to cause ethanol-induced steatosis. Alternatively, agents that cause insulin resistance through mechanisms unrelated to the PKC family could also be contributing to fatty liver owing to ethanol. Finally, it may very well be possible that the redox inhibition of the β-oxidation of free fatty acids caused by the metabolism of alcohol is responsible for the remaining steatosis that is not blunted by the PKCε ASO. Clearly, all of these possible mechanisms could be working in tandem with PKCε to cause ethanol-induced fatty liver.
Summary and Conclusions
The main goal of this work was to identify and characterize the role of PKCε in early alcohol-induced liver disease. The experiments described here suggest a potential mechanism by which PKCε is activated as well as the means by which PKCε contributes to ethanol-induced steatosis. Specifically, ethanol causes an accumulation of NEFA which then increases DAG synthesis. DAG allosterically activates PKCε, which then impairs insulin signaling and causes hepatic steatosis. Taken together, the results of this study support the hypothesis that PKCε plays a causal role in ethanol-induced steatosis. PKCε may therefore present a therapeutic target that could prevent and/or halt the progression of ALD.
Acknowledgments
This work was supported, in part, by a grant from the National Institute of Alcohol Abuse and Alcoholism (NIAAA). J. Phillip Kaiser was supported by a predoctoral (F31) fellowship from the National Institute of Alcohol Abuse and Alcoholism (NIAAA).
Abbreviations
- EtOH
ethanol
- ALD
alcoholic liver disease
- GK
glucokinase
- G6Pase
glucose-6-phosphatase
- NEFA
non esterified fatty acids
- PKCε
protein kinase c-epsilon
- DAG
diacylglycerols
- ASO
antisense oligonucleotide
- NAFLD
non alcoholic fatty liver disease
Footnotes
Publisher's Disclaimer: This is a PDF file of an unedited manuscript that has been accepted for publication. As a service to our customers we are providing this early version of the manuscript. The manuscript will undergo copyediting, typesetting, and review of the resulting proof before it is published in its final citable form. Please note that during the production process errors may be discovered which could affect the content, and all legal disclaimers that apply to the journal pertain.
Reference List
- 1.Grant BF, Dufour MC, Harford TC. Semin Liver Dis. 1988;8:12–25. doi: 10.1055/s-2008-1040525. [DOI] [PubMed] [Google Scholar]
- 2.NIAAA/NIDA. NIAAA/NIDA News Release. 1998 [Google Scholar]
- 3.Day CP, James OF. Hepatology. 1998;27:1463–1466. doi: 10.1002/hep.510270601. [DOI] [PubMed] [Google Scholar]
- 4.Sorensen TI, Orholm M, Bentsen KD, Hoybye G, Eghoje K, Christoffersen P. Lancet. 1984;2:241–244. doi: 10.1016/s0140-6736(84)90295-2. [DOI] [PubMed] [Google Scholar]
- 5.Teli MR, Day CP, Burt AD, Bennett MK, James OF. Lancet. 1995;346:987–990. doi: 10.1016/s0140-6736(95)91685-7. [DOI] [PubMed] [Google Scholar]
- 6.Tremolieres J, Lowy R, Griffaton G. Proc Nutr Soc. 1972;31:107–115. doi: 10.1079/pns19720023. [DOI] [PubMed] [Google Scholar]
- 7.Ontko JA. J Lipid Res. 1973;14:78–86. [PubMed] [Google Scholar]
- 8.Kono H, Rusyn I, Yin M, Gabele E, Yamashina S, Dikalova A, Kadiiska MB, Connor HD, Mason RP, Segal BH, Bradford BU, Holland SM, Thurman RG. J Clin Invest. 2000;106:867–872. doi: 10.1172/JCI9020. [DOI] [PMC free article] [PubMed] [Google Scholar]
- 9.McKim SE, Gabele E, Isayama F, Lambert JC, Tucker LM, Wheeler MD, Connor HD, Mason RP, Doll MA, Hein DW, Arteel GE. Gastroenterology. 2003;125:1834–1844. doi: 10.1053/j.gastro.2003.08.030. [DOI] [PubMed] [Google Scholar]
- 10.Yin M, Bradford BU, Wheeler MD, Uesugi T, Froh M, Goyert SM, Thurman RG. J Immunol. 2001;166:4737–4742. doi: 10.4049/jimmunol.166.7.4737. [DOI] [PubMed] [Google Scholar]
- 11.Uesugi T, Froh M, Arteel GE, Bradford BU, Thurman RG. Hepatology. 2001;34:101–108. doi: 10.1053/jhep.2001.25350. [DOI] [PubMed] [Google Scholar]
- 12.Uesugi T, Froh M, Arteel GE, Bradford BU, Wheeler MD, Gabele E, Isayama F, Thurman RG. J Immunol. 2002;168:2963–2969. doi: 10.4049/jimmunol.168.6.2963. [DOI] [PubMed] [Google Scholar]
- 13.Onishi Y, Honda M, Ogihara T, Sakoda H, Anai M, Fujishiro M, Ono H, Shojima N, Fukushima Y, Inukai K, Katagiri H, Kikuchi M, Oka Y, Asano T. Biochem Biophys Res Commun. 2003;303:788–794. doi: 10.1016/s0006-291x(03)00407-8. [DOI] [PubMed] [Google Scholar]
- 14.Petersen KF, Shulman GI. Am J Med. 2006;119:S10–S16. doi: 10.1016/j.amjmed.2006.01.009. [DOI] [PMC free article] [PubMed] [Google Scholar]
- 15.Day CP. Liver Int. 2006;26:1021–1028. doi: 10.1111/j.1478-3231.2006.01323.x. [DOI] [PubMed] [Google Scholar]
- 16.Bergheim I, Guo L, Davis MA, Lambert JC, Beier JI, Duveau I, Luyendyk JP, Roth RA, Arteel GE. Gastroenterology. 2006;130:2099–2112. doi: 10.1053/j.gastro.2006.03.020. [DOI] [PMC free article] [PubMed] [Google Scholar]
- 17.Samuel VT, Liu ZX, Qu X, Elder BD, Bilz S, Befroy D, Romanelli AJ, Shulman GI. J Biol Chem. 2004;279:32345–32353. doi: 10.1074/jbc.M313478200. [DOI] [PubMed] [Google Scholar]
- 18.Khasar SG, Lin YH, Martin A, Dadgar J, McMahon T, Wang D, Hundle B, Aley KO, Isenberg W, McCarter G, Green PG, Hodge CW, Levine JD, Messing RO. Neuron. 1999;24:253–260. doi: 10.1016/s0896-6273(00)80837-5. [DOI] [PMC free article] [PubMed] [Google Scholar]
- 19.Samuel VT, Liu ZX, Wang A, Beddow SA, Geisler JG, Kahn M, Zhang XM, Monia BP, Bhanot S, Shulman GI. J Clin Invest. 2007;117:739–745. doi: 10.1172/JCI30400. [DOI] [PMC free article] [PubMed] [Google Scholar]
- 20.Balafanova Z, Bolli R, Zhang J, Zheng Y, Pass JM, Bhatnagar A, Tang XL, Wang O, Cardwell E, Ping P. J Biol Chem. 2002;277:15021–15027. doi: 10.1074/jbc.M112451200. [DOI] [PubMed] [Google Scholar]
- 21.Bligh EG, Dyer WJ. Can J Biochem Physiol. 1959;37:911–917. doi: 10.1139/o59-099. [DOI] [PubMed] [Google Scholar]
- 22.Callender HL, Forrester JS, Ivanova P, Preininger A, Milne S, Brown HA. Anal Chem. 2007;79:263–272. doi: 10.1021/ac061083q. [DOI] [PubMed] [Google Scholar]
- 23.Guo L, Richardson KS, Tucker LM, Doll MA, Hein DW, Arteel GE. Hepatology. 2004;40:583–589. doi: 10.1002/hep.20369. [DOI] [PubMed] [Google Scholar]
- 24.Kaidanovich-Beilin O, Eldar-Finkelman H. J Pharmacol Exp Ther. 2006;316:17–24. doi: 10.1124/jpet.105.090266. [DOI] [PubMed] [Google Scholar]
- 25.Rossetti L, Chen W, Hu M, Hawkins M, Barzilai N, Efrat S. Am J Physiol. 1997;273:E743–E750. doi: 10.1152/ajpendo.1997.273.4.E743. [DOI] [PubMed] [Google Scholar]
- 26.Gregori C, Guillet-Deniau I, Girard J, Decaux JF, Pichard AL. FEBS Lett. 2006;580:410–414. doi: 10.1016/j.febslet.2005.12.032. [DOI] [PubMed] [Google Scholar]
- 27.Kuo M, Zilberfarb V, Gangneux N, Christeff N, Issad T. FEBS Lett. 2008;582:829–834. doi: 10.1016/j.febslet.2008.02.010. [DOI] [PubMed] [Google Scholar]
- 28.Williamson JR, Scholz R, Browning ET, Thurman RG, Fukami MH. J Biol Chem. 1969;244:5044–5054. [PubMed] [Google Scholar]
- 29.Rawat AK, Lundquist FN. Eur J Biochem. 1968;5:13–17. doi: 10.1111/j.1432-1033.1968.tb00329.x. [DOI] [PubMed] [Google Scholar]
- 30.Sampson SR, Cooper DR. Mol Genet Metab. 2006;89:32–47. doi: 10.1016/j.ymgme.2006.04.017. [DOI] [PMC free article] [PubMed] [Google Scholar]


