

Abstract
Objective
The lifetime risk of maternal mortality, which describes the cumulative loss of life due to maternal deaths over the female life course, is an important summary measure of population health. However, despite its interpretive appeal, the lifetime risk of dying from maternal causes can be defined and calculated in various ways. A clear and concise discussion of both its underlying concept and methods of measurement is badly needed.
Methods
I define and compare a variety of procedures for calculating the lifetime risk of maternal mortality. I use detailed survey data from Bangladesh in 2001 to illustrate these calculations and compare the properties of the various risk measures. Using official UN estimates of maternal mortality for 2005, I document the differences in lifetime risk derived with the various measures.
Findings
Taking sub-Saharan Africa as an example, the range of estimates for the 2005 lifetime risk extends from 3.41% to 5.76%, or from 1 in 29 to 1 in 17. The highest value resulted from the method used for producing official UN estimates for the year 2000. The measure recommended here has an intermediate value of 4.47%, or 1 in 22.
Conclusion
There are strong reasons to consider the calculation method proposed here more accurate and appropriate than earlier procedures. Accordingly, it was adopted for use in producing the 2005 UN estimates of the lifetime risk of maternal mortality. By comparison, the method used for the 2000 UN estimates appears to overestimate this important measure of population health by around 20%.
Résumé
Objectif
Le risque de décès maternel sur la durée de vie, qui désigne la probabilité de perte de vie due à la maternité en termes cumulés sur la durée de vie d’une femme, est une mesure récapitulative importante de la santé des populations. Cependant, malgré son intérêt interprétatif, le risque de décès au cours de la vie par des causes liées à la maternité se définit et se calcule de diverses façons. Une analyse claire et concise de la notion sous-jacente et des méthodes de mesure de ce paramètre s’impose donc.
Méthodes
J’ai défini et comparé diverses procédures pour calculer le risque de décès maternel sur la durée de vie. J’ai fait appel à des données d’enquête détaillées émanant du Bangladesh pour l’année 2001 pour illustrer ces calculs et comparer les qualités des diverses mesures de ce risque. Jai étayé les différences entre les valeurs du risque sur la durée de vie fournies par les diverses mesures en utilisant les estimations officielles ONU de la mortalité maternelle pour 2005.
Résultats
D’après l’exemple de l’Afrique sub-saharienne, les estimations du risque sur la durée de vie pour 2005 se situent entre 3,41 % et 5,76 % ou entre 1 sur 29 et 1 sur 17. La plus forte valeur de ce risque a été obtenue par la méthode ayant servi à établir les estimations officielles de l’ONU pour l’année 2000. Je recommande ici une valeur intermédiaire de 4,47 % ou de 1 sur 22.
Conclusion
Il existe des raisons solides pour considérer la méthode de calcul proposée dans cet article comme plus précise et plus appropriée que les procédures antérieures. Cette méthode a donc été adoptée pour produire les estimations ONU du risque de décès maternel sur la durée de vie pour 2005. Par comparaison, la méthode employée pour établir les estimations de l’ONU pour 2000 semble surestimer cette importante mesure de la santé des populations d’environ 20 %.
Resumen
Objetivo
El riesgo de mortalidad materna a lo largo de la vida, que refleja la pérdida acumulada de años de vida por defunciones maternas a lo largo del ciclo vital femenino, es un importante índice sintético de la salud de la población. Sin embargo, pese a su interés como variable interpretativa, ese riesgo de morir por causas maternas a lo largo de la vida puede definirse y calcularse de diversas maneras. Hay que iniciar cuanto antes un debate claro y conciso tanto sobre el concepto subyacente como sobre los métodos de medición.
Métodos
Se describen y comparan aquí diversos procedimientos para calcular el riesgo de mortalidad materna a lo largo de la vida. Se usaron datos encuestales detallados de Bangladesh correspondientes a 2001 para ilustrar esos cálculos y comparar las propiedades de las distintas medidas del riesgo. Usando las estimaciones oficiales de las Naciones Unidas sobre la mortalidad materna en 2005, se documentan las diferencias entre los riesgos a lo largo de la vida obtenidos con las diversas medidas.
Resultados
Tomando como ejemplo el África subsahariana, el intervalo de estimaciones para el riesgo en cuestión en 2005 se sitúa entre 3,41% y 5,76%, o entre 1/29 y 1/17. El valor superior se debe al método utilizado para generar las estimaciones oficiales de las Naciones Unidas para el año 2000. La medida que aquí se recomienda tiene un valor intermedio: 4,47%, o 1/22.
Conclusión
Hay razones contundentes para considerar que el método de cálculo aquí propuesto es más preciso y adecuado que los procedimientos anteriores. En consecuencia, fue el método adoptado para generar las estimaciones de 2005 de las Naciones Unidas sobre el riesgo de mortalidad materna a lo largo de la vida. En comparación, el método utilizado para las estimaciones de 2000 de las Naciones Unidas parece sobrestimar en aproximadamente un 20% esa importante medida de la salud de la población.
ملخص
الهدف
إن الاختطار مدى الحياة لوفيات الأمومة والذي يصف الفقدان التراكمي للحياة بسبب وفيات الأمهات طيلة حياة الأنثى، وهو قياس ملخص وهام لصحة السكان. إلا أنه ورغم قبوله في التأويل، فإن الاختطار مدى الحياة للموت بسبب أسباب تـتعلّق بالأمومة يمكن التعرف عليها وحسابها بطرق مختلفة، وتمس الحاجة لمناقشة موجزة وواضحة لكل من المفهوم الدقيق للاختطار والطرق التي يقاس بها.
الطريقة
قمت بتعريف ومقارنة مجموعة من الإجراءات لحساب الاختطار مدى الحياة لوفيات الأمومة، واستخدمت معطيات مسح في بنغلاديش عام 2001 لتوضيح هذه الحسابات ومقارنة خصائص القياسات، واستخدمت التقديرات الرسمية للأمم المتحدة لوفيات الأمهات لعام 2005، ووثقت الاختلافات في الاختطار مدى الحياة المشتق من القياسات المختلفة.
الموجودات
أخذت البلدان الواقعة جنوب الصحراء الأفريقية مثالاً، وقد تراوح فيها مجال تقدير الاختطار مدى الحياة لعام 2005 من 3.41% إلى 5.76% أو من 1 لكل 29 إلى 1 لكل 17. وقد نتجت أعلى القيم من استخدام طرق لإنتاج التقديرات الرسمية للأمم المتحدة لعام 2000. أما القياس الموصي به هنا فقيمته الوسطية 4.47% أو 1 لكل 22.
الاستنتاج
هناك أسباب قوية تجعلنا نعتبر أن طريقة الحساب المقترحة هنا أكثر دقة وملاءمة من الإجراءات التي سبقتها، وبالتالي فقد استخدمت لإنتاج تقديرات الأمم المتحدة لعام 2005، وبالمقارنة معها تبيَّن أن الطرق التي استخدمت لإنتاج تقديرات الأمم المتحدة لعام 2000 قد بالغت في تقدير أهمية هذا القياس الهام لصحة السكان بمقدار 20%.
Introduction
The importance of quantifying the loss of life caused by maternal mortality in a population is widely recognized. In 2000, the UN Millennium Declaration identified the improvement of maternal health as one of eight fundamental goals for furthering human development. As part of Millennium Development Goal 5, the UN established the target of reducing the maternal mortality ratio by three-quarters between 1990 and 2015 for all national and regional populations.1
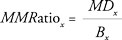
The maternal mortality ratio (MMRatio) is obtained by dividing the number of maternal deaths in a population during some time interval by the number of live births occurring in the same period. Thus, the MMRatio depicts the risk of maternal death relative to the frequency of childbearing. A related measure, the maternal mortality rate (MMRate), is found by dividing the average annual number of maternal deaths in a population by the average number of women of reproductive age (typically those aged 15 to 49 years) who are alive during the observation period. Thus, the MMRate reflects not only the risk of maternal death per pregnancy or per birth, but also the level of fertility in a population.
In addition to the MMRatio and the MMRate, the lifetime risk, or probability, of maternal death in a population is another possible measure. Whereas the MMRatio and the MMRate are measures of the frequency of maternal death in relation to the number of live births or to the female population of reproductive age, the lifetime risk of maternal mortality describes the cumulative loss of human life due to maternal death over the female life course. Because it is expressed in terms of the female life course, the lifetime risk is often preferred to the MMRatio or MMRate as a summary measure of the impact of maternal mortality.
However, despite its interpretive appeal, the lifetime risk of maternal mortality can be defined and calculated in more than one way. A clear and concise discussion of both its underlying concept and measurement methods is badly needed. This article addresses these issues and is intended to serve as a basis for official estimates of this important indicator of population health and well-being. In fact, the measure recommended here was adopted for use with the 2005 maternal mortality estimates published by the UN.2
Basic concepts
The lifetime risk, or probability, of maternal mortality could reflect at least three different underlying concepts, which can be summarized briefly as follows:
The fraction of infant females who would die eventually from maternal causes in the absence of competing causes of death from birth until menopause.
The fraction of infant females who would die eventually from maternal causes when competing causes of death are taken into account.
The fraction of adolescent females who would die eventually from maternal causes when competing causes of death are taken into account.
In formulae, these three concepts of lifetime risk can be defined as follows:
| (1) |
| (2) |
| (3) |
where each summation is over an age range, with x = 15 to 49 years. Each formula yields a probability of maternal death over some portion of the female life course, given a particular set of assumptions about other causes of death.
In these three equations, MMRatiox is the maternal mortality ratio at age x, MMRatex is the maternal mortality rate at age x, fx is the fertility rate at age x, ℓx is the number of survivors at age x in a female life table, and Lx is the number of woman-years of exposure to the risk of dying from maternal or other causes between ages x and x + 1 for the hypothetical cohort of women whose lifetime experience is depicted in the same life table. The equivalence between the two expressions in each equation follows from observing that 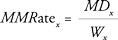 ,
,  and
and  , where, for a given time period, MDx is the number of maternal deaths occurring among women aged x, Wx is the number of woman-years of exposure at age x in the observed population (in contrast to Lx , which refers to the hypothetical population of a female life table), and Bx is the number of live births in women aged x. Therefore, MMRatex = MMRatiox × fx.
Note that LR2 and LR3 are related as follows:
| (4) |
where ℓ15/ℓ0 is the probability that a woman will survive from birth (i.e. 0 years) to age 15 years, as derived from a female life table. Equation 4 can be used for computing LR2 from LR3, or vice versa.
To understand Equation 2 better, observe that each element of the sum can be represented verbally as follows:
 |
Note that “woman-years lived at age x” refers in one case to the observed population and in the other to the hypothetical population of a female life table. Thus, the observed age-specific maternal mortality rates are applied to the fictitious life-table population as a means of constructing a synthetic measure of lifetime risk for a given time period.
Summing Equation 2 across age (i.e. x = 15 to 49 years) yields the number of maternal deaths over the life course per female live birth, or in other words, the full lifetime probability of maternal mortality, with other causes of death taken into account. A similar analysis of Equation 3 illustrates that it represents the adult lifetime probability of maternal mortality per 15-year-old female.
By contrast, Equation 1 contains the implicit assumption that the number of woman-years lived between ages x and x + 1 per female live birth (Lx/ℓ0) is one for all ages, so in effect it ignores all forms of mortality, including that from maternal causes. Thus, it is theoretically possible within this model for a woman to die more than once from a maternal cause over her lifetime (similar to having more than one birth). This imprecision is unimportant, however, since MMRatex is typically quite small at all ages, usually less than 1 per 1000, and thus higher-order terms are negligible.
Since 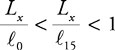 in all human life tables, it follows that:
| (5) |
Therefore, of the three concepts of lifetime risk, the first one, LR1, yields the largest probability of maternal death over a lifetime. However, this value is inflated because deaths due to other causes are ignored. If such deaths are factored into the calculation, the resulting lifetime risk of maternal death is reduced. A variant of LR1 was used for computing the lifetime risk of maternal mortality in UN estimates for the year 2000.3
The second concept, LR2, yields the smallest probability of maternal death over a lifetime, while the third concept, LR3, yields a value that lies between the other two. Both LR2 and LR3 take account of competing risks due to other causes of mortality. However, many deaths from other causes occur in childhood, before the risk of maternal death becomes relevant. If childhood deaths are eliminated from the calculation, LR3 reflects the adult lifetime risk of maternal death.
The size of the differences between the three measures in Equation 5 depends strongly on the level of overall mortality in a population. In populations with a high probability of survival to adulthood, there is very little difference between them; the three measures differ most in populations with relatively high levels of mortality from all causes, including maternal causes.
For all three concepts, the measures of lifetime risk are hypothetical in the sense that they rely on the demographic patterns observed in a population during a single period of time. Thus, they represent the lifetime risk of maternal mortality for a cohort of females who, hypothetically, are subject throughout their lives to prevailing demographic conditions, as reflected by age-specific rates of fertility and mortality, including maternal mortality. Like life expectancy at birth, they are examples of “period” measures of population characteristics as used in standard demographic analysis.4–6
Age-specific maternal mortality data
The Bangladesh Maternal Health Services and Maternal Mortality Survey of 2001 was a nationally representative survey that collected information about mortality in general and about maternal deaths in particular.7 The data presented here are based on births and deaths that occurred within interviewed households during a period of 3 years before the survey. For each reported death, information was gathered on the age and sex of the deceased. In addition, if the deceased was a woman aged 13–49 years, follow-up questions were asked to determine whether the death was due to a maternal cause.
Using such information, it was possible to compute various age-specific measures of fertility and mortality, including maternal mortality. Table 1 illustrates the results obtained when all three measures of lifetime risk were calculated for Bangladesh during 1998–2001 using data derived from the 2001 survey and Equation 1, Equation 2 and Equation 3. In these calculations, when age-specific information about maternal deaths was used to compute the lifetime risk, the value of each measure was the same whether based on MMRatiox or MMRatex.
Table 1. Illustrative calculation of three measures of the lifetime risk of maternal mortality, LR1, LR2 and LR3, based on age-specific maternal mortality data from Bangladesh for 1998–2001.
| Age range (years) | Exposure timea | Maternal deathsb | MMRatec (per 1000) | Live births | Fertility rated | MMRatioe (per 100 000) | Life-table exposure timef | LRMM |
||||||||
|---|---|---|---|---|---|---|---|---|---|---|---|---|---|---|---|---|
| Other causes of death ignoredg |
Other causes of death considered |
|||||||||||||||
| From birthh |
From age 15 yearsi |
|||||||||||||||
| LR1 | LR2 | LR3 | ||||||||||||||
| 15–19 | 90 099 | 20.501 | 0.228 | 12 068 | 0.134 | 169.9 | 4.545 | 0.0011 | 0.0010 | 0.0011 | ||||||
| 20–24 | 67 389 | 29.559 | 0.439 | 12 494 | 0.185 | 236.6 | 4.518 | 0.0022 | 0.0020 | 0.0022 | ||||||
| 25–29 | 57 605 | 30.820 | 0.535 | 8 600 | 0.149 | 358.4 | 4.485 | 0.0027 | 0.0024 | 0.0026 | ||||||
| 30–34 | 48 931 | 24.399 | 0.499 | 4 727 | 0.097 | 516.2 | 4.443 | 0.0025 | 0.0022 | 0.0024 | ||||||
| 35–39 | 40 110 | 10.490 | 0.262 | 2 130 | 0.053 | 492.5 | 4.393 | 0.0013 | 0.0011 | 0.0013 | ||||||
| 40–44 | 31 989 | 12.367 | 0.387 | 636 | 0.020 | 1945.9 | 4.337 | 0.0019 | 0.0017 | 0.0019 | ||||||
| 45–49 | 21 880 | 3.256 | 0.149 | 134 | 0.006 | 2435.4 | 4.252 | 0.0007 | 0.0006 | 0.0007 | ||||||
| Totalj | 358 007 | 131.392 | 0.367 | 40 788 | 3.222 | 322.2 | 30.972 | 0.0125 | 0.0111 | 0.0122 | ||||||
LRMM, lifetime risk of maternal mortality; MMRate, maternal mortality rate; MMRatio, maternal mortality ratio. a Exposure time is the total number of woman-years lived by the survey population during the observation period. b The numbers of maternal deaths are fractional because they were estimated from survey data using sample weights. c MMRate = maternal deaths ÷ exposure time. d Except for the total row, fertility rate = live births ÷ exposure time. e MMRatio = maternal deaths ÷ live births. f The life-table exposure time is the number of woman-years lived per female live birth derived from a life table constructed using survey data. g Except for the total row, elements of the column labelled LR1 = 5 × MMRate = 5 × fertility rate × MMRatio, showing that equivalent measures of lifetime risk can be derived using age-specific values of either the MMRate or the MMRatio. h Except for the total row, elements of the column labelled LR2 = MMRate × life-table exposure time = fertility rate × MMRatio × life-table exposure time. i All elements of the column labelled LR3 equal the corresponding element of the column labelled LR2 divided by 0.9115, where 0.9115 is the probability that a female will survive from birth to age 15 years. j Values in the total row are the sums of their respective column values except for the MMRate, fertility rate and MMRatio. The MMRate for ages 15–49 years combined equals total maternal deaths divided by total exposure time; similarly, the MMRatio for ages 15–49 years combined equals total maternal deaths divided by total live births. Finally, the sum of fertility rates by 5-year age groups is multiplied by 5 to represent the total fertility rate (TFR) or the hypothetical average number of births per woman according to the age-specific birth rates observed in the survey population, under the assumption that death does not occur before menopause. All data are from the Bangladesh Maternal Health Services and Maternal Mortality Survey of 2001.7 Data in the columns labelled Exposure time to MMRatio were taken or derived from table 3.2 of that report. The life-table exposure time and the probability that a female will survive to age 15 years (see note i) were derived by computing a female life-table using all-cause death rates as shown in table 3.8 of that report.
Summary maternal mortality data for ages 15–49 years
In most situations, the age distribution of maternal deaths is not known and information is limited to summary measures, such as the MMRatio or the MMRate, which are computed using data on maternal deaths, live births and woman-years of exposure for ages 15–49 years combined. To obtain the formulae for lifetime risk that are used in practice from Equation 1, Equation 2 and Equation 3, one must assume that either the MMRatio or the MMRate is constant across all ages.
For example, if one assumes the MMRatio is constant across all ages, Equation 1, Equation 2 and Equation 3 can be simplified as follows:
| (1a) |
| (2a) |
| (3a) |
Here, TFR is the total fertility rate, or the number of children per woman implied by age-specific fertility rates, fx , if we assume death does not occur until at least the age when menopause is reached, and NRR is the net reproduction rate, or the expected number of female children per newborn girl given current age-specific fertility and mortality rates. The factor of 2.05 in Equation 2a and Equation 3a comes from assuming a typical sex ratio at birth (i.e. 105 boys per 100 girls) and is needed here because the NRR is expressed in terms of female births only.
Alternatively, if we assume the MMRate is constant across age, the three equations become the following:
| (1b) |
| (2b) |
| (3b) |
Here, T15 – T50 is a life-table quantity representing the number of woman-years lived between ages 15 and 50 years, and the factor of 35 in Equation 1b corresponds to the reproductive interval from age 15 to 50 years. If a different reproductive interval were used for computing the MMRate, these equations would need to be modified accordingly.
These two sets of formulae can be considered as alternative approximations for Equation 1, Equation 2 and Equation 3. Their accuracy depends on the validity of the underlying assumptions: that either MMRatiox or MMRatex has a constant value across the age range. In this regard, it is clear which of the two sets of approximations is preferable: MMRatex tends to be more stable over age than MMRatiox, as illustrated in Table 1, for the population of Bangladesh between 1998 and 2001. This pattern is expected to be observed in general and follows from the relationship linking these two measures at a given age x. Recall that MMRatiox × fx = MMRatex. Thus, the relative stability of MMRatex over age occurs because the sharp age-related increase in the risk of maternal death per live birth, MMRatiox, is balanced by a sharp decline in the fertility rate, fx, at older ages.
The greater accuracy of approximations based on the MMRate is confirmed in Table 2, which shows all three measures of lifetime risk computed for Bangladesh from 1998 to 2001 using three types of information about maternal mortality: age-specific data, the MMRatio and the MMRate. The differences between rows in the table are consistent with the inequality in Equation 5. The differences between columns confirm that estimates of lifetime risk derived using age-specific data are closer to approximations derived using the MMRate than to those derived using the MMRatio. Observe that, in this example, estimates based on the MMRate have a small but consistent upward bias of around 2–3% in relative terms. However, estimates based on the MMRatio have a much larger downward bias, about 16–17%.
Table 2. Lifetime risk of maternal mortality according to three measures, LR1, LR2 and LR3, calculated using three types of information, based on maternal mortality data from Bangladesh for 1998–2001.
| Measure of LRMM | Information about maternal mortality |
||
|---|---|---|---|
| Age-specifica (%) | MMRatiob (%) | MMRatec (%) | |
| LR1 (ignoring other causes of death) | 1.25 | 1.04 | 1.28 |
| LR2 (from birth, taking into account other causes of death) | 1.11 | 0.93 | 1.14 |
| LR3 (from age 15 years, taking into account other causes of death) | 1.22 | 1.02 | 1.25 |
LRMM, lifetime risk of maternal mortality; MMRate, maternal mortality rate; MMRatio, maternal mortality ratio. a Estimates are based on age-specific data and are listed as decimal fractions in the bottom row of Table 1. b Estimates were derived from Table 1 by assuming that the MMRatio did not vary with age, according to the following formulae: LR1 = TFR × MMRatio; LR2 = 2.05 × NRR × MMRatio, and LR3 = LR2 ÷ 0.9115, where TFR and MMRatio are the total fertility rate and the MMRatio for ages 15–49 years combined from Table 1, respectively, the NRR (i.e. net reproduction rate) equals the sum over age of the age-specific fertility rates and life-table exposure times from Table 1, and 0.9115 is the probability that a female will survive from birth to age 15 years. c Estimates were derived from Table 1 by assuming that the MMRate did not vary with age, according to the following formulae: LR1 = 35 × MMRate, LR2 = (T15–T50) × MMRate, and LR3 = LR2 ÷ 0.9115, where MMRate and T15–T50 are the MMRate for ages 15–49 years combined and the total life-table exposure time from Table 1, respectively.
Finally, it is important to note that none of the lifetime risk measures in Table 2 is identical to the one used in the published report of UN maternal mortality estimates for the year 2000.3 That measure, here called LR0, equals 1.2 × LR1, as computed using Equation 1a. The factor of 1.2 was intended to serve as a means of incorporating maternal deaths associated with pregnancies that did not result in a live birth. However, this adjustment is inappropriate, since the MMRatio depicts the frequency of maternal deaths in relation to the number of live births, not the number of pregnancies.
Discussion
In summary, the choice between possible measures of the lifetime risk of maternal death has two dimensions: the desired concept of lifetime risk and the accuracy of the calculation method. Of the three concepts of lifetime risk considered here, the first should be rejected as inappropriate because it ignores other forms of mortality (i.e. competing risks) and consequently exaggerates the lifetime risk of maternal mortality. The other two concepts both take competing risks into account and differ only in terms of their starting point: either birth or age 15 years, with the latter representing an approximate minimum age of reproduction.
There seem to be few precedents to guide the choice between the second and third concepts of lifetime risk. One source defined the “lifetime risk of maternal death” as the “probability of maternal death during a woman’s reproductive lifetime”.8 This definition seems to imply a conditional probability in which the pool of women at risk should include only those who survived to the age when reproduction starts. Members of the working group that produced the UN estimates of maternal mortality for 2005 came to the same conclusion; namely, that the concept of “lifetime risk of maternal mortality” should refer to the probability of maternal death conditional on survival to age 15 years, with other forms of mortality taken into account (i.e. LR3).
Ideally, measures of lifetime risk should be computed using age-specific data. In most situations, however, one does not possess age-specific information about maternal mortality. For international comparisons, therefore, one needs a method that produces reliable results using either the MMRatio or the MMRate computed for ages 15–49 years. I have demonstrated here that MMRatex tends to be more stable as a function of age than MMRatiox and, therefore, that the MMRate yields more accurate estimates of the lifetime risk of maternal death.
Based on these two conclusions about concept and accuracy, I recommend that LR3 computed using the MMRate be used for international comparisons of the lifetime risk of maternal mortality. As noted already, this approach was used to derive the 2005 UN estimates.2
Table 3 compares estimates, for the world as a whole and for various regional groupings, of the lifetime risk of maternal mortality in 2005 derived using all the calculation methods discussed here, except those that rely on age-specific data. Taking sub-Saharan Africa as an example, the range of estimates extends from 3.41% to 5.76%, or from 1 in 29 to 1 in 17. Note that the measure of lifetime risk used for the 2000 UN estimates, LR0, gives the highest value of the lot, whereas the measure recommended here and used for the 2005 estimates (i.e. LR3 based on the MMRate) gives an intermediate value of 4.47%, or 1 in 22.
Table 3. Estimates of the lifetime risk of maternal death in 2005 for the world as a whole and for various regional and developmental groupings calculated using four risk measures, LR0, LR1, LR2 and LR3, derived using either the maternal mortality ratio (MMRatio) or the maternal mortality rate (MMRate).
| Region or development groupa | Maternal deathsb,c | Live birthsb (in thousands) | Women aged 15–49 yearsb (in thousands) | MMRatioc (per 100 000) | MMRatec (per million) | TFR | NRR | T15–T50 | ℓ15/ℓ0 | LRMMc (%) based on MMRatiod |
LRMMc (%) based on MMRatee |
|||||||||||
|---|---|---|---|---|---|---|---|---|---|---|---|---|---|---|---|---|---|---|---|---|---|---|
| LR0 | LR1 | LR2 | LR3 | LR1 | LR2 | LR3 | ||||||||||||||||
| World | 535 898 | 133 321 | 1 665 534 | 402 | 322 | 2.60 | 1.11 | 30.4 | 0.904 | 1.25 | 1.04 | 0.91 | 1.01 | 1.13 | 0.98 | 1.08 | ||||||
| More-developed regions | 1 482 | 13 319 | 299 715 | 11 | 5 | 1.57 | 0.75 | 34.2 | 0.990 | 0.02 | 0.02 | 0.02 | 0.02 | 0.02 | 0.02 | 0.02 | ||||||
| Less-developed regions | 534 416 | 120 002 | 1 365 819 | 445 | 391 | 2.82 | 1.19 | 29.9 | 0.894 | 1.51 | 1.26 | 1.08 | 1.21 | 1.37 | 1.17 | 1.31 | ||||||
| Least developed countries | 246 575 | 28 239 | 180 863 | 873 | 1363 | 4.86 | 1.79 | 25.3 | 0.816 | 5.10 | 4.25 | 3.20 | 3.92 | 4.77 | 3.46 | 4.23 | ||||||
| Other less-developed countries | 287 841 | 91 764 | 1 184 956 | 314 | 243 | 2.51 | 1.10 | 31.1 | 0.918 | 0.95 | 0.79 | 0.70 | 0.77 | 0.85 | 0.75 | 0.82 | ||||||
| Less-developed regions (excluding China) | 526 627 | 102 692 | 1 004 246 | 513 | 524 | 3.23 | 1.34 | 29.2 | 0.884 | 1.99 | 1.65 | 1.41 | 1.59 | 1.84 | 1.53 | 1.73 | ||||||
| Sub-Saharan Africa | 270 474 | 29 900 | 174 797 | 905 | 1547 | 5.31 | 1.84 | 23.0 | 0.795 | 5.76 | 4.80 | 3.41 | 4.29 | 5.42 | 3.56 | 4.47 | ||||||
| Africa | 276 135 | 33 511 | 216 429 | 824 | 1 276 | 4.83 | 1.74 | 24.3 | 0.813 | 4.77 | 3.98 | 2.93 | 3.61 | 4.47 | 3.10 | 3.81 | ||||||
| Eastern Africa | 87 105 | 11 570 | 66 680 | 753 | 1 306 | 5.41 | 1.90 | 23.1 | 0.812 | 4.89 | 4.07 | 2.93 | 3.61 | 4.57 | 3.02 | 3.72 | ||||||
| Middle Africa | 58 834 | 5 063 | 24 688 | 1 162 | 2 383 | 6.18 | 2.07 | 22.1 | 0.760 | 8.61 | 7.18 | 4.92 | 6.48 | 8.34 | 5.28 | 6.94 | ||||||
| Northern Africa | 10 952 | 4 777 | 50 501 | 229 | 217 | 3.04 | 1.36 | 31.9 | 0.939 | 0.84 | 0.70 | 0.64 | 0.68 | 0.76 | 0.69 | 0.74 | ||||||
| Southern Africa | 5 199 | 1 263 | 14 396 | 412 | 361 | 2.81 | 1.02 | 22.8 | 0.902 | 1.39 | 1.16 | 0.86 | 0.96 | 1.26 | 0.82 | 0.91 | ||||||
| Western Africa | 114 045 | 10 838 | 60 164 | 1 052 | 1 896 | 5.59 | 1.90 | 23.1 | 0.772 | 7.05 | 5.88 | 4.10 | 5.31 | 6.63 | 4.37 | 5.66 | ||||||
| Asia | 242 002 | 75 751 | 1 024 809 | 319 | 236 | 2.41 | 1.06 | 31.4 | 0.919 | 0.92 | 0.77 | 0.70 | 0.76 | 0.83 | 0.74 | 0.81 | ||||||
| Eastern Asia | 9 229 | 19 329 | 409 909 | 48 | 23 | 1.68 | 0.76 | 33.1 | 0.956 | 0.10 | 0.08 | 0.07 | 0.08 | 0.08 | 0.07 | 0.08 | ||||||
| South-central Asia | 189 569 | 39 686 | 408 753 | 478 | 464 | 3.04 | 1.30 | 30.2 | 0.890 | 1.74 | 1.45 | 1.27 | 1.43 | 1.62 | 1.40 | 1.57 | ||||||
| South-eastern Asia | 34 761 | 11 422 | 152 378 | 304 | 228 | 2.42 | 1.10 | 32.3 | 0.949 | 0.88 | 0.73 | 0.69 | 0.72 | 0.80 | 0.74 | 0.78 | ||||||
| Western Asia | 8 443 | 5 314 | 53 770 | 159 | 157 | 3.23 | 1.45 | 32.2 | 0.941 | 0.62 | 0.51 | 0.47 | 0.50 | 0.55 | 0.51 | 0.54 | ||||||
| Europe | 931 | 7 359 | 183 222 | 13 | 5 | 1.42 | 0.68 | 34.1 | 0.988 | 0.02 | 0.02 | 0.02 | 0.02 | 0.02 | 0.02 | 0.02 | ||||||
| Eastern Europe | 621 | 2 944 | 79 697 | 21 | 8 | 1.29 | 0.61 | 33.5 | 0.981 | 0.03 | 0.03 | 0.03 | 0.03 | 0.03 | 0.03 | 0.03 | ||||||
| Northern Europe | 74 | 1 060 | 22 905 | 7 | 3 | 1.66 | 0.80 | 34.5 | 0.993 | 0.01 | 0.01 | 0.01 | 0.01 | 0.01 | 0.01 | 0.01 | ||||||
| Southern Europe | 122 | 1 490 | 36 697 | 8 | 3 | 1.37 | 0.65 | 34.5 | 0.991 | 0.01 | 0.01 | 0.01 | 0.01 | 0.01 | 0.01 | 0.01 | ||||||
| Western Europe | 115 | 1 865 | 43 923 | 6 | 3 | 1.56 | 0.75 | 34.5 | 0.994 | 0.01 | 0.01 | 0.01 | 0.01 | 0.01 | 0.01 | 0.01 | ||||||
| Latin America and the Caribbean | 15 459 | 11 694 | 150 995 | 132 | 102 | 2.47 | 1.15 | 33.1 | 0.966 | 0.39 | 0.33 | 0.31 | 0.32 | 0.36 | 0.34 | 0.35 | ||||||
| Caribbean | 2 174 | 735 | 9 914 | 296 | 219 | 2.42 | 1.06 | 31.2 | 0.940 | 0.86 | 0.71 | 0.64 | 0.69 | 0.77 | 0.68 | 0.73 | ||||||
| Central America | 3 812 | 3 292 | 40 020 | 116 | 95 | 2.55 | 1.19 | 33.4 | 0.971 | 0.35 | 0.30 | 0.28 | 0.29 | 0.33 | 0.32 | 0.33 | ||||||
| South America | 9 474 | 7 666 | 101 061 | 124 | 94 | 2.44 | 1.14 | 33.2 | 0.967 | 0.36 | 0.30 | 0.29 | 0.30 | 0.33 | 0.31 | 0.32 | ||||||
| Northern America | 464 | 4 493 | 82 190 | 10 | 6 | 1.98 | 0.95 | 34.3 | 0.990 | 0.02 | 0.02 | 0.02 | 0.02 | 0.02 | 0.02 | 0.02 | ||||||
| Oceania | 907 | 513 | 7 889 | 177 | 115 | 2.27 | 1.04 | 32.7 | 0.955 | 0.48 | 0.40 | 0.38 | 0.39 | 0.40 | 0.38 | 0.39 | ||||||
LRMM, lifetime risk of maternal mortality; MMRatio, maternal mortality ratio; MMRate, maternal mortality rate; TFR, total fertility rate; NRR, net reproduction rate; T15–T50, woman-years lived between the ages of 15 and 50 years, as derived from a female life-table; ℓ15/ℓ0, probability that a female will survive from birth to age 15 years. a The regional and other groupings correspond to those used by the UN Population Division.9 b The aggregate numbers of maternal deaths, live births or women aged 15–49 years reported here may be lower than their true values as the figures shown here exclude some small populations for which no maternal mortality estimates were available. c Since the purpose here is to illustrate alternative methods of computing the LRMM, values of maternal deaths, MMRatio and MMRate, in this table are not rounded according to standard practice and there is no indication of the uncertainty associated with these estimates. For more information on such topics, please refer to the official report of the 2005 UN estimates.2 d With the assumption that the MMRatio is constant across age, the different formulae for the LRMM are as follows: LR0 = 1.2 × LR1, LR1 = TFR × MMRatio, LR2 = 2.05 × NRR × MMRatio, and LR3 = LR2 ÷ ℓ15/ℓ0. e With the assumption that the MMRate is constant across age, the different formulae for the LRMM are as follows: LR1 = 35 × MMRate, LR2 = (T15–T50) × MMRate, and LR3 = LR2 ÷ ℓ15/ℓ0. Data on maternal deaths are from the 2005 UN estimates of maternal mortality.2 Data on live births, women aged 15–49 years, TFR, NRR, T15–T50 and ℓ15/ℓ0 were taken or derived from other UN data.9
For the population groupings shown in Table 3, the measure of lifetime risk used for the 2000 UN estimates exaggerates the lifetime risk relative to the measure used for the 2005 estimates by an average of around 20%.
Thus, the two sets of estimates are not directly comparable: a trend analysis based on the 2000 and 2005 estimates of lifetime risk would exaggerate the pace of decline in some cases, while it would understate the speed of increase or reverse the direction of change in others. For this reason, and because of other changes in the methods used between the 2000 and 2005 UN studies of maternal mortality, the two sets of estimates should not be used for trend analysis. Any such analysis should focus on the 1990 and 2005 regional estimates of the MMRatio.2 ■
Acknowledgements
The analysis presented here was initiated while the author was working for the UN Population Division. The author thanks his colleagues in the Maternal Mortality Working Group for their constructive comments about this work. Special thanks to Emi Suzuki of the World Bank for assistance with data. The comments of two anonymous reviewers were very helpful.
Footnotes
Funding: Final data analysis and preparation of this article for publication were supported by a grant from the United States National Institute on Aging (R01 AG11552).
Competing interests: None declared.
References
- 1.The Millennium Development Goals report 2007 New York, NY: United Nations; 2007. [Google Scholar]
- 2.Maternal mortality in 2005: estimates developed by WHO, UNICEF, UNFPA, and the World Bank Geneva: World Health Organization; 2007. [Google Scholar]
- 3.Maternal mortality in 2000: estimates developed by WHO, UNICEF, and UNFPA Geneva: World Health Organization; 2004. [Google Scholar]
- 4.Keyfitz N, Caswell H. Applied mathematical demography, 3rd ed. New York, NY: Springer; 2005. [Google Scholar]
- 5.Preston SH, Heuveline P, Guillot M. Demography: measuring and modeling population processes Oxford: Blackwell; 2001. [Google Scholar]
- 6.Leridon H, Toulemon L. Démographie: approche statistique et dynamique des populations [in French]. Paris: Economica; 1997. [Google Scholar]
- 7.National Institute of Population Research and Training (NIPORT), ORC Macro, Johns Hopkins University and ICDDR. B. Bangladesh maternal health services and maternal mortality survey 2001 Dhaka and Calverton, MD: ORC Macro & ICDDR,B; 2003. [Google Scholar]
- 8.Ronsmans C, Graham WJ. Maternal mortality: who, when, where, and why. Lancet. 2006;368:1189–200. doi: 10.1016/S0140-6736(06)69380-X. [DOI] [PubMed] [Google Scholar]
- 9.World population prospects: the 2004 revision, extended dataset (CD-ROM edition) New York, NY: United Nations; 2005. [Google Scholar]