

Abstract
Summary: Top scoring pairs (TSPs) are pairs of genes whose relative rankings can be used to accurately classify individuals into one of two classes. TSPs have two main advantages over many standard classifiers used in gene expression studies: (i) a TSP is based on only two genes, which leads to easily interpretable and inexpensive diagnostic tests and (ii) TSP classifiers are based on gene rankings, so they are more robust to variation in technical factors or normalization than classifiers based on expression levels of individual genes. Here I describe the R package, tspair, which can be used to quickly identify and assess TSP classifiers for gene expression data.
Availability: The R package tspair is freely available from Bioconductor: http://www.bioconductor.org
Contact: jtleek@jhu.edu
1 INTRODUCTION
Classification of patients into disease groups or subtypes is the most direct way to translate microarray technology into a clinically useful tool (Quackenbush, 2006). A small number of tests based on microarrays have even been approved for clinical use, for example, for diagnosing breast cancer subtypes (Ma et al., 2004; Marchionni et al., 2008; Paik et al., 2004; van't Veer et al., 2002). But standard microarray classifiers are based on complicated functions of many gene expression measurements. This type of classifier is both hard to interpret and depends critically on the platform, pre-processing and normalization steps to be effective (Quackenbush, 2006). Identifying biologically interpretable, robust and cheap classifiers based on small subsets of genes would greatly speed progress in the development of clinical tests from microarray experiments.
Top scoring pairs (TSPs) are pairs of genes that accurately classify patients into clinically relevant groups based on their ranks (Geman et al., 2004; Tan et al., 2005; Xu et al., 2005). The basic idea is to search among all pairs of genes, and look for genes whose ranking most consistently switches between two groups. To understand how the classification scheme works, consider the simulated gene expression data in Figure 1. In this figure there are two groups of arrays, separated by the black line. These groups could represent healthy patients versus cancer patients, or two distinct subtypes of cancer. For all but one array in Group 1, Gene 1 has higher expression than Gene 2, and the reverse is true in Group 2. In this case, Genes 1 and 2 form a classifier based on their relative levels of expression. A new sample where the gene expression for Gene 1 was higher than the gene expression for Gene 2 would be classified as Group 1.
Fig. 1.

An Example of a TSP. In this simulated example, the expression for Gene 1 is higher than the expression for Gene 2 for almost all of the arrays in the group on the left and this relationship reverses for the group on the right.
The TSP approach has been successfully applied to identify subtypes of sarcoma, resulting in a RT-PCR-based test that correctly classified 20 independent tumors with perfect accuracy (Price et al., 2007). This early success suggests that it may be possible to identify TSP classifiers for other important diseases and quickly develop new inexpensive diagnostic tests.
2 THE TSPAIR PACKAGE
Calculating the TSP for a gene expression dataset is relatively straightforward, but computationally intensive. I have developed an R package tspair that can rapidly calculate the TSP for typical gene expression datasets, with tens of thousands of genes. The TSP can be calculated both in R or with an external C function, which allows both for rapid calculation and flexible development of the tspair package. The tspair package includes functions for calculating the statistical significance of a TSP by permutation test, and is fully compatible with Bioconductor expression sets. The R package is freely available from the Bioconductor web site (www.bioconductor.org).
3 AN EXAMPLE SESSION
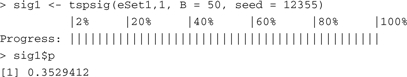
Here I present an example session on a simple simulated dataset included in the tspair package. I calculate the TSP, assess the strength of evidence for the classifier with a permutation test, plot the output and show how to predict outcomes for a new dataset. The main function in the tspair package is tspcalc(). This function accepts either (i) a gene expression matrix or an expression set and a group indicator vector, or (ii) an expression set object and a column number, indicating which column of the annotation data to use as the group indicator. The result is a tsp object which gives the TSP score, indices, gene expression data and group labels for the TSP. If there are multiple pairs that achieve the top score, then the tie-breaking score developed by Tan et al. (2005) is reported.

The function tspsig() can be used to calculate the significance of a TSP classifier by permutation as described in Geman et al. (2004). The class labels are permuted, a new TSP is calculated for each permutation, and the null scores are compared with the observed TSP score to calculate a P-value. Since the maximum score is calculated for each null permutation, tspsig() performs a test of the null hypothesis that no TSP classifier is better than random chance.
Once a TSP has been calculated, the tspplot() function can be used to visualize the classifier. The resulting TSP figure (Fig. 2) plots the expression for the first gene in the pair versus the expression for the second gene in the pair. The true group difference is indicated by the color of the points, and the score for the TSP classifier is shown in the title of the plot. The black 45○ line indicates the classification from the TSP; the better the black line separates the colors the better the accuracy of the TSP.
Fig. 2.

A TSP plot. A TSP plot for the simulated data example in the tspair package. The colors indicate the true groups, and the black line indicates the TSP classification. The black line is the line where expression for ‘Gene 5’ equals the expression for ‘Gene 338’; the classification boundary is not data-driven, it is set in advance.
![]()
A major advantage of the TSP approach is that predictions are very simple and can be easily calculated either by hand or using the built-in functionality of the tspair package. In this example, the expression value for ‘Gene5’ is greater than the expression value for ‘Gene338’ much more often for the diseased patients. In a new dataset, when the expression for ‘Gene5’ is greater than the expression for ‘Gene338’ I predict that the patient will be diseased. The tspair package can be used to predict the outcomes of new samples based on new expression data. The new data can take the form of a new expression matrix, or an expression set object. The R function predict() searches for the TSP gene names from the original tspcalc() function call, and based on the row names or featureNames of the new dataset identifies the genes to use for prediction. If multiple TSPs are reported, the default is to predict with the TSP achieving the top tie-breaking score (Tan et al., 2005), but the user may also elect to use a different TSP for prediction.
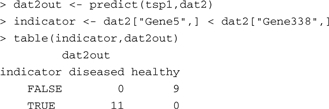
In this example, the predict() function finds the genes with labels ‘Gene5’ and ‘Gene338’ in the second dataset and calculates the TSP predictions based on the values of these two genes. The new data matrix need not be defined by a microarray, it could easily be the result of RT-PCR or any other expression assay, imported into R as a tab-delimited text file.
ACKNOWLEDGEMENTS
The author acknowledges the useful discussions with Giovanni Parmigiani, Leslie Cope, Dan Naiman and Don Geman.
Funding: National Science Foundation (DMS034211); National Institutes of Health (1UL1RR025005-01).
Conflict of Interest: none declared.
REFERENCES
- Geman D, et al. Classifying gene expression profiles from pairwise mRNA comparisons. Stat. Appl. Genet. Mol. Biol. 2004;3 doi: 10.2202/1544-6115.1071. [DOI] [PMC free article] [PubMed] [Google Scholar]
- Ma XJ, et al. A two-gene expression ratio predicts clinical outcome in breast cancer patients treated with tamoxifen. Cancer Cell. 2004;5:607–616. doi: 10.1016/j.ccr.2004.05.015. [DOI] [PubMed] [Google Scholar]
- Marchionni L, et al. Systematic review: gene expression profiling assays in early-stage breast cancer. Ann. Inter. Med. 2008;148:358–369. doi: 10.7326/0003-4819-148-5-200803040-00208. [DOI] [PubMed] [Google Scholar]
- Paik S, et al. A multigene assay to predict recurrence of tamoxifen-treated, node-negative breast cancer. N. Engl. J. Med. 2004;351:2817–2826. doi: 10.1056/NEJMoa041588. [DOI] [PubMed] [Google Scholar]
- Price ND, et al. Highly accurate two-gene classifier for differentiating gastrointestinal stromal tumors and leiomyosarcomas. Proc. Natl Acad. Sci. USA. 2007;104:3414–3419. doi: 10.1073/pnas.0611373104. [DOI] [PMC free article] [PubMed] [Google Scholar]
- Quackenbush J. Microarray analysis and tumor classification. N. Engl. J. Med. 2006;354:2463–2472. doi: 10.1056/NEJMra042342. [DOI] [PubMed] [Google Scholar]
- Tan AC, et al. Simple decision rules for classifying human cancers from gene expression profiles. Bioinformatics. 2005;21:3896–3904. doi: 10.1093/bioinformatics/bti631. [DOI] [PMC free article] [PubMed] [Google Scholar]
- van't Veer LJ, et al. Gene expression profiling predicts clinical outcome of breast cancer. Nature. 2002;415:530–536. doi: 10.1038/415530a. [DOI] [PubMed] [Google Scholar]
- Xu L, et al. Robust prostate cancer marker genes emerge from direct integration of inter-study microarray data. Bioinformatics. 2005;21:3905–3911. doi: 10.1093/bioinformatics/bti647. [DOI] [PubMed] [Google Scholar]