

The electrostatic component of the enzyme/inhibitor interaction of a wide range influenza neuraminidases and inhibitors has been analyzed using transferable aspherical-atom densities from a recently compiled databank. Results are subdivided into the contributions of individual active-site residues and different functional groups of the inhibitors, and the effect of the Arg292→Lys mutation is considered.
Keywords: electrostatic interaction energy, aspherical-atom databank, enzyme–substrate complexes, influenza neuraminidase
Abstract
Although electrostatic interactions contribute only a part of the interaction energies between macromolecules, unlike dispersion forces they are highly directional and therefore dominate the nature of molecular packing in crystals and in biological complexes and contribute significantly to differences in inhibition strength among related enzyme inhibitors. In the reported study, a wide range of complexes of influenza neuraminidases with inhibitor molecules (sialic acid derivatives and others) have been analyzed using charge densities from a transferable aspherical-atom data bank. The strongest interactions of the residues are with the acidic group at the C2 position of the inhibitor (∼−300 kJ mol−1 for —COO− in non-aromatic inhibitors, ∼−120–210 kJ mol−1 for —COO− in aromatic inhibitors and ∼−450 kJ mol−1 for —PO3 2−) and with the amino and guanidine groups at C4 (∼−250 kJ mol−1). Other groups contribute less than ∼100 kJ mol−1. Residues Glu119, Asp151, Glu227, Glu276 and Arg371 show the largest variation in electrostatic energies of interaction with different groups of inhibitors, which points to their important role in the inhibitor recognition. The Arg292→Lys mutation reduces the electrostatic interactions of the enzyme with the acidic group at C2 for all inhibitors that have been studied (SIA, DAN, 4AM, ZMR, G20, G28, G39 and BCZ), but enhances the interactions with the glycerol group at C6 for inhibitors that contain it. This is in agreement with the lower level of resistance of the mutated virus to glycerol-containing inhibitors compared with the more hydrophobic derivatives.
1. Introduction
Influenza, commonly known as flu, is still a major disease of humans and some other mammals (Hay et al., 2001 ▶). The enzyme neuraminidase (sialidase, N-acylneuraminosyl glycohydrolase; NA; EC 3.2.1.18) is responsible for viral release from infected cells and viral transport through the mucus in the respiratory tract (Meanwell & Krystal, 1996 ▶; Moscona, 2005 ▶; Palese et al., 1974 ▶). It achieves its function through the hydrolysis of the α-(2,3) or α-(2,6) glycosidic linkage between a terminal sialic acid (Fig. 1 ▶; SIA) and its adjacent carbohydrate moiety on a variety of glycoconjugates (Gottschalk, 1957 ▶) present on the surface of progeny virus particles and the infected cell.
Figure 1.

Structures of inhibitors. The colors define six distinctive regions of an inhibitor: the C2-group (black), C3-group (light green), C4-group (blue), C5-group (red), C6-group (green) and O-group (magenta).
The evaluation of the electrostatic component of the interaction between neuraminidase and a series of inhibitors, described in this paper, is based on the transferability of atomic densities, expressed as a superposition of spherical harmonic functions, between atoms in chemically identical environments. It eliminates many of the approximations that are inherent in the commonly used point-charge model. The analysis is based on a data bank of transferable atomic densities (Dominiak et al., 2007 ▶; Koritsanszky et al., 2002 ▶; Volkov, Li et al., 2004 ▶), from which the charge density of the neuraminidase–inhibitor complexes is synthesized. Electrostatic interaction energies are then evaluated using an exact algorithm for the short-range interactions and the Buckingham approximation for non-overlapping densities for atoms at large distances (Volkov, Koritsánszky et al., 2004 ▶).
2. Description of the enzyme
Biologically active NA is a homotetramer with about 470 residues per monomer, depending on the strain of the virus. Each subunit consists of a globular head domain at the end of a long stalk. All known structures of the head domain (Bossart-Whitaker et al., 1993 ▶; Burmeister et al., 1992 ▶; Varghese & Colman, 1991 ▶) have the same fold, even though the sequence identity between influenza type A and type B neuraminidase heads is approximately 30% and that among subtypes of influenza type A is about 50% (Colman, 1994 ▶).
The head domain folds into six four-stranded antiparallel β-sheets arranged in a right-handed propeller motif. The loops between β-strands arranged on one surface of the propeller form a hollow cavity near its center in which the enzymatically active site is located. In the vicinity of the active site, a high-affinity calcium-binding site is formed by residues originating from two loops. A low-affinity Ca2+ site is located along the fourfold axis of the tetramer and is likely to stabilize the tetramer.
The active site is lined by 18 highly conserved residues (Colman et al., 1993 ▶) for which both the main-chain and side-chain atoms from all NA strains superimpose very closely. There are multiple interactions between the active site and the substrate. Eight of the conserved residues, Arg118, Asp151, Arg152, Arg224, Glu276, Arg292, Arg371 and Tyr406, interact directly with the sialic acid residue of a substrate and have been called functional (shown in red in Fig. 2 ▶). The remaining ten residues (Glu119, Arg156, Ser179, Trp178, Asn/Asp198, Ile222, Glu227, Glu277, Asn294 and Glu425) stabilize the active site and are called structural (shown in blue in Fig. 2 ▶).
Figure 2.

Schematic representation of the active site of the influenza virus neuraminidase and its interaction with sialic acid (SIA) fragments. Conserved functional residues are shown in red, conserved structural residues in blue and calcium cations in green. The six distinctive regions of SIA are shown in grey envelopes. The numbering scheme is as in 1mwe (N9 NA). The scheme differs from that of Stoll et al. (2003 ▶) as it focuses on the inhibitor fragments rather than the binding sites of the enzyme.
The conservation of the active site of the influenza virus neuraminidase presents an attractive target for broad-spectrum anti-influenza drug design. Over the last two decades several potent and specific inhibitors have been developed (Sangma & Hannongbua, 2007 ▶; Liu et al., 2007 ▶). The availability of crystal structures of inhibitor–neuraminidase complexes (Bossart-Whitaker et al., 1993 ▶; Burmeister et al., 1992 ▶, 1993 ▶; Finley et al., 1999 ▶; Jedrzejas, Singh, Brouillette, Air et al., 1995 ▶; Jedrzejas, Singh, Brouillette, Laver et al., 1995 ▶; Lommer et al., 2004 ▶; Smith et al., 2001 ▶, 2002 ▶; Sudbeck et al., 1997 ▶; Taylor et al., 1998 ▶; Varghese & Colman, 1991 ▶; Varghese et al., 1992 ▶, 1995 ▶, 1997 ▶, 1998 ▶; Wang et al., 2005 ▶; White et al., 1995 ▶) now allows detailed analysis of the structural basis of inhibition. The differences in recognition of inhibitor molecules are not apparent from the structure itself, as all inhibitors bind in the same pocket and interact with the same residues in a similar fashion. Many computational methods have been applied to predict inhibition efficiency (Fornabaio et al., 2003 ▶; Steindl & Langer, 2004 ▶; Verma & Hansch, 2006 ▶; von Itzstein et al., 1996 ▶; Wang & Wade, 2001 ▶; Zhang et al., 2006 ▶; Zheng et al., 2006 ▶).
3. The importance of electrostatic interactions
The importance of electrostatic interactions in the analysis of structure–function correlations of biological molecules has recently been re-emphasized (Warshel et al., 2006 ▶). Accordingly, the electrostatic component of the interaction energy between influenza neuraminidase and its inhibitors has received extensive attention (Armstrong et al., 2006 ▶; Bonnet & Bryce, 2004 ▶, 2005 ▶; Masukawa et al., 2003 ▶; Smith et al., 2001 ▶; Wang & Wade, 2001 ▶; Warshel et al., 2006 ▶; Yi et al., 2003 ▶). While it is not the largest component of the interaction energy, it makes a dominant contribution to the relative orientation of the enzyme and substrate (Masukawa et al., 2003 ▶) and therefore to molecular recognition and substrate specificity. It should be pointed out that a comprehensive analysis of the enzyme–substrate interaction must include the contributions from solvation and desolvation of the interacting species as well as entropic factors.
4. Computational methods
4.1. Structure preparation
36 crystal structures of type A NA–inhibitor complexes (nine N2, three N6 and 24 N9) and 11 crystal structures of type B NA–inhibitor complexes were retrieved from the Protein Data Bank (Berman et al., 2000 ▶). The PDB codes of 70 complexes, the protein subtypes, mutated residues, inhibitor codes and protein and inhibitor charges together with inhibition constants (K i) when available or IC50 indexes are given in Table S1 of the supplementary material1.
The program Reduce v. 2.13.2 (Word et al., 1999 ▶) was used to add H atoms to the protein–inhibitor complexes by optimization of the hydrogen-bond network. The orientations of OH, SH, NH3 +, Met-CH3 and the Asn, Gln and His side chains were optimized. The side chains of the Arg, Lys, Asp and Glu residues were assigned as ionized. The protonation states of the His side chains were allowed to vary. Accordingly, some His residues were assigned as charged (His273 in 1b9s and 1b9v, His144 in 1inw, His104 in 1w1x:B and 1w1x:C and His274 in 1bji, 1l7f, 1l7h, 1l7g, 2qwf, 2qwg, 2qwi and 2qwk). A list of Asn, Gln and His residues in which the side-chain orientation is different from the original one and the protonated sites of His residues are given in Tables S2 and S3 of the supplementary material1. The HET groups connectivity dictionary (v.2.0, 5 November 2003) provided with the program Reduce was modified to assign the desired protonation state of the inhibitors (see Fig. 1 ▶). For the amino groups connected to the aromatic rings found in some of the inhibitors (ST2, ST3, IBA and RA2) both protonation states were tested. Similarly, for the phosphonic groups of AXP and EQP singly protonated and deprotonated states were tested (—PO3H− and —PO3 2−, respectively). X—H bond lengths were extended to the standard neutron diffraction values listed in International Tables for Crystallography (1992 ▶).
Some structures (1xoe, 1xog and 1vcj) lacked calcium ions in the vicinity of the active site, although a typical void was evident. For the 1xoe and 1xog structures the arrangement of residues Asp293, Gly297, Asp324 and Asn347 in 1l7h was used as a template calcium-binding site. Similarly, residues Asp293, Thr297, Asp324, Trp344 and Gly346 in 1ivb were used to model a missing calcium ion in 1vcj.
Only the polypeptide chain, the calcium ion near to the active site and the inhibitor were taken into account. The oligosaccharide groups, the calcium ion far from the active site and the water molecules were removed and only major conformers of the side chains were retained for the study. All protein chains were truncated at the N- and C-termini to have common ends and then capped with the neutral acetyl and methylamino blocking groups, respectively. The protein-structure comparison service SSM at the European Bioinformatics Institute (Krissinel & Henrick, 2004 ▶) was used to superimpose NA chains by multiple three-dimensional alignment in order to find the largest common fragment of the enzyme present in all complexes being studied. In the final models the N2-subtype chains start from Tyr84 and finish with Asn465 (382 amino acids; residue numbers as in 2bat), the N6-subtype chains start from Phe90 and finish with Ile473 (384 amino acids; residue numbers as in 1w1x), the N9-subtype chains start from Phe84 and finish with Glu465 (383 amino acids; residue numbers as in 1mwe) and the B-type chains start from Trp79 and finish with Ala464 (386 amino acids; residue numbers as in 1nsc).
In general water molecules were not taken into account because of the high uncertainty in the hydrogen positions. However, as some of the water molecules in the active site can significantly contribute to the protein–ligand interactions, additional calculations were carried out for complexes of N9 with ZMR, SIA, DAN and 4AM (PDB codes 1nnc, 1mwe, 1f8b and 1f8c, respectively) including three frequently considered water molecules (labeled W3, W4 and W5; Bonnet & Bryce, 2005 ▶; Maring et al., 2005 ▶; Taylor & von Itzstein, 1994 ▶; Wall et al., 1999 ▶). O-atom positions were taken directly from the .pdb files. H—O bonding lengths and the H—O—H angle were set to 0.965 Å and 108°, respectively. The water molecules were oriented such as to maximize the electrostatic interactions. The resulting orientations are illustrated in Fig. 3 ▶.
Figure 3.

Schematic representation of the interactions of the C4 group of the (a) SIA or DAN, (b) 4AM and (c) ZMR inhibitors with N9 neuraminidase and the surrounding water molecules.
The structures are referred in the text by their PDB code and (if necessary) chain identifier. Inhibitors are referred by their residue name as specified in the original .pdb file with two exceptions. The acronyms ZMR and G21 are assigned to zanamivir and dihydropyran-phenethylpropyl-carboxamide and subsequently used in the study.
Unless otherwise stated, the NA residue numbers used are those in 1mwe (N9 NA).
4.2. Electrostatic calculations
The University at Buffalo Databank (UBDB) together with the LSDB program (Dominiak et al., 2007 ▶; Volkov, Li et al., 2004 ▶) was used to reconstruct the electron-density distributions of the inhibitor–NA complexes. The UBDB is a data bank of aspherical pseudoatoms derived by Fourier-space fitting of pseudoatoms to molecular electron densities obtained from first-principle calculations. Apart from its application to the refinement of macromolecular X-ray data (Volkov et al., 2007 ▶), the UBDB is designed for the evaluation of the electrostatic properties of large molecular complexes from the reconstituted molecular electron density (Li et al., 2006 ▶). The UBDB gives accurate predictions of local and integrated properties of the electron density (Volkov, Li et al., 2004 ▶) and electrostatic interaction energies [usually within 1 kcal mol−1 of DFT (Hohenberg & Kohn, 1964 ▶) calculations at the B3LYP/6-31G** level (Volkov, King et al., 2006 ▶)].
For the current work, the UBDB was extended to include all atom types found in the inhibitor molecules being studied. The calcium ion was assigned the spherical Ca2+ electron distribution and a +2e charge. To ensure electroneutrality, all residues and inhibitor molecules were adjusted a posteriori to their net charges (Glu to −1e or Lys to +1e, for instance) by scaling the pseudoatoms according to the Faerman & Price (1990 ▶) scaling algorithm implemented in LSDB.
The EPMM method, implemented in the XDPROP module of the XD2006 package (Volkov, Macchi et al., 2006 ▶), was used to calculate electrostatic interactions from reconstructed densities. The distance of 4.2 Å was used as the boundary between the exact evaluation of the potential and the Buckingham approximation.
The electrostatic interaction energies for inhibitor–NA complexes which have been determined more than once were averaged.
5. Results and discussion
5.1. The active site of the wild type
The active site is lined by 18 highly conserved residues (Colman et al., 1993 ▶) for which both the main-chain and side-chain atoms from all NA strains superimpose very closely. There are multiple interactions between the active site and the substrate. Eight of the conserved residues, Arg118, Asp151, Arg152, Arg224, Glu276, Arg292, Arg371 and Tyr406, interact directly with the sialic acid residue of a substrate and have been called functional (indicated in red in Fig. 2 ▶). The remaining ten residues (Glu119, Arg156, Ser179, Trp178, Asn/Asp198, Ile222, Glu227, Glu277, Asn294 and Glu425) stabilize the active site and are called structural (indicated in blue in Fig. 2 ▶). Three arginines at positions 118, 292 and 371 form hydrogen bonds to the carboxylate group of sialic acid, including a planar salt bridge formed by Arg371. The sialic acid C4 hydroxyl group is in direct van der Waals contact with the acidic groups of Asp151 and forms a hydrogen bond to a buried water molecule. The Arg152 residue and another buried water molecule form hydrogen bonds to the O and N atoms of the acetamide fragment of the C5 group, respectively. The methyl group of the acetamide is surrounded by aliphatic fragments of Arg152, Ser179, Ile222 and Arg224 and the aromatic ring of Trp178. A bidentate hydrogen-bonding interaction occurs between Glu276 and two terminal hydroxyl groups of the glycerol moiety at C6. In addition to the interactions with the inhibitor, most of the charged residues directly interact with a residue of opposite charge to form hydrogen bond(s); these are Arg156 and Glu116, Arg118 and Glu425, Arg292 and Glu277, Arg224 and Glu276, and Arg152 and Asn/Asp198. In addition, a calcium ion is located about 12 Å from the active site.
As these are charged residues, NA forms strong electrostatic interactions with its inhibitors. Our results show that the total electrostatic interaction energies of inhibitor molecules interacting with neuraminidase (amino-acid residues plus proximal Ca2+ ion; E es) range from −164 to −970 kJ mol−1, with an average value of ∼−600 kJ mol−1 (Fig. 4 ▶, Table S41). The highest E es values are observed for fully deprotonated phosphonate analogs of SIA (AXP and EQP) in complexes with some NA types (−937, −916 and −970 kJ mol−1 for AXP–N2, EQP–N2 and EQP–B, respectively). Higher than average negative values of E es are observed for almost all 2,3-dihydropyranosidic ring-based inhibitors (−949 and −918 kJ mol−1 for the 4AM–N9 and 49A–N9 complexes, respectively, for example) and for G39 and BCZ. The least negative values of E es occur for NA interacting with inhibitors with aromatic central rings (−164 kJ mol−1 for the ST3–N2 complex and −349 kJ mol−1 for the ST1–N2 complex, for example).
Figure 4.
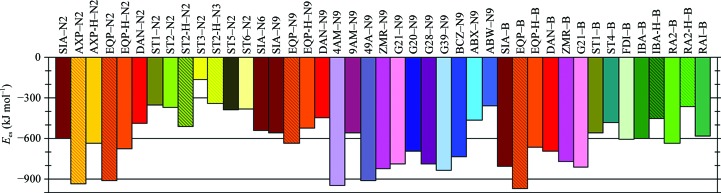
Electrostatic interaction energies (E es) of inhibitor–neuraminidase complexes.
Some NA-type dependent differences in the electrostatic energy values are observed. The absolute values of E es for EQP/EQP-H interacting with N9 NA, for example, are 20–35% smaller than for N2 or B NA complexes. This observation qualitatively agrees with experimental results showing a ten times weaker inhibitory potency of EQP against N9 when compared with other NA strains. Previously, it had been attributed to a possible difference in the dynamic properties of N9 NA in solution (White et al., 1995 ▶). On the other hand, complexes of SIA or DAN show systematically higher negative values of E es for type B NA than for type A NA. However, there is no evidence from experimental measurements that the inhibitory activities of DAN (or SIA) against type A and B neuraminidase substantially differ.
As no structural information on other inhibitors interacting with different types of neuraminidase is available in the PDB, no general conclusions on the dependence of the electrostatic interaction energy on NA type can be drawn. We therefore focus our attention on the highly conserved residues and the proximal Ca2+ ion common to all NA types. This approach is justified by the fact that the side chains of the conserved residues have reproducible spatial arrangements and that the overall orientation of the inhibitors is well preserved (Babu et al., 2000 ▶; Bossart-Whitaker et al., 1993 ▶; Taylor et al., 1998 ▶).
5.2. Contributions from individual conserved residues and different parts of the inhibitors: general considerations
The individual contributions from highly conserved residues and from the Ca2+ ion are tabulated in Table S41. The sum of the contributions from all but one conserved residue (hereafter abbreviated E es.cons) is given as well for comparison with the total (all residues and Ca2+) electrostatic energy (E es). The Asn/Asp198 residue was omitted from the summation in order to maintain neutrality. A graphical representation of the contributions from functional residues and the Ca2+ ion is presented in Fig. 5 ▶.
Figure 5.

Individual contributions from the conserved functional residues and the calcium ion to the electrostatic interaction energies of inhibitor–neuraminidase complexes (kJ mol−1).
The conserved residues account for ∼85% of the total electrostatic energies for most complexes (Table S41). It shows their importance for the electrostatic interactions of the enzyme with inhibitors and suggests that analysis of electrostatic interactions limited to the conserved residues will provide pertinent information on the whole system. Only a few exceptions are observed. These are complexes of type B NA interacting with some negatively charged inhibitors (EQP, ST1, FDI and RA2) and type A N2 NA interacting with AXP. The type B NA is the most positive NA strain considered in the current study, which explains the strong electrostatic contributions from nonconserved residues.
The Asp151, Glu119, Glu276 and Arg371 residues show a large variation in electrostatic energies with different inhibitors, which can only partly be explained by the net charge of the inhibitor. This suggests an important role of these residues in inhibitor–substituent recognition.
5.3. Contributions from different parts of the inhibitor molecules
To achieve a fuller understanding of the electrostatic interactions between neuraminidase and its inhibitors, each inhibitor molecule was divided into six distinctive regions (C2-, C3-, C4-, C5-, C6- and O-groups) as shown in the color-coded Fig. 1 ▶. The summed contributions from 17 conserved residues interacting with particular sections of the inhibitor (E es.cons.group) as well as the electrostatic energies of the whole protein (all residues and the proximal Ca2+) interacting with these sections (E es.group) are presented in Table 1 ▶, whereas contributions from individual residues interacting with particular sections of the inhibitor (E es.residue.group) are tabulated in Tables S5–S101. Each of the groups is discussed briefly in the following.
Table 1. Contributions to the electrostatic interaction energy of inhibitorNA complexes from the six distinctive regions of the inhibitors (C2-, C3-, C4-, C5-, C6- and O-groups) interacting with 17 highly conserved residues (E es.cons.group) and with the whole protein (all residues + Ca2+; E es.group).
The numberical order of the complexes is as in Table S1. Values are in kJmol1.
| Complex | C2-group | C3-group | C4-group | C5-group | C6-group | O-group | ||||||||
|---|---|---|---|---|---|---|---|---|---|---|---|---|---|---|
| No. | Inhibitor | Neuramidase | E es.cons.C2 | E es.C2 | E es.cons.C3 | E es.C3 | E es.cons.C4 | E es.C4 | E es.cons.C5 | E es.C5 | E es.cons.C6 | E es.C6 | E es.cons.O | E es.O |
| 1 | SIA | N2 | 223 | 349 | 28 | 21 | 36 | 24 | 59 | 45 | 156 | 147 | 17 | 13 |
| 2 | AXP | N2 | 369 | 696 | 22 | 15 | 39 | 30 | 107 | 90 | 85 | 83 | 7 | 23 |
| 3 | AXP-H | N2 | 242 | 396 | 25 | 16 | 42 | 33 | 104 | 92 | 87 | 80 | 7 | 23 |
| 4 | EQP | N2 | 468 | 701 | 23 | 24 | 25 | 15 | 99 | 75 | 116 | 89 | 1 | 12 |
| 5 | EQP-H | N2 | 338 | 448 | 26 | 26 | 29 | 19 | 97 | 81 | 118 | 90 | 1 | 12 |
| 6 | DAN | N2 | 178 | 249 | 4 | 3 | 44 | 29 | 94 | 78 | 142 | 114 | 6 | 15 |
| 7 | ST1 | N2 | 139 | 252 | 32 | 28 | 4 | 4 | 82 | 81 | 8 | 17 | 21 | 34 |
| 8 | ST2 | N2 | 137 | 225 | 62 | 55 | 23 | 30 | 23 | 12 | 69 | 73 | 6 | 1 |
| 9 | ST2-H | N2 | 132 | 210 | 71 | 62 | 145 | 183 | 12 | 19 | 36 | 34 | 9 | 3 |
| 10 | ST3 | N2 | 88 | 150 | 11 | 7 | 35 | 45 | 51 | 5 | 33 | 25 | 13 | 18 |
| 11 | ST3-H | N2 | 88 | 144 | 24 | 19 | 42 | 40 | 90 | 86 | 3 | 61 | 9 | 14 |
| 12, 13 | ST5 | N2 | 134 | 222 | 9 | 3 | 31 | 37 | 56 | 59 | 59 | 92 | 15 | 22 |
| 14, 15 | ST6 | N2 | 102 | 165 | 33 | 32 | 39 | 51 | 11 | 17 | 122 | 132 | 8 | 16 |
| 1627 | SIA | N6 | 221 | 300 | 28 | 20 | 44 | 39 | 70 | 69 | 91 | 90 | 7 | 20 |
| 28 | SIA | N9 | 332 | 320 | 26 | 32 | 12 | 3 | 96 | 84 | 135 | 138 | 9 | 18 |
| 30 | EQP | N9 | 432 | 410 | 18 | 23 | 31 | 25 | 85 | 76 | 121 | 112 | 3 | 13 |
| 31 | EQP-H | N9 | 290 | 279 | 21 | 27 | 36 | 31 | 84 | 81 | 123 | 118 | 3 | 13 |
| 32, 33 | DAN | N9 | 310 | 305 | 10 | 21 | 8 | 2 | 87 | 83 | 109 | 106 | 9 | 20 |
| 35 | 4AM | N9 | 336 | 333 | 7 | 16 | 289 | 369 | 92 | 98 | 180 | 177 | 2 | 13 |
| 37 | 9AM | N9 | 286 | 289 | 8 | 15 | 49 | 41 | 95 | 101 | 124 | 164 | 8 | 17 |
| 38 | 49A | N9 | 311 | 315 | 5 | 11 | 250 | 327 | 97 | 112 | 153 | 189 | 5 | 13 |
| 39 | ZMR | N9 | 303 | 301 | 6 | 15 | 255 | 331 | 57 | 68 | 156 | 155 | 6 | 16 |
| 41 | G21 | N9 | 329 | 375 | 7 | 7 | 290 | 305 | 67 | 62 | 39 | 25 | 1 | 17 |
| 43 | G20 | N9 | 293 | 335 | 8 | 5 | 239 | 261 | 61 | 57 | 48 | 26 | 5 | 10 |
| 45 | G28 | N9 | 326 | 330 | 5 | 13 | 252 | 321 | 99 | 98 | 45 | 62 | 2 | 10 |
| 47 | G39 | N9 | 337 | 399 | 32 | 29 | 308 | 319 | 95 | 90 | 22 | 1 | 14 | 1 |
| 48 | BCZ | N9 | 342 | 389 | 34 | 34 | 181 | 208 | 97 | 86 | 3 | 19 | 37 | 43 |
| 51 | ABX | N9 | 355 | 356 | 31 | 35 | 24 | 40 | 113 | 109 | 12 | 27 | 24 | 19 |
| 52 | ABW | N9 | 299 | 301 | 20 | 23 | 38 | 56 | 94 | 78 | 2 | 16 | 8 | 0 |
| 53, 54 | SIA | B | 376 | 499 | 30 | 21 | 28 | 22 | 100 | 89 | 166 | 144 | 3 | 32 |
| 55 | EQP | B | 475 | 778 | 17 | 6 | 7 | 15 | 88 | 87 | 35 | 44 | 3 | 40 |
| 56 | EQP-H | B | 348 | 484 | 20 | 5 | 10 | 16 | 87 | 82 | 37 | 37 | 3 | 40 |
| 57, 58 | DAN | B | 316 | 397 | 8 | 18 | 30 | 25 | 110 | 93 | 144 | 131 | 1 | 32 |
| 59, 60 | ZMR | B | 292 | 384 | 3 | 26 | 194 | 147 | 98 | 81 | 117 | 95 | 2 | 39 |
| 61, 62 | G21 | B | 343 | 427 | 6 | 22 | 231 | 196 | 103 | 88 | 40 | 40 | 3 | 36 |
| 63 | ST1 | B | 234 | 393 | 24 | 11 | 74 | 82 | 61 | 81 | 15 | 13 | 5 | 17 |
| 64 | ST4 | B | 202 | 345 | 41 | 27 | 46 | 34 | 39 | 52 | 107 | 53 | 9 | 24 |
| 65 | FDI | B | 208 | 495 | 11 | 6 | 19 | 16 | 5 | 56 | 45 | 55 | 11 | 21 |
| 66 | IBA | B | 256 | 435 | 19 | 12 | 27 | 23 | 294 | 274 | 74 | 120 | 14 | 23 |
| 67 | IBA-H | B | 250 | 417 | 23 | 10 | 32 | 24 | 331 | 278 | 108 | 244 | 15 | 29 |
| 68 | RA2 | B | 206 | 457 | 9 | 7 | 16 | 16 | 91 | 257 | 11 | 85 | 9 | 20 |
| 69 | RA2-H | B | 200 | 435 | 12 | 2 | 21 | 13 | 114 | 219 | 20 | 275 | 9 | 29 |
| 70 | RAI | B | 250 | 440 | 18 | 4 | 37 | 21 | 160 | 190 | 47 | 35 | 12 | 32 |
5.3.1. The C2-group
The C2-group, which includes a carboxyl or a phosphonoyl (—PO3 2− or —PO2OH−) group, dominates the inhibitor–NA electrostatic interactions (Jedrzejas, Singh, Brouillette, Laver et al., 1995 ▶; Taylor & von Itzstein, 1994 ▶; White et al., 1995 ▶). Our results indicate that the electrostatic contributions of the C2-group account for up to 60% of the value for the total electrostatic energy (E es; Table 1 ▶).
The values of E es.cons.C2 fall into three groups: non-aromatic inhibitors with a dianionic C2-group (—PO3 2−), non-aromatic inhibitors with a monoanionic C2-group (—PO2OH− or the carboxyl group) and aromatic inhibitors with a monoanionic carboxyl group.
The E es.cons.C2 energy for non-aromatic inhibitors is on average equal to −304 (53) kJ mol−1 for —COO−-containing and PO2OH−-containing groups and −436 (49) kJ mol−1 for those with the dianionic —PO3 2− group (Table 1 ▶). The dibasic phosphonoyl-group inhibitors designed by White et al. (1995 ▶) such as AXP and EQP interact more strongly than those containing the monobasic carboxyl group (see Fig. 4 ▶). In the case of the SIA–N2 and EQP–N2 complexes, for example, the difference between the values of E es.cons.C2 (−223 and −468 kJ mol−1 for SIA–N2 and EQP–N2, respectively) accounts for most of the difference in the total electrostatic interaction energies (−599 and −916 kJ mol−1 for SIA–N2 and EQP–N2, respectively). Nevertheless, EQP only shows a moderate inhibition in experimental assays, suggesting contributions from desolvation or possibly the existence of an equilibrium between the EQP–NA and EQP-H–NA complexes. The latter is supported by the relatively high pK a2 values of the phosphonoyl groups (∼6.3; White et al., 1995 ▶).
The conserved residues interact more weakly with the C2-group of aromatic inhibitors containing the carboxylic group than with non-aromatic inhibitors containing this group, with the difference being ∼30–60%. This may be a consequence of the rigidity of the aromatic ring, which may be too rigid to orient all its substituents to maximize the interaction (Chand et al., 2005 ▶).
Aromatic inhibitors with guanidine or flexible aliphatic groups at the C6 position (ST4, FDI, IBA, IBA-H, RA2, RA2-H and RAI) have twice as large an E es.cons.C2 energy as aromatic inhibitors with relatively small and rigid groups at this position (ST1, ST2, ST3, ST5 and ST6). The major role of the C3–C6-groups may be the correct positioning of C2 in the active-site arginine pocket. Fig. 6 ▶ illustrates the dependence of the E es.cons.C2 energy on the distance between the C2-group and the central arginine, Arg371, in the arginine pocket. It shows that in complexes with aromatic inhibitors the distance is systematically larger, leading to the least negative energies, confirming the poorer fitting of the inhibitor in the active site.
Figure 6.

Relation between the electrostatic interaction energy of the C2-group of the inhibitor with the conserved residues of neuraminidase, E es.cons.C2, and the distance between the C2-group of inhibitor and the central Arg371 in the arginine pocket. Distances shown are between the carboxylic C atom or P atom of the C2-group and the CZ C atom of Arg371.
As expected, the strongest interaction of the C2-group is with the charged conserved residues (see Fig. S1 of the supplementary material1). The contributions from the positively and negatively charged residues are as large as −587 kJ mol−1 for Arg371 in the EQP–N9 complex and +353 kJ mol−1 for the interaction of the C2-group with Asp151 in EQP–N2, respectively. Arg371 is a residue that forms a salt bridge with the acidic group of the inhibitor, so the large value of the interaction energy is not surprising. The Asp151 residue, which is the residue closest to the C2-group, is positioned above the inhibitor ring and in the case of sialic acid (SIA) forms a hydrogen bond to the C2 OH group. The contributions of the neutral residues average 0 (4) kJ mol−1. A more detailed analysis reveals that for residues not directly in contact with the C2-group (Arg152, Arg224, Glu276, Glu119, Arg156, Glu227, Glu277, Glu425 and Ca2+) the net charge of the C2-group derived from the UBDB correlates very well with the electrostatic interaction energy (R 2 > 0.97).
5.3.2. The C3-group
The C3-group consists of a nonsubstituted single-carbon fragment of the central ring of the inhibitor. It can be either methylene (—CH2—), methine (=CH—) or the aromatic CH group. The C3 position is not considered to be a suitable site for substitution to increase the binding affinity of an inhibitor, as there is not sufficient space in the inhibitor–NA complex to accommodate anything larger than protons at this position. The C3-group is surrounded by the Asp151, Arg118, Tyr406 and Glu119 residues. However, the electrostatic interactions with these residues never exceeds ±59 kJ mol−1 (Fig. S21). The remaining residues contribute even less. E es.cons.C3, the total electrostatic interaction energy of C3 with 17 conserved residues, averages −17 (19) kJ mol−1 (Table 1 ▶).
5.3.3. The C4-group
The C4-group can be modified to improve inhibition. Replacement of the neutral 4-OH group by positively charged substituents such as amines or guanidine significantly strengthens the inhibitor–NA interaction (von Itzstein et al., 1996 ▶). The enzyme-inhibition constant K i of the N9 NA strain with DAN, for example, decreases ∼20 times when 4-OH is replaced by 4-NH3 + (4AM) and a further ∼200 times when it is replaced by the guanidine group (ZMR) (McKimm-Breschkin et al., 1998 ▶).
The E es.cons.C4 for hydroxyl groups is calculated as −30 (18) kJ mol−1 and is as small as for —H at the same position [−32 (10) kJ mol−1] (Table 1 ▶), compared with an average of −217 (35) and −270 (30) kJ mol−1 for the charged guanidine and aliphatic amine groups, respectively.
A general conclusion regarding the interactions of amino groups at aromatic C4 cannot yet be drawn. ST2 is the only aromatic inhibitor studied that contains an amino group attached to the C4 position. The central aromatic ring of this inhibitor is rotated by ∼60°, which places the amino group towards the bottom of the active site. As the pK a2 for m-aminobenzoic acid is equal to 4.73 (1) (Jano & Hardcastle, 1999 ▶), at pH >> 5 the neutral amine dominates.
The residues which contribute the most to the interaction with C4 are Asp151, with a value of −318 kJ mol−1 for 4AM–N9 (Fig. S31), and Glu119, with −266 kJ mol−1 for 49A–N9. The electrostatic interaction energies for these two residues plus Glu227 cannot be explained only by the net charge of the group, so the higher electrostatic moments included in our analysis clearly contribute.
The electrostatic contributions of 4-amino groups are usually larger those of 4-guanidine groups. This is at variance with the ∼100-fold decrease in the inhibition strength of 4AM (amine) relative to ZMR (guanidine), which may be a consequence of the dissociation of a water molecule upon binding with the guanidine group of ZMR contributing a favorable entropic factor (Taylor et al., 1998 ▶). The electrostatic preference for 4-NH3 + over the 4-guanidine group is related to hydrogen-bond formation. Glu119 forms a 4-NH2 +—H⋯O∊ Glu119 hydrogen bond [d(N⋯O∊) = ∼2.9 Å] (where O∊ refers to one of the carboxylic O atoms of a Glu residue), resulting in a preference for 4-NH3 +. For Asp151 the difference is somewhat less pronounced since both C4-substituents form a hydrogen bond to the carboxyl group of Asp151. A weak opposite trend is observed for Glu227 (∼27 kJ mol−1) and for Trp178, as summarized in Table 2 ▶. The much larger 4-guanidine group extends further into the binding pocket towards the main-chain carbonyl O atom of Trp178 and the side-chain carboxyl group of Glu227 than the 4-amino group, which accounts for the difference.
Table 2. Averaged electrostatic energies of interaction (kJmol1) between selected residues and the C4-group containing the amino or guanidine moiety in non-aromatic inhibitors.
| Residue | 4-NH3 + | Trend | 4-Guanidine |
|---|---|---|---|
| Asp151 | 282 (27) | > | 192 (22) |
| Glu119 | 255 (9) | >> | 135 (27) |
| Glu227 | 137 (9) | 154 (19) | |
| Trp178 | 27 (2) | 67 (18) |
The neutral methyl ester groups of ABX and ABW are the only C4-substituents which have small but positive values of E es.cons.C4 (24 and 38 kJ mol−1, respectively). The largest repulsion is observed for the conserved structural residues Glu227 and Glu277 (>50 kJ mol−1). The benefits of the use of this group in inhibitor design may result from the overall better fitting of the inhibitor, which may enhance both van der Waals and electrostatic interactions in other parts of the complex.
5.3.4. The C5-group
All known inhibitors contain the acetamide fragment at C5. It is essential for binding and most probably for the correct orientation and positioning of the whole inhibitor (Brouillette et al., 1999 ▶). Although the acetamide group has no formal charge and is therefore expected to interact less, in the case of the non-aromatic inhibitors it still contributes significantly to the interaction energy [E es.cons.C5 = −91 (15) kJ mol−1 on average; Table 1 ▶]. For aromatic inhibitors, the interaction energies of the acetamide C5-group are less uniform and vary from −90 kJ mol−1 (ST3-H–N2) to −5 kJ mol−1 (FDI–B). For the more bulky acetamide-derivative C5-group of the RA2, RA2-H and RAI inhibitors, the interaction energies are slightly larger [E es.cons.C5 = −122 (35) kJ mol−1 on average]. In the case of the charged pyrrolidinone derivative in IBA and IBA-H, E es.cons.C5 reaches an average value of −312 (26) kJ mol−1.
The acetamide group forms two conserved hydrogen-bonding interactions. The O atom interacts with one of the N atoms from the guanidine group of Arg152 and the N atom interacts with a buried water molecule. Fig. 7 ▶ illustrates the dependence of the E es.cons.C5 interaction energy on the distance between the carboxy O atom of the C5-group and the donor N atom of Arg152.
Figure 7.

Relation between the electrostatic interaction energy of the C5-group and the conserved residues of neuraminidase, E es.cons.C5, and the distance between the hydrogen-bonded carboxy O atom of the C5-group and the N atom of the guanidine group of Arg152. The least-squares line through the red and pink dots in the upper left corner is drawn to guide the eye.
For acetamide groups, the Arg152 residue makes the largest contribution to the electrostatic energy, E es.Arg152.C5 = −74 (25) kJ mol−1 on average (Fig. S41), because of the above-mentioned hydrogen bonding. In the case of substituted pyrrolidinone groups, all the charged residues and Trp178 contribute significantly to interaction energies.
5.3.5. The C6-group
The C6-group shows the largest diversity in substituent type and therefore the largest variation in electrostatic interaction energies.
The glycerol side chain of SIA, AXP/AXP-H, EQP/EQP-H, DAN, 4AM and ZMR makes a contribution of E es.cons.C6 = −118 (40) kJ mol−1 on average to the interaction energy (Table 1 ▶). The most important residue for binding this substituent is Glu276 [−102 (52) kJ mol−1 on average]. Its carboxylic group forms bidentate hydrogen bonds with the glycerol hydroxyl groups.
The 9-aminoglycerol side chain of the inhibitors 9AM and 49A is among the most strongly interacting substituents with Glu276 [−417 (42) kJ mol−1; Fig. S51]; this interaction is almost as strong as that of the —PO3 2− group of AXP and EQP at C2 with the arginine-triad residues (Fig. S11). However, this interaction-energy gain is balanced by repulsions with positively charged residues, especially Arg224, and with the Ca2+ ion. As a result, the total electrostatic interaction of the 9-aminoglycerol group is rather weak and is similar to that of glycerol. Accordingly, the experimentally assessed inhibition strength of 9AM is poorer than that of DAN and that of 49A is poorer than that of 4AM. Introduction of the 9-amino group into the side chain does not change the electrostatic interaction energy and in addition increases the desolvation cost of the inhibitor.
For C6-substitutents designed to increase hydrophobic interactions (G21, G20, G28, G39, BCZ, ABX, ABW, FDI, IBA, IBA-H, RA2 and RA2-H) the interaction can be strong, but its importance cannot be assessed on the basis of electrostatics alone.
5.3.6. The O-group
The first inhibitors that were designed contain only one atom, the O atom of the pyranosidic ring, in this group and gave it its name. In newer inhibitors the oxygen has been replaced by a variety of groups, including methine (=CH—), aromatic carbon CH, furanosidic oxygen (—O—), secondary amine (—NH2 +—) and —CH(OH)—, but the name was preserved.
The O-group does not make well defined interactions with the protein. Part of the group is solvent-exposed. The three closest residues are Arg292, Glu277 and Tyr406. The first two make the largest contributions to the electrostatic interactions, which range from −82 kJ mol−1 (Arg292 in SIA–N6) to +81 kJ mol−1 (Glu277 in SIA–N6) (Fig. S61). Although on an absolute scale the contributions from individual residues might be ∼30% larger for the O-group than for the C3-group, the average E es.cons.O energy is even closer to zero [5 (10) kJ mol−1; Table 1 ▶] than that of E es.cons.C3.
It is interesting to compare ABX (containing —NH2 +—) with ABW (containing —O—). The type of O-group is the only difference between these two inhibitors. The inhibition of the N2 NA strain is ten times smaller with ABW than with ABX (Wang et al., 2005 ▶). As according to the X-ray structures ABX–N9 and ABW–N9 have very similar binding modes, it was concluded that electrostatic factors, including desolvation, must be responsible for the diminished binding of the tetrahydrofuran derivatives. Our calculations show that, surprisingly, the interaction of the —NH2 +— group with N9 NA is slightly repulsive (E es.cons.O = 32 kJ mol−1, E es.O = 19 kJ mol−1), whereas the contribution of the O atom is almost negligible (E es.cons.O = −8 kJ mol−1, E es.O = 0 kJ mol−1). However, when all groups of the inhibitor are taken into account, it becomes clear that electrostatic interactions favor ABX over ABW, the total difference being −53 kJ mol−1 for E es.cons and −105 kJ mol−1 for E es. Although this indicates that differences in the NA–inhibitor interaction are indeed important, contributions from desolvation effects must also be considered.
5.4. The proximal calcium ion
Although Ca2+ ions have been shown to stimulate the activity or/and stability of the purified neuraminidase (Burmeister et al., 1994 ▶; Chong et al., 1991 ▶; Johansson & Brett, 2003 ▶, 2006 ▶; Wilson & Rafelson, 1967 ▶), the exact role of Ca2+ in the catalysis remains unknown. Our results only touch on one aspect of the Ca2+ function, the total electrostatic interactions between the proximal Ca2+ and the inhibitors in the complex. As the Ca2+ ion is at a distance of ∼12 Å from the inhibitor, the strength of the interaction depends almost completely on the net charge of the inhibitor (Fig. 5 ▶). For the inhibitors bearing a −2e charge E es.Ca averages to −472 (14) kJ mol−1 and for those with −1e or 1e charge the absolute value is half of this [−234 (15) and 215 (9) kJ mol−1 on average, respectively], whereas for neutral inhibitors there is almost no interaction [−13 (23) kJ mol−1 on average] (Table S41). The values of E es.Ca are related to E es.Arg292 by the equation E es.Arg292 = 1.06 (3)E es.Ca + 52 (6) (the correlation coefficient R 2 is 0.97). Arg292 is located between Ca2+ and the C2-group of the inhibitor and directly interacts with the inhibitor.
The results show that the presence of Ca2+ significantly increases the binding strength of the negatively charged inhibitors and decreases that of the positively charged inhibitors. Indeed, a small decrease in the K i of DAN from 2.7 × 10⁻⁶ to 1.15 × 10⁻⁶ M after the addition of saturating Ca2+ has been reported (Chong et al., 1991 ▶). Conformational changes near the active site of NA in the absence of Ca2+ add complexity to the situation (Smith et al., 2006 ▶).
5.5. Selected water molecules in the active site
To examine the influence of water molecules in the active site, four complexes of N9 with the 4AM, DAN, SIA and ZMR inhibitors were selected. They differ mainly in the the substituent at the C4 position. Three well ordered water molecules in different bonding environments (W3, W4 and W5) located in the active site of neuraminidase, adjacent to the C4 inhibitor group (Fig. 3 ▶), were considered. The H-atom positions were derived as described in §4.1. The W3 H atoms participate in hydrogen bonding to the carbonyl O atom of Trp178 and carboxylic group of Glu227, whereas W3 accepts a hydrogen from the C4 group of the inhibitors. W4 hydrogen bonds to the carboxylic groups of Glu119 and Asp151, while one of the W4 lone electron pair points to an NH2 + H atom of the guanidine group of Arg156. W5 hydrogen bonds to the carbonyl O atoms of Trp178 and Asp151, while one of its lone pairs is the acceptor in a hydrogen bond to the NH2 + of a C4 group.
The number of water molecules in the complexes varies with the character of the C4 functional group and its volume. Only the 4AM-N9 complex shows all three water-bonding arrangements, whereas both W3 and W4 are present in DAN–N9 and SIA–N9 and W4 is the only water molecule in the ZMR–N9 complex. The W4 water, which is observed in all complexes, interacts more strongly with the protein than W3 and W5. The W4–protein electrostatic interaction energy is in the range −167 to −190 kJ mol−1, while it is about −74 kJ mol−1 for W3 and −68 kJ mol−1 for W5 (Table 3 ▶). On the other hand, the W4 interaction with the inhibitor is the weakest and depends on the nature of the substituent at C4. The W3 water molecule is present in complexes of inhibitors with a small substituent at C4, i.e. hydroxyl or amino groups (SIA, DAN and 4AM). In all three cases W3 interacts similarly with the molecular surroundings (−74 and −33 kJ mol−1 on average for W3–protein and W3–inhibitor interactions, respectively). The W5 molecule, which is only found in the complex in which a small and positively charged group is present at C4, exhibits the highest attractive interaction with the inhibitor (−67 kJ mol−1) among the analyzed water molecules.
Table 3. Electrostatic energies of interactions between water molecules (W3, W4 or W5), the protein (P, all amino-acid residues) and the inhibitor (I) (kJmol1).
| Complex | PW3 | IW3 | PW4 | IW4 | PW5 | IW5 | W3W5 |
|---|---|---|---|---|---|---|---|
| N9SIA | 73 | 34 | 174 | 17 | |||
| N9DAN | 75 | 29 | 190 | 18 | |||
| N94AM | 75 | 35 | 171 | 22 | 68 | 67 | 13 |
| N9ZMR | 167 | 5 |
As pointed out previously (von Itzstein et al., 1996 ▶; Wall et al., 1999 ▶), the expulsion of water W3 (and probably W5) from the active site of neuraminidase by the guanidine group of ZMR increases the binding interaction through an entropy gain. This is consistent with the fact that ZMR is a slow-binding inhibitor (Pegg & von Itzstein, 1994 ▶). The electrostatic energy lost by water dissociation upon binding ZMR in the active site equals about 142 kJ mol−1 for W3 and W5. This value is still lower than the gain in the electrostatic protein–inhibitor interaction energy upon the replacement of DAN (or SIA) with the ZMR inhibitor, which is 263 kJ mol−1 (or 166 kJ mol−1). This suggests that the ZMR complex not only interacts more strongly with the protein molecule than other inhibitors, but also that this interaction is strong enough to outweigh the energy lost on water dissociation.
While the electrostatic gain of water binding is not negligible, its effect is balanced by an entropy gain on dissociation. To evaluate the net effect of water binding, both factors must be taken into account.
5.6. The effect of the Arg292→Lys mutation
As drug-induced mutations of the influenza virus increase its inhibitor resistance, in vitro studies of the mutations have been conducted. The Arg292→Lys mutant of the N9 subtype of NA was isolated after prolonged exposure of the virus to the G20 inhibitor (McKimm-Breschkin et al., 1998 ▶). This drug-resistant mutant has also been isolated by exposing N2 NA-containing viruses to the ZMR (Gubareva et al., 1997 ▶) or G39 (Carr et al., 2002 ▶; Tai et al., 1998 ▶) inhibitors.
5.6.1. Change in overall electrostatic binding energies
The Arg292→Lys mutation reduces the binding of all inhibitors that have been studied (SIA, DAN, 4AM, ZMR, G20, G28, G39 and BCZ). The resistance of the mutant is greater to inhibitors in which the glycerol moiety at the C6-position has been replaced by hydrophobic chains (G20, G28, G39 or BCZ), as summarized in Table 4 ▶. The structural consequences of the Arg292→Lys mutation have been studied by Varghese et al. (1998 ▶) and Smith et al. (2002 ▶) (Fig. 8 ▶). Our work complements the structural knowledge by analysis of the effect of the mutation on the electrostatic energy of interaction between the enzyme and its inhibitors.
Table 4. Experimental pK i and calculated E es for wild-type and Arg292Lys variant N9 neuraminidase interacting with selected inhibitors.
| PDB code | Inhibitor | pK i (M) | pK i | E es (kJmol1) | E es (kJmol1) |
|---|---|---|---|---|---|
| 1mwe wild type | SIA | 4.26† | 559 | ||
| 2qwb mutant | SIA | 2.74† | 1.52 | 449 | 110 |
| 1f8b wild type | DAN | 5.58‡ | 526 | ||
| 2qwc mutant | DAN | 3.55‡ | 2.03 | 539 | 13 |
| 1f8c wild type | 4AM | 6.83‡ | 949 | ||
| 2qwd mutant | 4AM | 4.85‡ | 1.98 | 853 | 93 |
| 1nnc wild type | ZMR | 8.71‡ | 861 | ||
| 2qwe mutant | ZMR | 7.48‡ | 1.23 | 825 | 36 |
| 2qwi wild type | G20 | 8.36‡ | 629 | ||
| 2qwf mutant | G20 | 5.67‡ | 2.69 | 593 | 36 |
| 2qwj wild type | G28 | 6.64† (pIC50) | 716 | ||
| 2qwg mutant | G28 | 3.64† (pIC50) | 3.00 | 694 | 58 |
| 2qwk wild type | G39 | 8.70† (pIC50) | 780 | ||
| 2qwh mutant | G39 | 4.89† (pIC50) | 3.81 | 661 | 119 |
| 1l7f wild type | BCZ | 10.82§ | 694 | ||
| 1l7h mutant | BCZ | 3.00¶ | 663 | 31 |
Figure 8.

Superposition of wild-type (C atoms in blue) and Arg292→Lys variant (C atoms in magenta) influenza A neuraminidase N9 interacting with the eight inhibitors analysed in this study (C atoms in yellow for wild type and in pink for mutated complexes). The main-chain atoms of the protein backbone were superimposed using THESEUS v.1.0.2 (Theobald & Wuttke, 2006 ▶).
As is evident from Table 4 ▶, except for the DAN inhibitor, for which the change is small, the electrostatic interaction energy is less for the Arg292→Lys mutant. However, quantitatively the change does not correlate with the measured differences in pK i. This is not unexpected as the electrostatic interaction energy is only one of the components of the free energy of binding represented by pK i. Nevertheless, electrostatic interactions (Tables S4–S101) are important contributors and they must be analyzed in order to obtain a full understanding of the effect of mutations.
5.6.2. More detailed analysis
On mutation, the electrostatic interaction of the carboxylate in the C2-group of the inhibitor with Arg292 is replaced by a water-mediated interaction with Lys292 in the variant (Varghese et al., 1998 ▶). As a result, the electrostatic interaction energy between the inhibitor C2-group and residue 292 is reduced for all inhibitors by an amount ranging from 25 to 54 kJ mol−1. The electrostatic interactions of the C2-groups with the remaining conserved residues are more or less unaltered, with the exception of the SIA inhibitor, for which the interactions with Arg118 and Arg371 are also weakened (by 32 and 23 kJ mol−1, respectively).
The Arg292→Lys mutation alters the interactions of the C6-group but in different ways for inhibitors containing glycerol at the C6-position (SIA, DAN, 4 AM and ZMR) and for those with hydrophobic substituents rather than glycerol (G20, G28, G39 and BCZ). In complexes with the former type of inhibitor, the 8-hydroxyl of glycerol forms a new hydrogen bond to the amino group of Lys292, strengthening the interaction of the entire C6-group with that residue by 22–68 kJ mol−1 compared with the wild-type Arg292 residue. The electrostatic interactions of hydrophobic C6-groups are on the other hand slightly more repulsive (by 7–24 kJ mol−1) for Lys292. This difference is in agreement with the lower level of resistance of the mutated virus to glycerol-containing inhibitors than to more hydrophobic derivatives.
The interactions between Glu276 and the C6-group are also affected even though the residue is preserved. In complexes of wild-type neuraminidase and a glycerol-containing inhibitor, the carboxylic group of Glu276 forms hydrogen bonds to the 9-hydroxy and 8-hydroxy groups of the inhibitor. In addition, one of the carboxylic O atoms forms a bifurcated hydrogen bond to the distal N atoms of the Arg224 guanidine group. For the mutated enzyme, the interaction with Arg224 remains almost intact, but the second O atom from the Glu276 carboxylic group, which interacts with the 8-hydroxyl of the inhibitor, is pushed ∼0.6 Å towards Arg224 by the Lys292 amino group. However, the results of this conformational change are not uniform for all glycerol-containing inhibitors. The interactions of the C6-group with Glu276 are stronger for SIA and DAN (by 38 and 15 kJ mol−1, respectively) and are weaker for 4AM (by 36 kJ mol−1) in the mutant complex than in the wild type. The interaction for ZMR remains unchanged.
For inhibitors with hydrophobic C6-groups, Glu276 of the wild enzyme is reoriented towards Arg224 so that both carboxylic O atoms can form hydrogen bonds to distal N atoms of the Arg224 guanidine group. The Arg224–Glu276 salt link is believed to be crucial for the formation of the hydrophobic pocket required for tight binding of a hydrophobic C6-group (Taylor et al., 1998 ▶). The Glu276–Arg224 interaction is retained in the mutant complexed with G20, G28 and BCZ inhibitors, but is not present in the mutant interacting with G38. As a result, the entire C6-group of G38 is not well accommodated in the mutated active site. Nevertheless, the electrostatic interactions of the G38 C6-group with Glu276 do not change significantly when wild-type and mutant complexes are compared. Weakened van der Waals interactions of G38 are likely to be responsible for the highest observed resistance of the mutated virus to this inhibitor.
Some other subtle effects that are specific to particular inhibitors are observed. As a result of an overall shift of the inhibitor, the carbonyl O atom of the SIA C5-group is 0.16 Å more distant from the Arg152 guanidine group in the variant. This weakens the interaction between the C5-group and Arg152 by 26 kJ mol−1. In the case of ZMR and G20, on the other hand, a small rotation of the inhibitor caused by poorer accommodation of the C6-group in the mutated active site pushes the same O atom towards Arg152, slightly strengthening the interaction between the C5-group and Arg152 (by 26 and 18 kJ mol−1, respectively). The C4-amino group of G39 is slightly tilted by ∼0.4 Å away from the carboxylic group of Asp151 in the variant, reducing this charge-assisted hydrogen-bond interaction by 63 kJ mol−1. The effect is likely to result from the worsened fit of G39 into the mutated active site.
In summary, the Arg292→Lys mutation has a subtle effect on the electrostatic interactions between the neuraminidase and inhibitor molecules. The loss in electrostatic interaction strength between the C2-group and the mutated residue qualitatively agrees with the loss in inhibition efficiency of the inhibitors that have been studied. For glycerol-containing inhibitors this loss is partially compensated by a strengthening of the interaction of the mutated residue 292 with the C6-glycerol group. For inhibitors with more hydrophobic groups at C6 the loss is further enhanced by the increase in electrostatic repulsion with residue 292. Both effects are in agreement with the lower resistance of the mutant to glycerol-containing inhibitors.
6. Conclusions
The analysis shows that the conserved residues contribute as much as 85% of the electrostatic interaction energy of inhibitor–neuraminidase complexes. The C2-groups make the largest contributions to the electrostatic interactions. For the interactions of the —COO− group in non-aromatic inhibitors, the interactions with the conserved residues total ∼−300 kJ mol−1. For the —COO− of aromatic inhibitors, the interaction energy is 30–60% lower, whereas it is 50% larger in inhibitors without the central aromatic group but with the fully deprotonated PO3 2− group. Positively charged substituents of the C4-group further increase the electrostatic interactions with conserved residues by ∼−250 kJ mol−1. Interestingly, both amino and guanidine groups make similar total contributions, although they interact differently with each of the conserved residues. Glycerol side chains at C6 contribute ∼−120 kJ mol−1. The same holds true when one of the hydroxyls of glycerol is replaced by an amino group. The electrostatic contribution from non-glycerol-like C6-groups is much smaller. The C5-groups, which all contain the acetamide fragment, contribute ∼−90 kJ mol−1 to the electrostatic interactions with conserved residues. The contributions from remaining inhibitor groups, C3 and O, are negligible.
The number of structural water molecules surrounding the C4-groups depends on the charge and size of the C4-group. In the selected N9 complexes their electrostatic interactions with the protein are in the range −190 to −68 kJ mol−1 and are larger than those with the inhibitor, which vary from −35 to 22 kJ mol−1. The expulsion of two of the water molecules, at a cost about 142 kJ mol−1 in dissociation energy, is required to accommodate the bulky guanidine group present at C4 in the ZMR inhibitor. The energy loss is compensated by the strong interaction of the guanidine group with the protein (−255 kJ mol−1 compared with −12 kJ mol−1 for the C4 OH group of SIA) and the entropic gain of the no longer complexed waters.
The Arg292→Lys mutation reduces the electrostatic interactions of the enzyme with the acidic group at C2 for all inhibitors that have been studied (SIA, DAN, 4 AM, ZMR, G20, G28, G39 and BCZ), but enhances the interactions with the glycerol group at C6 when present. This is in agreement with the lower level of resistance of the mutated virus to glycerol-containing inhibitors compared with more hydrophobic derivatives.
In summary, the electrostatic interaction is a non-negligible component of the interaction energy governing the strength of neuraminidase inhibitors and must be understood if more potent inhibitors are to be designed. The model applied in our work takes into account the asphericity of the atoms as catalogued in the UBDB. Unlike point-charge models, it accounts for the directionality of the atom–atom interactions. The model is applicable to microscopic analysis of structure–function correlation in biological molecules (Warshel et al., 2006 ▶).
7. Supporting information available
Table S1 with the PDB codes of 70 complexes, the protein subtypes, mutated residues, inhibitor codes, protein and inhibitor charges together with inhibition constants (K i) or IC50 indexes, Tables S2–S3 with detailed information about protonation of the Gln, Asn and His residues and Figs. S1–S6 and Tables S4–S10 with the electrostatic contributions from amino-acid residues and inhibitor groups have been deposited as supplementary material1. The LSDB program and the University at Buffalo Databank are available at http://harker.chem.buffalo.edu.
Supplementary Material
Supporting information file. DOI: 10.1107/S0907444909009433/dz5152sup1.pdf
Acknowledgments
This work was supported by the National Institutes of Health through grant GM56829 and the National Science Foundation through grant CHE0236317. PMD was partially supported by a grant from Iceland, Liechtenstein and Norway through the EEA Financial Mechanism and the HOMING Programme from the Foundation for Polish Science. Molecular graphics were produced with the help of the PyMOL (DeLano, 2002 ▶) and THESEUS (Theobald & Wuttke, 2006 ▶) programs. We would like to thank one of the referees for extensive comments.
Footnotes
Supplementary material has been deposited in the IUCr electronic archive (Reference: DZ5152). Services for accessing this material are described at the back of the journal.
References
- Armstrong, K. A., Tidor, B. & Cheng, A. C. (2006). J. Med. Chem. 49, 2470–2477. [DOI] [PubMed]
- Babu, Y. S., Chand, P., Bantia, S., Kotian, P., Dehghani, A., El-Kattan, Y., Lin, T.-H., Hutchison, T. L., Elliot, A. J., Parker, C. D., Ananth, S. L., Horn, L. L., Laver, W. G. & Montgomery, J. A. (2000). J. Med. Chem. 43, 3482–3486. [DOI] [PubMed]
- Berman, H. M., Westbrook, J., Feng, Z., Gilliland, G., Bhat, T. N., Weissig, H., Shindyalov, I. N. & Bourne, P. E. (2000). Nucleic Acids Res. 28, 235–242. [DOI] [PMC free article] [PubMed]
- Bonnet, P. & Bryce, R. A. (2004). Protein Sci. 13, 946–957. [DOI] [PMC free article] [PubMed]
- Bonnet, P. & Bryce, R. A. (2005). J. Mol. Graph. Model. 24, 147–156. [DOI] [PubMed]
- Bossart-Whitaker, P., Carson, M., Babu, Y. S., Smith, C. D., Laver, W. G. & Air, G. M. (1993). J. Mol. Biol. 232, 1069–1083. [DOI] [PubMed]
- Brouillette, W. J., Atigadda, V. R., Luo, M., Air, G. M., Babu, Y. S. & Bantia, S. (1999). Bioorg. Med. Chem. Lett. 9, 1901–1906. [DOI] [PubMed]
- Burmeister, W. P., Cusack, S. & Ruigrok, R. W. (1994). J. Gen. Virol. 75, 381–388. [DOI] [PubMed]
- Burmeister, W. P., Henrissat, B., Bosso, C., Cusack, S. & Ruigrok, R. W. (1993). Structure, 1, 19–26. [DOI] [PubMed]
- Burmeister, W. P., Ruigrok, R. W. & Cusack, S. (1992). EMBO J. 11, 49–56. [DOI] [PMC free article] [PubMed]
- Carr, J., Ives, J., Kelly, L., Lambkin, R., Oxford, J., Mendel, D., Tai, L. & Roberts, N. (2002). Antivir. Res. 54, 79–88. [DOI] [PubMed]
- Chand, P., Kotian, P. L., Morris, P. E., Bantia, S., Walsh, D. A. & Babu, Y. S. (2005). Bioorg. Med. Chem. 13, 2665–2678. [DOI] [PubMed]
- Chong, A. K., Pegg, M. S. & von Itzstein, M. (1991). Biochim. Biophys. Acta, 1077, 65–71. [DOI] [PubMed]
- Colman, P. M. (1994). Protein Sci. 3, 1687–1696. [DOI] [PMC free article] [PubMed]
- Colman, P. M., Hoyne, P. A. & Lawrence, M. C. (1993). J. Virol. 67, 2972–2980. [DOI] [PMC free article] [PubMed]
- DeLano, W. L. (2002). The PyMOL Molecular Graphics System. DeLano Scientific, San Carlos, USA. http://www.pymol.org.
- Dominiak, P. M., Volkov, A., Li, X., Messerschmidt, M. & Coppens, P. (2007). J. Chem. Theory Comput. 3, 232–247. [DOI] [PubMed]
- Faerman, C. H. & Price, S. L. (1990). J. Am. Chem. Soc. 112, 4915–4926.
- Finley, J. B., Atigadda, V. R., Duarte, F., Zhao, J. J., Brouillette, W. J., Air, G. M. & Luo, M. J. M. B. (1999). J. Mol. Biol. 293, 1107–1119. [DOI] [PubMed]
- Fornabaio, M., Cozzini, P., Mozzarelli, A., Abraham, D. J. & Kellogg, G. E. (2003). J. Med. Chem. 46, 4487–4500. [DOI] [PubMed]
- Gottschalk, A. (1957). Biochim. Biophys. Acta, 23, 645–646. [DOI] [PubMed]
- Gubareva, L. V., Robinson, M. J., Bethell, R. C. & Webster, R. G. (1997). J. Virol. 71, 3385–3390. [DOI] [PMC free article] [PubMed]
- Hay, A. J., Gregory, V., Douglas, A. R. & Lin, Y. P. (2001). Philos. Trans. R. Soc. Lond. B, 356, 1861–1870. [DOI] [PMC free article] [PubMed]
- Hohenberg, P. & Kohn, W. (1964). Phys. Rev. 136, B864–B871.
- International Tables for Crystallography (1992). Vol. C. Dordrecht, The Netherlands: Kluwer Academic Publishers.
- Itzstein, M. von, Dyason, J. C., Oliver, S. W., White, H. F., Wu, W. Y., Kok, G. B. & Pegg, M. S. (1996). J. Med. Chem. 39, 388–391. [DOI] [PubMed]
- Jano, I. & Hardcastle, J. E. (1999). Anal. Chim. Acta, 390, 267–274.
- Jedrzejas, M. J., Singh, S., Brouillette, W. J., Air, G. M. & Luo, M. (1995). Proteins, 23, 264–277. [DOI] [PubMed]
- Jedrzejas, M. J., Singh, S., Brouillette, W. J., Laver, W. G., Air, G. M. & Luo, M. (1995). Biochemistry, 34, 3144–3151. [DOI] [PubMed]
- Johansson, B. E. & Brett, I. C. (2003). J. Biochem. (Tokyo), 134, 345–352. [DOI] [PubMed]
- Johansson, B. E. & Brett, I. C. (2006). J. Biochem. (Tokyo), 139, 439–447. [DOI] [PubMed]
- Kati, W. M., Montgomery, D., Carrick, R., Gubareva, L., Maring, C., McDaniel, K., Steffy, K., Molla, A., Hayden, F., Kempf, D. & Kohlbrenner, W. (2002). Antimicrob. Agents Chemother. 46, 1014–1021. [DOI] [PMC free article] [PubMed]
- Koritsanszky, T., Volkov, A. & Coppens, P. (2002). Acta Cryst. A58, 464–472. [DOI] [PubMed]
- Krissinel, E. & Henrick, K. (2004). Acta Cryst. D60, 2256–2268. [DOI] [PubMed]
- Li, X., Volkov, A. V., Szalewicz, K. & Coppens, P. (2006). Acta Cryst. D62, 639–647. [DOI] [PubMed]
- Liu, Y., Zhang, J. & Xu, W. (2007). Curr. Med. Chem. 14, 2872–2891. [DOI] [PubMed]
- Lommer, B. S., Ali, S. M., Bajpai, S. N., Brouillette, W. J., Air, G. M. & Luo, M. (2004). Acta Cryst. D60, 1017–1023. [DOI] [PubMed]
- Maring, C. J. et al. (2005). J. Med. Chem. 48, 3980–3990. [DOI] [PubMed]
- Masukawa, K. M., Kollman, P. A. & Kuntz, I. D. (2003). J. Med. Chem. 46, 5628–5637. [DOI] [PubMed]
- McKimm-Breschkin, J. L., Sahasrabudhe, A., Blick, T. J., McDonald, M., Colman, P. M., Hart, G. J., Bethell, R. C. & Varghese, J. N. (1998). J. Virol. 72, 2456–2462. [DOI] [PMC free article] [PubMed]
- Meanwell, N. A. & Krystal, M. (1996). Drug Discov. Today, 1, 388–397. [DOI] [PubMed]
- Moscona, A. (2005). N. Engl. J. Med. 353, 1363–1373. [DOI] [PubMed]
- Palese, P., Tobita, K., Ueda, M. & Compans, R. W. (1974). Virology, 61, 397–410. [DOI] [PubMed]
- Pegg, M. S. & von Itzstein, M. (1994). Mol. Biol. Int. 32, 851–858. [PubMed]
- Sangma, C. & Hannongbua, S. (2007). Curr. Comput. Aided Drug Des. 3, 113–132.
- Smith, B. J., Colman, P. M., von Itzstein, M., Danylec, B. & Varghese, J. N. (2001). Protein Sci. 10, 689–696. [DOI] [PMC free article] [PubMed]
- Smith, B. J., Huyton, T., Joosten, R. P., McKimm-Breschkin, J. L., Zhang, J.-G., Luo, C. S., Lou, M.-Z., Labrou, N. E. & Garrett, T. P. J. (2006). Acta Cryst. D62, 947–952. [DOI] [PubMed]
- Smith, B. J., McKimm-Breshkin, J. L., McDonald, M., Fernley, R. T., Varghese, J. N. & Colman, P. M. (2002). J. Med. Chem. 45, 2207–2212. [DOI] [PubMed]
- Steindl, T. & Langer, T. (2004). J. Chem. Inf. Comput. Sci. 44, 1849–1856. [DOI] [PubMed]
- Stoll, V., Stewart, K. D., Maring, C. J., Muchmore, S., Giranda, V., Gu, Y. G., Wang, G., Chen, Y., Sun, M., Zhao, C., Kennedy, A. L., Madigan, D. L., Xu, Y., Saldivar, A., Kati, W., Laver, G., Sowin, T., Sham, H. L., Greer, J. & Kempf, D. (2003). Biochemistry, 42, 718–727. [DOI] [PubMed]
- Sudbeck, E. A., Jedrzejas, M. J., Singh, S., Brouillette, W. J., Air, G. M., Laver, W. G., Babu, Y. S., Bantia, S., Chand, P., Chu, N., Montgomery, J. A., Walsh, D. A. & Luo, M. (1997). J. Mol. Biol. 267, 584–594. [DOI] [PubMed]
- Tai, C. Y., Escarpe, P. A., Sidwell, R. W., Williams, M. A., Lew, W., Wu, H., Kim, C. U. & Mendel, D. B. (1998). Antimicrob. Agents Chemother. 42, 3234–3241. [DOI] [PMC free article] [PubMed]
- Taylor, N. R., Cleasby, A., Singh, O., Skarzynski, T., Wonacott, A. J., Smith, P. W., Sollis, S. L., Howes, P. D., Cherry, P. C., Bethell, R., Colman, P. & Varghese, J. (1998). J. Med. Chem. 41, 798–807. [DOI] [PubMed]
- Taylor, N. R. & von Itzstein, M. (1994). J. Med. Chem. 37, 616–624. [DOI] [PubMed]
- Theobald, D. L. & Wuttke, D. S. (2006). Bioinformatics, 22, 2171–2172. [DOI] [PMC free article] [PubMed]
- Varghese, J. N. & Colman, P. M. (1991). J. Mol. Biol. 221, 473–486. [DOI] [PubMed]
- Varghese, J. N., Colman, P. M., van Donkelaar, A., Blick, T. J., Sahasrabudhe, A. & McKimm-Breschkin, J. L. (1997). Proc. Natl Acad. Sci. USA, 94, 11808–11812. [DOI] [PMC free article] [PubMed]
- Varghese, J. N., Epa, V. C. & Colman, P. M. (1995). Protein Sci. 4, 1081–1087. [DOI] [PMC free article] [PubMed]
- Varghese, J. N., McKimm-Breschkin, J. L., Caldwell, J. B., Kortt, A. A. & Colman, P. M. (1992). Proteins, 14, 327–332. [DOI] [PubMed]
- Varghese, J. N., Smith, P. W., Sollis, S. L., Blick, T. J., Sahasrabudhe, A., McKimm-Breschkin, J. L. & Colman, P. M. (1998). Structure, 6, 735–746. [DOI] [PubMed]
- Verma, R. P. & Hansch, C. (2006). Bioorg. Med. Chem. Lett. 14, 982–996. [DOI] [PubMed]
- Volkov, A., King, H. F. & Coppens, P. (2006). J. Chem. Theory Comput. 2, 81–89. [DOI] [PubMed]
- Volkov, A., Koritsánszky, T. & Coppens, P. (2004). Chem. Phys. Lett. 391, 170–175.
- Volkov, A., Li, X., Koritsanszky, T. S. & Coppens, P. (2004). J. Phys. Chem. A, 108, 4283–4300.
- Volkov, A., Macchi, P., Farrugia, L. J., Gatti, C., Mallinson, P., Richter, T. & Koritsanszky, T. (2006). XD2006 – A Computer Program for Multipole Refinement, Topological Analysis of Charge Densities and Evaluation of Intermolecular Energies from Experimental or Theoretical Structure Factors. http://xd.chem.buffalo.edu/.
- Volkov, A., Messerschmidt, M. & Coppens, P. (2007). Acta Cryst. D63, 160–170. [DOI] [PubMed]
- Wall, I. D., Leach, A. R., Salt, D. W., Ford, M. G. & Essex, J. W. (1999). J. Med. Chem. 42, 5142–5152. [DOI] [PubMed]
- Wang, G. T., Wang, S., Gentles, R., Sowin, T., Maring, C. J., Kempf, D. J., Kati, W. M., Stoll, V., Stewart, K. D. & Laver, G. (2005). Bioorg. Med. Chem. Lett. 15 125–128. [DOI] [PubMed]
- Wang, T. & Wade, R. C. (2001). J. Med. Chem. 44, 961–971. [DOI] [PubMed]
- Warshel, A., Sharma, P. K., Kato, M. & Parson, W. W. (2006). Biochim. Biophys. Acta, 1764, 1647–1676. [DOI] [PubMed]
- White, C. L., Janakiraman, M. N., Laver, W. G., Philippon, C., Vasella, A., Air, G. M. & Luo, M. (1995). J. Mol. Biol. 245, 623–634. [PubMed]
- Wilson, V. W. J. & Rafelson, M. E. J. (1967). Biochim. Biophys. Acta, 146, 160–166. [DOI] [PubMed]
- Word, J. M., Lovell, S. C., Richardson, J. S. & Richardson, D. C. (1999). J. Mol. Biol. 29, 1735–1747. [DOI] [PubMed]
- Yi, X., Guo, Z. & Chu, F. M. (2003). Bioorg. Med. Chem. 11, 1465–1474. [DOI] [PubMed]
- Zhang, J., Yu, K.-Q., Zhu, W. & Jiang, H. (2006). Bioorg. Med. Chem. Lett. 16, 3009–3014. [DOI] [PubMed]
- Zheng, M., Yu, K., Liu, H., Luo, X., Chen, K., Zhu, W. & Jiang, H. (2006). J. Comput. Aided Mol. Des. 20, 549–566. [DOI] [PubMed]
Associated Data
This section collects any data citations, data availability statements, or supplementary materials included in this article.
Supplementary Materials
Supporting information file. DOI: 10.1107/S0907444909009433/dz5152sup1.pdf