

Abstract
Objective:
To determine the potential of directional diffusivities from diffusion tensor imaging (DTI) to predict clinical outcome of optic neuritis (ON), and correlate with vision, optical coherence tomography (OCT), and visual evoked potentials (VEP).
Methods:
Twelve cases of acute and isolated ON were imaged within 30 days of onset and followed prospectively. Twenty-eight subjects with a remote clinical history of ON were studied cross-sectionally. Twelve healthy controls were imaged for comparison. DTI data were acquired at 3T with a surface coil and 1.3 × 1.3 × 1.3 mm3 isotropic voxels.
Results:
Normal DTI parameters (mean ± SD, μm2/ms) were axial diffusivity = 1.66 ± 0.18, radial diffusivity = 0.81 ± 0.26, apparent diffusion coefficient (ADC) = 1.09 ± 0.21, and fractional anisotropy (FA) = 0.43 ± 0.15. Axial diffusivity decreased up to 2.5 SD in acute ON. The decrease in axial diffusivity at onset correlated with visual contrast sensitivity 1 month (r = 0.59) and 3 months later (r = 0.65). In three subjects followed from the acute through the remote stage, radial diffusivity subsequently increased to >2.5 SD above normal, as did axial diffusivity and ADC. In remote ON, radial diffusivity correlated with OCT (r = 0.81), contrast sensitivity (r = 0.68), visual acuity (r = 0.56), and VEP (r = 0.54).
Conclusion:
In acute and isolated demyelination, axial diffusivity merits further investigation as a predictor of future clinical outcome. Diffusion parameters are dynamic in acute and isolated optic neuritis, with an initial acute decrease in axial diffusivity. In remote disease, radial diffusivity correlates with functional, structural, and physiologic tests of vision.
GLOSSARY
- ADC
= apparent diffusion coefficient;
- CI
= confidence interval;
- CS
= contrast sensitivity;
- DTI
= diffusion tensor imaging;
- EAE
= experimental autoimmune encephalitis;
- FA
= fractional anisotropy;
- MD
= mean diffusivity;
- MS
= multiple sclerosis;
- NAWM
= normal-appearing white matter;
- OCT
= optical coherence tomography;
- ON
= optic neuritis;
- RA
= relative anisotropy;
- rFOV
= reduced field of view;
- RNFL
= retinal nerve fiber layer;
- ROI
= region of interest;
- SD
= standard deviation;
- SNR
= signal-to-noise ratio;
- VA
= visual acuity;
- VEP
= visual evoked potentials.
Pathologic heterogeneity is postulated as a key contributor to the MRI paradox in multiple sclerosis (MS). An imaging modality that better correlates with clinical disability and prognosis is needed. We hypothesize that directional diffusivity measurements from diffusion tensor imaging (DTI) can detect structural changes within white-matter tracts, and differentiate axonal injury from demyelination.
DTI tissue measurements are based upon Brownian motion of water, influenced by tissue restrictions from cellular structures. Studies suggest that mean diffusivity (MD, also known as apparent diffusion coefficient [ADC]) and fractional or relative anisotropy (FA or RA) can detect both MS lesions and changes in normal-appearing white matter (NAWM).1 Unfortunately, summary parameters derived from DTI have not demonstrated sufficient specificity to define the underlying pathology of white matter injury.
To improve DTI specificity, an analytical approach has been proposed by this group to assess the extent of axonal damage, demyelination, or both. The three eigenvalues or diffusivities (λ1, λ2, and λ3) are scalar indices that describe water diffusion through tissue microstructures in a local frame of reference. Within white matter tracts, the largest eigenvalue within a voxel, λ1, is assumed to represent the water diffusivity parallel to the majority of axonal fibers. This is designated λ||, the “axial diffusivity.” The averaged diffusivity of λ2 and λ3 represents diffusion perpendicular to the axonal fibers, denoted as λ⊥, the “radial diffusivity.” Previous work by this group using animal models of acute CNS injury has demonstrated that directional diffusivities within white matter tracts correlate with axon and myelin pathologies.2–9
Building upon the application in mouse models of axial and radial diffusivities as pathologic surrogates of axonal and myelin damage, respectively, the present studies undertook translation to humans. The human optic nerve was chosen as a simple and well-defined white matter tract emanating from single-ordered neurons. It is commonly affected in demyelinating disorders and has well-defined outcome measures.
METHODS
All subjects provided informed consent, after approval by the local Human Research Protection Office/Institutional Review Board.
Normal subjects.
Twelve subjects with no symptoms or signs of neurologic or ocular pathology were recruited (6 men and 6 women, mean age 37 with range 21–49). Control subjects had a normal funduscopic examination, visual acuity (VA) ≥20/25, and Pelli-Robson contrast sensitivity (CS) ≥1.65. Two individuals were imaged twice, and another two were imaged three times on different days to determine intersubject variability.
Subjects with ON.
Twelve cases of acute optic neuritis (ON) in 10 subjects with no previous neurologic events were imaged within 30 days of onset. One subject had bilateral involvement, and another sequential involvement in the fellow eye, which was initially unaffected based upon all vision tests and VEP. Twelve nerves were prospectively followed for 3 months, with three followed for over 1 year. Nine of the 12 episodes received IV glucocorticoids, including all with VA worse than 20/40 (n = 7). For remote ON, 28 subjects with at least one clinical episode of ON at least 1 year prior were included. Visual measurements included Sloan 5% CS chart at 3 m in an illuminated cabinet (Precision Vision, IL) and corrected VA by 20 ft Snellen wall chart. Visual evoked potentials (VEP) P100 latency (normal mean 98.95 msec, upper limit 112.9 msec) was read blinded. If the waveform was unobtainable due to poor vision, the maximal obtained value of 170 msec was used. Optical coherence tomography (OCT) fast retinal nerve fiber layer (RNFL) thickness was obtained on a Zeiss Stratus OCT III with v4.0 software.
MR protocol.
MR data were acquired using a custom fabricated transmitter coil and four-element phased array flexible surface receiver coil on a 3T MR scanner (Allegra, Siemens AG, Erlangen, Germany). A vacuum-molded pillow minimized head movement. Subjects were encouraged to sleep or close their eyes. Sleep was unlikely to cause excessive eye movement since the scan is shorter than the latency to the REM stage.
A single shot spin-echo echoplanar imaging diffusion sequence was employed with fat suppression, and reduced field of view (rFOV) technique with twice refocused diffusion weighting.10 Diffusion-weighted images were acquired transaxially (field of view 168 mm × 84 mm, matrix 128 × 64, partial Fourier 6/8, echo time 65 msec) with two collated groups of 1.3-mm-thick slices. Each slice group comprised five interleaved slices and was cardiac gated (150 msec delay after the sphygmic wave by pulse oximetry), yielding a repetition time of 4–6 seconds. Eight to 12 image sets, each consisting of one with b = 0 (b0) and 12 diffusion-weighted images on 12 diffusion encoding directions (two sets of six icosahedral directions with opposite gradient polarity) with b = 600 s/mm2, were acquired for each slice group.11 Total scan time was 40 minutes.
DTI calculation.
Each DTI data set was motion corrected using an iterative procedure.12 Diffusion images with excessive movement (≥3 mm translation in either direction) were excluded from averaging. All transforms were rigid body affine and computed by vector gradient measure maximization.13 The b0 volumes of each DTI data set were aligned using intensity correlation maximization. The final motion-corrected result was obtained by algebraically composing all transforms (saved from the iterative procedure), and then averaging all data sets after application of the composed transforms using cubic spline interpolation. The final resampling step output 13 volumes with interpolated resolution of 0.65 × 0.65 × 0.65 mm3. The diffusion tensor matrix at each voxel was estimated by linear least-squares fitting of the motion corrected and resampled DTI dataset.14
Region of interest analysis.
The region of interest (ROI) was selected manually on the b0 image to include 15–20 voxels longitudinally (10–13 mm in length). To avoid CSF partial volume artifacts, the ROI only included voxels at the nerve center. To avoid the region most prone to movement and confounded by lack of myelination, the ROI started 12–15 voxels (about 15.0 mm) posterior to the retina (figure 1). After ROI identification for controls, voxels having FA greater than 2 SD from the mean were discarded to avoid magnetic field inhomogeneity induced artifacts and incorrect diffusion calculations. Voxels with signal-to-noise ratio (SNR)15 lower than 32 were excluded, resulting in retention of 75% of the voxels. These same ROI criteria derived from the normal subjects were applied to the subjects with ON.

Figure 1 Region of interest (ROI) selection on the b0 image
Isotropic voxels permitted visualizing the nerve in the transverse (A) and coronal (B) planes. The nerve center was selected to minimize CSF contamination. Fifteen to 20 voxels posterior to the unmyelinated anterior nerve section allowed adequate sampling for approximately 2.5 cm of the nerve. ROI was coregistered to transverse images of fractional anisotropy (C) and axial diffusion (D).
Statistical analyses.
Linear modeling for the normative data was estimated by taking 1,000 bootstrap samples of one measurement from each of the 12 normal subjects, such that the observations contributing to each mean were independent. In acute ON, Spearman correlation coefficients described the relationship between the diffusion and clinical parameters at onset, to the clinical parameters 1 and 3 months later. In remote ON, Spearman correlation described the relationship between the diffusion parameters to the clinical visual tests.
RESULTS
Normal subjects.
Data from normal subjects revealed no age or gender effects on the diffusion parameters (table 1). Axial diffusivity (mean 1.66 μm2/ms) was twice the magnitude of radial diffusivity (mean 0.81). The mean SNR for each voxel within the ROI was 37.8 ± 9.3 (range 17.8–69.7). For voxels with low SNR, axial diffusion was dependent upon the SNR. Below SNR of 32, the Pearson correlation coefficient squared (r2) of voxel SNR vs axial diffusivity was 0.43. Above SNR of 32, r2 = 0.03 (both p values <0.05). Voxels above the SNR cutoff demonstrated little dependency on other diffusion parameters (MD r2 = 0.05, FA r2 = 0.05, radial diffusivity r2 = 0.05). After the cutoff was applied, diffusion parameters displayed a Gaussian distribution. Only three percent of voxels had FA greater than 2 SD above the mean. The SD of the noise on b0 images was found to be consistent across all studies (mean 15.51, SD 1.83, range 11.40–18.50), as a measure of quality control.
Table 1 Diffusion parameters in optic nerve from healthy volunteers (n = 12)

Acute ON.
In 12 cases of ON imaged within 30 days of clinical onset, FA was the only diffusion parameter correlated with the vision at onset (CS r = 0.66, p = 0.02; VA r = 0.66, p = 0.02). However, visual recovery 1 or 3 months later did not correlate with the initial alteration in FA. Axial diffusivity was the only diffusion parameter at onset to correlate with a visual function parameter at both 1 (CS r = −0.59, n = 12, p = 0.04) and 3 months later (CS r = −0.65, n = 11, p = 0.03) (figure e-1 on the Neurology® Web site at www.neurology.org). Of note, CS and VA at onset did not correlate with CS and VA 1 or 3 months later, suggesting that axial diffusivity is contributing prognostic information independent of that acquired clinically.16–18
Three cases of acute ON were available after 1 year to determine the evolution of DTI into the remote phase (table 2). Only ON 3 demonstrated a significant change in a diffusion parameter at onset, with axial diffusivity being decreased <2 SD below normal. In the three nerves after 1 year of follow-up, axial and radial diffusivity, along with ADC, were significantly increased 2 SD above normal. ON 3, with an initial 2.5 SD decrease in axial diffusivity at onset, had reversed after 1 year to become 2 SD increased above the mean. The DTI parameters from the three cases of acute ON followed prospectively over a year were not different from the mean DTI parameters for the 28 subjects with remote ON.
Table 2 Diffusion parameters in acute optic neuritis (ON) at onset and after 1 year

Remote ON.
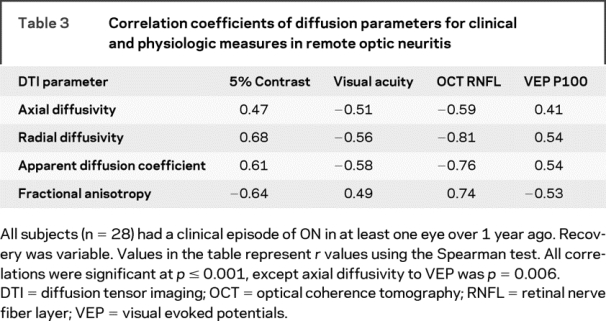
The 28 individuals with a prior clinical history of ON had a median age of 43 years (range 22–59), 11:3 female:male, median disease duration 8 years (range 1–27), median EDSS of 2.0 (range 0–7), median Snellen VA 20/20 (range 20/13 to no light perception), and median CS 0.3 logMAR (range 0.1–1.0) (figure e-2). Spearman coefficients of all diffusion parameters demonstrated correlation with all clinical parameters (table 3). Of the four diffusion parameters, radial diffusivity had the highest correlations with concurrent visual system tests. Radial diffusivity was highly correlated with OCT (r = −0.81, p < 0.001) and 5% CS (r = 0.68; p < 0.001), and moderately correlated with VA (r = −0.56; p < 0.001) and VEP (r = 0.54, p < 0.001).
Table 3 Correlation coefficients of diffusion parameters for clinical and physiologic measures in remote optic neuritis
DISCUSSION
Most episodes of ON have a favorable outcome, sometimes without regard for the severity at onset.17 However, visual impairment in ON remains a disabling problem, adversely affecting quality of life in many. The variability in recovery is likely due to the nature of the inflammatory response, the extent of tissue injury, along with the individual's capacity to repair. The temporary vision loss in some severe cases may be due to reversible inflammation and edema. Lack of recovery for others may be due to extensive demyelination without adequate repair, along with variable injury to axons. In ON, as well as MS or NMO, a biomarker is needed to determine individual risk of poor recovery at onset of a demyelinating event.
Directional diffusivities have potential to provide a window into the pathology of demyelinating disease.2–9 Because it is a single tract with quantifiable function, the optic nerve is an ideal system for investigating directional diffusivities from DTI. Herein, the optic nerve was used to understand the dynamics of diffusion alterations as a prelude to studying more complex systems.
In 12 acute episodes of ON, a decrease in axial diffusivity at presentation correlated with worse contrast sensitivity 1 and 3 months later. These time points are notable because recovery from ON begins to plateau 30–60 days from onset,17 and therefore recovery at 1–3 months may serve as a surrogate of long-term recovery. Contrast discrimination is a sensitive test that can reveal subtle and important deficits despite recovery of Snellen acuity.18 It is of interest that initial axial diffusivity did not correlate with initial clinical parameters, suggesting that axial diffusivity adds independent prognostic information. Initial Snellen VA and contrast sensitivity did not correlate with these same parameters 1 and 3 months later, suggesting in this cohort that recovery is not always predicted by the initial clinical severity.16–18 Additional subjects and longer follow-up are needed to confirm this finding.
In these 12 acute cases, axial diffusivity was the first diffusion parameter to be altered (table e-1). Decline in axial diffusivity in the acute setting therefore has potential as a surrogate marker of tissue destruction and outcome. Radial diffusivity, FA, and ADC were less useful as predictors, becoming abnormal beyond the acute setting. Since tissue injury in demyelinating disease is presumably a dynamic process, one would expect diffusion parameters to also change over time. Thus, the timing of diffusion imaging, as well as the existence of prior injury within that tract, should be considered for proper interpretation of DTI results.
In the group of 28 subjects with remote and stable ON, marked alterations in all diffusion parameters of the affected optic nerves were evident. Radial diffusivity, along with FA and ADC, had strong correlations to tests of vision (CS and VA), structure (OCT), and physiology (VEP). The correlation to RNFL thickness by OCT supports the underlying hypothesis, since the RNFL is thought to reflect tissue alterations within the optic nerve.
Axial diffusivity was less strongly correlated to vision, structure, and physiology in remote disease. We hypothesize that axial diffusivity in the remote setting may be overwhelmed by increased diffusivity and decreased anisotropy from demyelination, tissue vacuolization, and gliosis.19 Axial diffusivity may be insensitive to axons if they are not tightly packed with myelin. To illustrate the effect of increased total diffusivity upon axial diffusivity, three cases of ON followed from the acute to the remote state demonstrate increased axial diffusivity with increasing ADC and radial diffusivity over the year. The role of diffusion parameters with disease recurrence needs further investigation to better understand how to translate future DTI to those with established MS. Interpretation of axial diffusivity with acute but recurrent disease may be more challenging if there are preexisting alterations in overall diffusivity.
Imaging of the optic nerve is difficult due to small size, mobility, and surrounding tissues. The diameter of a normal optic nerve is 3–4 mm. Normal retrobulbar optic nerve has a fiber count of 1,141,000 ± 212,000, a 20% range.20 In the present study, high-resolution imaging with 1.3 mm3 isotropic voxels minimized CSF contamination and allowed 2–3 transverse slices of the nerve. Isotropic voxels permitted visualization in multiple planes for optimal ROI selection (figure 1). Central voxels were selected, sacrificing possible peripherally positioned plaques in order to exclude voxels bordering CSF. Distortion from high-resolution echoplanar sequences was lowered by a reduced echo train length by rFOV technique.
A high SNR is necessary for reliable DTI quantification. This presents a challenge for high-resolution imaging, because signal strength decreases with increasing resolution. In this study, plots comparing diffusion parameters to voxel SNR in normal subjects found an optimal value of SNR to be 30–40. A custom-built optic nerve receiver coil and a 3T magnet with multiple averages increased SNR. An inversion pulse for CSF suppression was not used, since this reduces signal from the CNS tissue. Using these methods, the mean optic nerve SNR was 34.6. An SNR of 32 was selected as a criterion for inclusion in quantitative measurements (see Methods). This value is consistent with published theoretical analyses that show increasing measurement accuracy above 30.21–23
This investigational imaging protocol was optimized to obtain quality images. It required 40 minutes using a dedicated surface and transmitter coil. With proper instruction and positioning, only 2 of 38 scans were repeated due to motion. Thus, directional DTI of ON is feasible in the clinical setting, although ideally obtained in a dedicated imaging session.
Published animal studies in different models of axonal injury and myelin loss support the concept of utilizing directional diffusivities as markers of pathology.2,3,5,24 This study in acute and isolated ON in humans demonstrates an initial decrease in axial diffusivity (figure 2). This early decrease in axial diffusivity has been demonstrated after corpus callosotomy within the brain.25 This decrease has also been observed in animal imaging, with histologic correlation to decreased axon count. Animal imaging is very useful for following diffusion changes longitudinally and correlating them with histopathology, but animal models have limitations. Experimental autoimmune encephalitis (EAE) is used as a model for MS, but there are important immunopathologic differences. For example, EAE is induced by immunization, whereas the inciting event for MS is unknown. Thus far, in the nonrelapsing C57BL/6 EAE model, a late elevation in ON axial diffusivity following the early decline in axial diffusivity has not been observed in studies up to 90 days.9
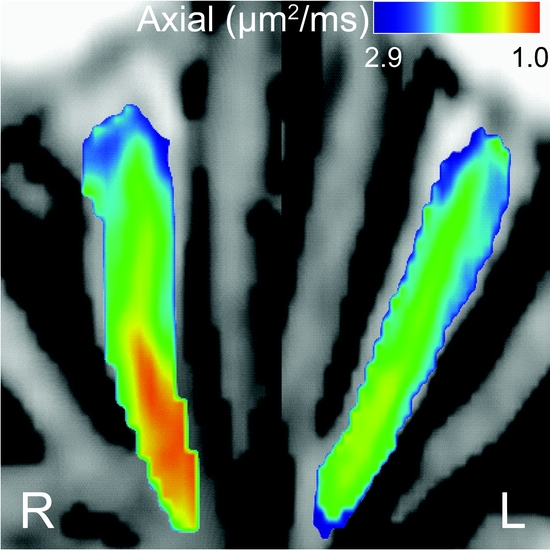
Figure 2 Axial diffusivity is decreased in acute retrobulbar optic neuritis (ON)
This optic nerve was imaged 11 days after clinical onset of ON (ON 2). Vision was motion perception only, and funduscopic examination was normal. Decreased axial diffusivity was manifested by a warmer color. A moderate decrease in axial diffusivity within the retrobulbar portion of the right nerve was observed. Axial diffusion was 1 standard deviation below the normative range. Although this eye had a severe onset, it made a good recovery.
Other investigators have reported DWI/DTI studies of human optic nerves.26–29 Previous reports describe elevated mean diffusion in the remote state following ON, the ability to distinguish normal from abnormal optic nerves, and correlations of DTI with results of clinical testing.30,31 The present work expands upon the prior reports, and includes acute DTI in isolated ON with prospective determination of clinical outcome. The present report describes imaging and postprocessing procedures, a high SNR, sampling across a 10–15 mm longitudinal segment of the optic nerve, and correlation of DTI measures to OCT.
Our primary objective was to evaluate the use of the individual tensors of a human CNS tract to estimate the pathology within white matter. High-resolution diffusion imaging of the living human optic nerve can be reliably accomplished while maintaining high SNR. We report an early decrease in axial diffusivity in acute ON, and preliminary data that the degree of decline in axial diffusivity may correlate with clinical outcome. DTI and directional diffusivities provide information about function, physiology, and structure of the optic nerve. This clinically important information is not obtained by conventional MRI. The present studies also showed that diffusion parameters are dynamic, and changing between the acute and remote stages. Future studies will determine whether these techniques have practical benefit in the care of patients.
Supplementary Material
Address correspondence and reprint requests to Dr. Robert T. Naismith, Neurology, Box 8111, 660 S. Euclid Ave., St. Louis, MO 63110 naismithr@neuro.wustl.edu
Supplemental data at www.neurology.org
Editorial, page 584
e-Pub ahead of print on December 10, 2008, at www.neurology.org.
*These authors contributed equally.
Funding included K23NS052430 (R.T.N.), K12RR02324902 (R.T.N.), K24 RR017100 (A.H.C.), P30 NS048056 (A.Z.S.), and UL1 RR024992 from the NIH, and CA1012 (A.H.C., S.K.S.), RG 3670 (S.K.S.), and FG1782A1 (J.X.) from the National MS Society USA. A.H.C. was supported in part by the Manny and Rosalyn Rosenthal-Dr. John L. Trotter Chair in Neuroimmunology.
Disclosure: The authors report no disclosures.
Received April 18, 2008. Accepted in final form August 4, 2008.
REFERENCES
- 1.Rovaris M, Gass A, Bammer R, et al. Diffusion MRI in multiple sclerosis. Neurology 2005;65:1526–1532. [DOI] [PubMed] [Google Scholar]
- 2.Sun SW, Liang HF, Trinkaus K, Cross AH, Armstrong RC, Song SK. Noninvasive detection of cuprizone induced axonal damage and demyelination in the mouse corpus callosum. Magn Reson Med 2006;55:302–308. [DOI] [PubMed] [Google Scholar]
- 3.Kim JH, Budde MD, Liang HF, et al. Detecting axon damage in spinal cord from a mouse model of multiple sclerosis. Neurobiol Dis 2006;21:626–632. [DOI] [PubMed] [Google Scholar]
- 4.Song SK, Yoshino J, Le TQ, et al. Demyelination increases radial diffusivity in corpus callosum of mouse brain. NeuroImage 2006;26:132–140. [DOI] [PubMed] [Google Scholar]
- 5.Song SK, Sun SW, Ju WK, Lin SJ, Cross AH, Neufeld AH. Diffusion tensor imaging detects and differentiates axon and myelin degeneration in mouse optic nerve after retinal ischemia. NeuroImage 2003;20:1714–1722. [DOI] [PubMed] [Google Scholar]
- 6.Song SK, Sun SW, Ramsbottom MJ, Chang C, Russell J, Cross AH. Dysmyelination revealed through MRI as increased radial (but unchanged axial) diffusion of water. NeuroImage 2002;17:1429–1436. [DOI] [PubMed] [Google Scholar]
- 7.Harsan LA, Poulet P, Guignard B, et al. Brain dysmyelination and recovery assessment by noninvasive in vivo diffusion tensor magnetic resonance imaging. J Neurosci Res 2006;83:392–402. [DOI] [PubMed] [Google Scholar]
- 8.Tyszka JM, Readhead C, Bearer EL, Pautler RG, Jacobs RE. Statistical diffusion tensor histology reveals regional dysmyelination effects in the shiverer mouse mutant. NeuroImage 2006;29:1058–1065. [DOI] [PMC free article] [PubMed] [Google Scholar]
- 9.Sun SW, Liang HF, Schmidt RE, Cross AH, Song SK. Selective vulnerability of cerebral white matter in a murine model of multiple sclerosis detected using diffusion tensor imaging. Neurobiol Dis 2007;28:30–38. [DOI] [PMC free article] [PubMed] [Google Scholar]
- 10.Jeong EK, Kim SE, Guo J, Kholmovski EG, Parker DL. High-resolution DTI with 2D interleaved multislice reduced FOV single-shot diffusion-weighted EPI (2D ss-rFOV-DWEPI). Magn Reson Med 2005;54:1575– 1579. [DOI] [PubMed] [Google Scholar]
- 11.Hasan KM, Parker DL, Alexander AL. Comparison of gradient encoding schemes for diffusion-tensor MRI. J Magn Reson Imaging 2001;13:769–780. [DOI] [PubMed] [Google Scholar]
- 12.Shimony JS, Burton J, Epstein AA, McLaren DG, Sun SW, Snyder AZ. Diffusion tensor imaging reveals white matter reorganization in early blind humans. Cereb Cortex 2006;16:1653–1661. [DOI] [PMC free article] [PubMed] [Google Scholar]
- 13.Rowland DJ, Garbow JR, Laforest RR, Snyder AZ. Registration of [18F]FDG microPET and small-animal MRI. Nucl Med Biol 2005;32:567–572. [DOI] [PubMed] [Google Scholar]
- 14.Shimony JS, McKinstry RC, Akbudak E, et al. Quantitative diffusion-tensor anisotropy brain MR imaging: normative human data and anatomic analysis. Radiology 1999;212:770–784. [DOI] [PubMed] [Google Scholar]
- 15.Edelstein WA, Bottomley PA, Pfeifer LM. A signal-to-noise calibration procedure for NMR imaging systems. Med Phys 1984;11:180–185. [DOI] [PubMed] [Google Scholar]
- 16.Beck RW, Ruchman MC, Savino PJ, Schatz NJ. Contrast sensitivity measurements in acute and resolved optic neuritis. Br J Ophthalmol 1984;68:756–759. [DOI] [PMC free article] [PubMed] [Google Scholar]
- 17.Beck RW, Cleary PA, Anderson MM, et al. A randomized controlled trial of corticosteroids in the treatment of acute optic neuritis. The Optic Neuritis Study Group. N Engl J Med 1992;326:581–588. [DOI] [PubMed] [Google Scholar]
- 18.Trobe JD, Beck RW, Moke PS, Cleary PA. Contrast sensitivity and other vision tests in the optic neuritis treatment trial. Am J Ophthalmol 1996;121:547–53. [DOI] [PubMed] [Google Scholar]
- 19.Schierer K, Wheeler-Kingshott CAM, Boulby PA, et al. Diffusion tensor imaging of post mortem multiple sclerosis brain. NeuroImage 2007;35:467–477. [DOI] [PMC free article] [PubMed] [Google Scholar]
- 20.Jonas JB, Schmidt AM, Müller-Bergh JA, Naumann GOH. Optic nerve fiber count and diameter of the retrobulbar optic nerve in normal and glaucomatous eyes. Graefes Arch Clin Exp Ophthalmol 1995;233:421–424. [DOI] [PubMed] [Google Scholar]
- 21.Basetin ME, Armitage PA, Marshall I. A theoretical study of the effect of experimental noise on the measurement of anisotropy in diffusion imaging. Magn Reson Imaging 1998;16:773–785. [DOI] [PubMed] [Google Scholar]
- 22.Pierpaoli C, Basser PJ. Toward a quantitative assessment of diffusion anisotropy. Magn Reson Med 1996;36:893–906. [DOI] [PubMed] [Google Scholar]
- 23.Anderson AW. Theoretical analysis of the effects of noise on diffusion tensor imaging. Magn Reson Med 2001;46:1174–1188. [DOI] [PubMed] [Google Scholar]
- 24.Deboy CA, Zhang J, Dike S, et al. High resolution diffusion tensor imaging of axonal damage in focal inflammatory and demyelinating lesions in rat spinal cord. Brain 2007;130:2199–2210. [DOI] [PubMed] [Google Scholar]
- 25.Concha Gross DW, Wheatley BM, Beaulieu C. Diffusion tensor imaging of time-dependent axonal and myelin degradation after corpus callosotomy in epilepsy patients. NeuroImage 2006;32:1090–1099. [DOI] [PubMed] [Google Scholar]
- 26.Iwasawa T, Matoba H, Ogi A, et al. Diffusion weighted imaging of the human optic nerve: a new approach to evaluate optic neuritis in multiple sclerosis. Magn Reson Med 1997;38:484–491. [DOI] [PubMed] [Google Scholar]
- 27.Vinogradov E, Degenhardt A, Smith D, et al. High-resolution anatomic, diffusion tensor, and magnetization transfer magnetic resonance imaging of the optic chiasm at 3T. J Magn Reson Imaging 2005;22:302–306. [DOI] [PubMed] [Google Scholar]
- 28.Chabert S, Molko N, Cointepas Y, Le Roux P, Le Bihan D. Diffusion tensor imaging of the human optic nerve using a non-CPMG fast spin echo sequence. J Magn Reson Imaging 2005;22:307–310. [DOI] [PubMed] [Google Scholar]
- 29.Wheeler-Kingshott C, Trip SA, Symms MR, Parker GJM, Barker GJ, Miller DH. In vivo diffusion tensor imaging of the human optic nerve: pilot study in normal controls. Magn Reson Med 2006;56:446–451. [DOI] [PubMed] [Google Scholar]
- 30.Trip SA, Wheeler-Kingshott C, Jones SJ, et al. Optic nerve diffusion tensor imaging in optic neuritis. NeuroImage 2006;30:498–505. [DOI] [PubMed] [Google Scholar]
- 31.Hickman SJ, Wheeler-Kingshott CA, Jones SJ, et al. Optic nerve diffusion measurement from diffusion-weighted imaging in optic neuritis. Am J Neuroradiol 2005;26:951–956. [PMC free article] [PubMed] [Google Scholar]
Associated Data
This section collects any data citations, data availability statements, or supplementary materials included in this article.