Abstract
A new class of experiments that probe folding of individual protein domains uses mechanical stretching to cause the transition. We show how stretching forces can be incorporated in lattice models of folding. For fast folding proteins, the analysis suggests a complex relation between the force dependence and the reaction coordinate for folding.
Several experimental groups recently have succeeded in monitoring the unfolding of individual protein domains (1–3), by measuring the forces exerted when stretching titin, a giant multidomain protein molecule. Single molecule experiments hold unique promise to give information about the mechanisms of biomolecular reactions. They can, in principle, confirm the cooperative character of some conformational transitions, which often is only indirectly inferred by observations of ensembles of molecules. Also they can yield information about the intermittency of transitions arising from the ruggedness of the energy landscapes of proteins, which has been predicted recently (4). Stretching experiments also provide direct information about the mechanical forces and therefore the free energies involved in protein folding. Indeed the authors of those experimental papers made several intriguing inferences about the folding mechanism and energy landscape of the domains on the basis of their results. In this paper we want to further discuss the interpretation of such single molecule mechanochemical experiments by using the energy landscape theory of protein folding and lattice model simulations.
There are two aspects of the mechanochemical experiments that require special attention. The first of these is that from the point of view of a protein chemist the stretching experiment perturbs the energy landscape for folding in an unusual way. The dominant energies that guide a protein to fold quickly are correlated strongly to the specific structure of the protein, that is, the energy landscape is a funnel (5, 6). The reaction coordinate for folding is a collective coordinate measuring, to a first approximation, the fraction of interactions that are native-like. This reaction coordinate is a scalar, i.e., it is rotationally invariant. Most perturbations used to probe the folding energy landscape therefore are also scalars. In contrast, the stretching force is a vector. Until the molecule is sufficiently polarized by stretching, the stretching force acts very ineffectually on the reaction coordinate. Within the linear response regime, the Curie principle, in fact, would require there to be no effect of stretching on folding. On the other hand, the single molecule stretching experiments generally were performed under extreme tension, which greatly distorts the energy landscape, favoring highly expanded configurations. This feature leads to the second unusual aspect of the perturbation—it is very large on the scale of folding energies. Energy landscape theory allows us to estimate the effects of these strong perturbations on the free energy surface that controls the folding rate.
A Minimalist Approach to Stretch Experiments
According to the energy landscape theory, folding mechanisms can be classified into several scenarios depending on the shape and character of the free energy surface. In the most common regime, folding is described by an exponential process whose rate is limited by the time it takes to reach an entropic bottleneck, which consists of an ensemble of many structures. In this regime the rate is a smooth function of the protein stability. For a restricted range of stabilities the relationship between activation free energy and stability is linear. Nevertheless when the protein is very stable, folding can occur by a downhill mechanism or conversely when very unstable, unfolding can be a downhill near-barrierless process. Deviations from exponential kinetics are expected in the downhill scenario. Also, when the process is not dominated by a single bottleneck, the ruggedness of the landscape is more apparent because events are much faster.
This framework suggests that the way in which the force affects stability is paramount. Because the force is a vector, stability is a quadratic function of it for small magnitudes. In this regime, models that treat the reaction coordinate as a length can be misleading. Once the chain is polarized, the stability of the molecule will change more linearly with the additional force, and models that use length as the reaction coordinate may become more appropriate, although as we shall see some care is needed in interpreting them too literally as giving geometrical information about the transition state. For very large extension forces, unfolding can become downhill in character and again will vary slowly with tension. In this regime, undoing specific traps can be the rate-limiting step. In addition, in the downhill regime, the force dependence of even the elementary events of local conformation isomerization may become rate controlling (7).
We now illustrate these ideas with the help of a lattice simulation. The system used is a minimally frustrated three-letter code 27-mer on a cubic lattice (8–10). The energy landscape of this model system in a renormalized sense corresponds to a fast-folding (millisecond time scale) small helical (around 60 aa) protein (5). Without any stretching force the energy is given by a sum of contact terms††. The proper incorporation of the stretching force into the model requires some subtlety because of the inherent rotational anisotropy of any lattice. In reality, a configuration with any given end-to-end length can be oriented in any direction. If the rotational motions of the chain are taken to be rapid, a contribution to the potential of mean force caused by the tension can be obtained by averaging over all orientations. This rotational averaging gives a contribution to the free energy of the chain given by
 |
1 |
F is the force on the ends, lend is the distance between the ends of the chain, and β is the inverse temperature. (The unit of distance is the separation of points in the lattice. Therefore two neighboring beads in the chain are a distance 1 apart.) This free energy contribution was first obtained by Wall in his theory of rubber elasticity (11).
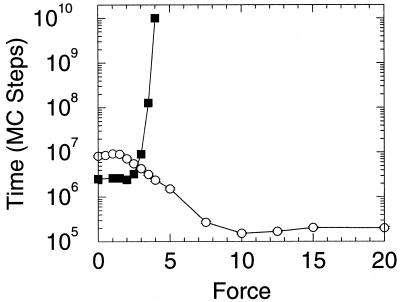
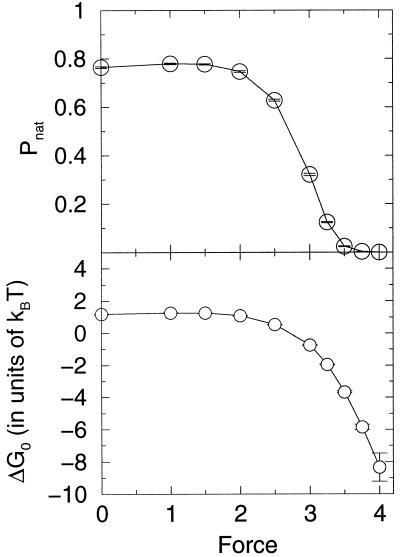
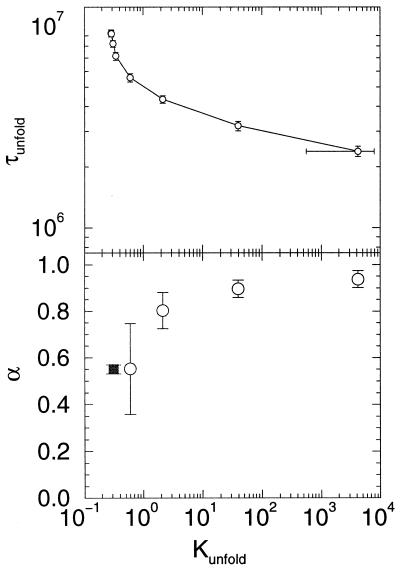
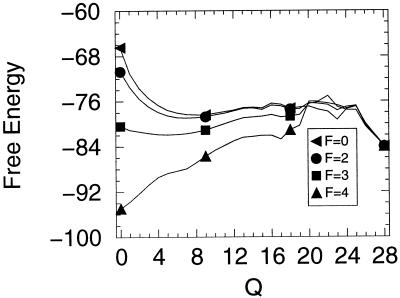
Lattice simulations were carried out with Monte Carlo kinetics (8, 9) using the sum of the internal (contact) energies and the stretch free energy contribution given by Eq. 1. The simulations were run at a temperature for which 76% of the time the system was in the ground state with no applied force. (In our simulation units, this condition represents a temperature of 1.4. Energies are measured in units of temperature, i.e., kb = 1. Again, the unit of length is the distance between neighboring residues in the chain.) Both folding and unfolding runs were performed. In addition, the multiple histogram method was used to evaluate the protein stability as well as free energy profiles as a function of the external force. In Fig. 1 we exhibit the unfolding times of the model protein as a function of the tensile force. The three regimes described in the beginning of these sections are clearly evident. For small and large forces, the logarithm of the unfolding time is roughly independent of the force, whereas for intermediate values it has a linear dependence on force. In Fig. 2 the stability of the lattice protein is plotted. Folding rates are related to the stability through an extrathermodynamic relationship, which is illustrated in Fig. 3. The location of the transition state in the Q coordinate is given by the slope of this curve (shown in Fig. 3). Q is a measure of the number of native contacts for any given conformation. For the 27-mer model, its maximum value is 28. This transition state plot can be compared with the plots of free energy as a function of Q (Fig. 4). There is very good agreement between both methods in locating the transition state and both concur that as the force is increased the transition state moves toward the folded (native) state. By the time the force as reached a value of 4 the unfolding is downhill, with a barrier at Q ≈ 22.
Figure 1.
Unfolding and folding times versus end-to-end stretching force. The simulation temperature was 1.4, which is slightly below the folding temperature for this sequence (Tf = 1.51). The unfolding time was defined as the time (in Monte Carlo steps) it took to reach a state of Q <6. We see three different regimes. At very low and very high force the unfolding time is roughly independent of the force. At intermediate forces the relation between the unfolding time and the force appears linear. Also shown is the equilibrium folding time, which is calculated from the unfolding time and the equilibrium constant (τf = Kuτu). Once the force becomes large enough to destabilize the compact state the folding time grows rapidly.
Figure 2.
Stability vs. stretching force. (Upper) The probability of being in the native state Pnat as a function of the stretching force. We can define an equilibrium unfolding force, the force at which Pnat = 0.5, which is approximately 2.7. (Lower) The free-energy difference (ΔG0) as a function of force.
Figure 3.
The unfolding time versus stability plot (Upper) and its negative slope (Lower) vs. Kunfold. The extra point (■) was determined by using a denaturant simulation without any force (17). α corresponds with the transition state ensemble location, α = Q†/Qnative.
Figure 4.
Free energy as a function of Q for various pulling force strengths. For weak forces the transition state remains fixed, but for moderately high forces the transition state moves closer to the native state, changing from an initial value of ≈16 to ≈22 by the time the force reaches 4.
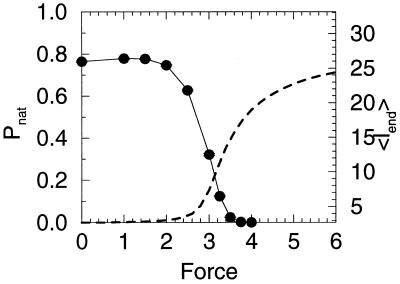
Additionally, there seems to be two separate transitions as the force is increased. Fig. 5 shows both the native state stability and the end-to-end distance as a function of the pulling force. One interesting point is that the system actually becomes more stable as the force increases initially. This surprising effect arises from the relation of the end-to-end distance of the native state (lnat) and the average end-to-end distance of collapsed molten globule states (lMG). In our particular structure lnat =  is greater than lMG ≈2.71, so there is a slight stabilization with small forces. Other structures in the collapsed molten globule (before the force is strong enough to break bonds) could have lnat less than or equal to lMG. Indeed it is often the case for real proteins that the two ends often are found near each other. This initial counterintuitive stabilization should be rarely observed in the laboratory. However, the important point here is not the initial stabilization at small forces (which might not happen for other structures or proteins) but that it indicates the unfolding transition is from the native state to an ensemble of compact states with relatively small end-to-end separation, not a transition from the native state to fully stretched-out states probed by large forces. Again, examining Fig. 5 we see that substantial unfolding is reached (i.e., when half of the molecules have unfolded) whereas the end-to-end length is still relatively short (≈5). It is not until much larger forces that the chain fully stretches out.
Figure 5.
Stability and end-to-end distance as a function of pulling force. One interesting point, the system becomes more stable as the force increases initially. This effect is not universal, but is the result of the relation of the end-to-end distance of the native state (lnat) and the average end-to-end distance of collapsed molten globule states (lMG). Note the protein unfolds before a substantial increase of the end-to-end distance occurs, indicating that there are possibly two overlapping transitions: an unfolding event and then an elongation event.
In the spirit of the landscape theory for protein folding, we now present a simple model that accounts for the mechanism observed in these simulations. In our earlier work for this lattice model, we have shown that the “protein” folds as a two-state system with a folded minimum and a collapsed molten globule minimum. We call the latter state a molten globule because it has only a modest degree of nativeness (around 25%). For a careful discussion of this model, the nature of the folded, transition, and molten-globule states as well as for the connection between this model and the folding of real proteins, the reader is referred to ref. 5. The unfolded state substantially changes in the presence of the force. It may not be collapsed any more, because contacts get broken as the force is increased. In the most simplified way, the unfolded state can be represented by a partially collapsed globule plus extended tails of the chain. The size of these extended tails and of the globule changes with the strength of the applied force. In this model, the partition function can be written as
 |
2 |
 |
where N0 is the total number of chain residues and N is the number of residues of the partial globule. ld(N) is the end-to-end length of the partial globule plus extended tails and is a function of N. For n = N0, ld is the average end-to-end distance for the collapse molten globule, while for n = 0, it is the full length of the chain (N0 − 1). For simplicity, we treat the energy of the globules as a linear function, although its energy depends on the number of contacts, which is not exactly proportional to N. Within the capillarity approximation, suitable for much longer chains, an additional surface term giving rise to cooperativity, at least, could be added (12, 13).
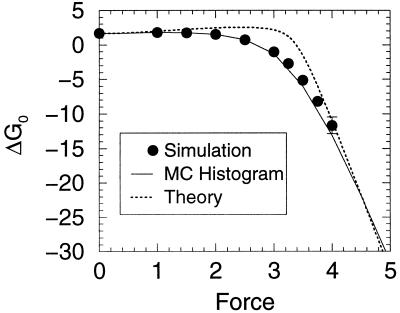
The thermodynamic behavior observed in the simulations is well described with the simple partition function described above. The corresponding fit to the stabilization free energy as function of stretching force is shown in Fig. 2. The results are presented in Fig. 6, and the agreement is excellent considering the simplicity of the underlying picture. The energy for the folded state (Enat = −84) is the exact value for the lattice model and (Fmg = −82.2) is chosen to give the appropriate folding temperature for the system in the absence of forces. A simple function is used to represent the length of a stretched globule with appended tails
 |
3 |
but the results are not too sensitive to this choice as long as the limits for large and small N are preserved. lmg is fitted to a value 2, which is very close to the actual value. The fact that the transition to an extended unfolded state occurs at the same force as the simulation result supports the theoretical picture of the unfolded state. In our units, the energy to break a strong contact is equal to 3. Breaking one of the end contacts should increase the end-to-end length by a distance around unit. Therefore, if we set δenergy = force × Δl, a force of ≈3 is obtained, exactly where the transition is observed. Therefore, as expected, as soon as the force crosses the threshold of 3, the transition state rapidly moves toward the folded state (see Fig. 4). These estimates are at least qualitatively in line with what has been observed in the experiments for titin, where the typical forces for unfolding transitions are reported around 20–30 pN (3). A typical noncovalent contact in a protein is of the order of 2 Kcal/mol, i.e., around 20 pNnm. As contacts are broken, the protein tails should start to increase by lengths in the range of nm (14, 15), leading to forces with the intensities just described above.
Figure 6.
A comparison between the simulated results (see Fig. 2) and the theoretical model discussed in the text (see Eq. 3). The energy for the folded state (Enat = −84) is the exact value for the lattice model and Fmg = −82.2 is chosen to give the appropriate folding temperature for the system in the absence of forces. A simple function is used to represent ld(N) = (1 + lmg)(N/N0)1/3 + N0 − 1 − N. A exact value is used for lnat = 2.7 and lmg is fitted to a value 2, which is very close to the actual value.
In the experiments on the unfolding of titin (1–3), each of the domains resembles Ig or fibronectin and are 89–100 aa long. Entropically these proteins are of similar size to the fast folding proteins that have landscapes modeled by the 27-mer lattice model, but unfortunately, for making faithful comparisons of the present simulation with experiments, at the stability midpoint, these domains fold much slower than our model (16). This finding suggests that there may be additional sources to the thermodynamic free energy barrier beyond the entropic contribution important in the simulation. Indeed this particular protein must be more resistant to unfolding than most to have appropriate mechanical responses in the cell. Schulten and collaborators (7) recently have simulated the unfolding of a titin domain under strong forces. They have concluded the transition state ensemble is nearly completely native-like consistent with what would be found in the lattice model. Under these conditions, the first contacts to be broken apparently are close to the two ends of the molecule, which suggests that evolution has increased the number or strengthened the contacts in this region. It would be interesting to perform similar experiments on a fast folding helical protein not involved in mechanical functions in the cell. Here the expected variation of transition state location with force should be more readily observed.
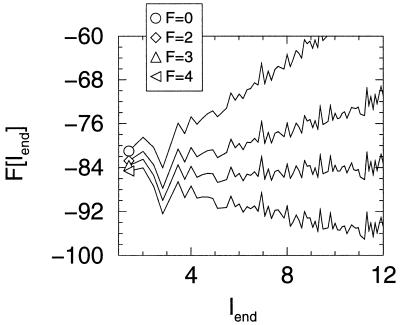
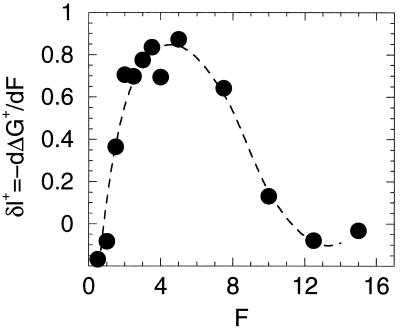
It has become common to use force experiments to plot free energy curves for folding with end-to-end length as the reaction coordinate. This way of presenting the results can give a very different picture from the reaction profile based on order parameter tied to the degree of nativeness. Fig. 4 plots the free energy profile as a function of Q for various forces. Notice the barriers are quite broad. In contrast, in Fig. 7, the free energy barrier seems quite sharp and well defined, but the profile changes dramatically with stress. The force dependence of the rate often is written by using an Eyring-like expression where the displacement in the transition state δl† = −dΔG†/d(force). This effective transition state displacement in the Q coordinate can be obtained from Figs. 3 and 4. For forces larger than 3 or 4, we notice that the transition state is located very close to the folded state, while, in the absence of forces, this transition state is halfway between the folded and unfolded states. The consequences of this shift are illustrated in Fig. 8, where the values for δl† are shown. For small forces, δl† ≈0 because the free energy barrier is very insensitive to the force. When the forces are sufficiently large to start to be able to break contacts (F ≈ 3), δl† is close to the unit lattice length. For very large forces, where the reaction becomes downhill, δl† again falls to zero. Although this is a model system, it illustrates a possible difficulty in interpreting the effective displacement inferred in the laboratory as a literal geometrical parameter of a particular member of the transition state ensemble. That the apparent δl† is so small (3.0 Å) is entirely to be expected because in the presence of large forces, as soon as one or very few contacts are broken, the entire protein unfolds. Again, this can be easily seen in Figs. 4 and 8.
Figure 7.
Free energy as a function of the end-to-end separation (lend) for several different values of the pulling forces. The curves were calculated by using the Monte Carlo histogram technique. Note, the ruggedness at a larger separation is the result of sampling error.
Figure 8.
Effective transition state displacement (δl) versus force. The plot is computed from the transition state free energy barrier by: δl = −∂ ΔG‡/∂F. The barrier height was estimated by using the data in Fig. 1 assuming a simple Kramer’s form for the unfolding time, ΔG‡ = Tlogτu + C. The slight negative values at small force are the result of the fact that this particular native state is stabilized by a small stretching force. The dotted line is a polynomial fit to the data as an aid to the reader.
Conclusion
As we can see, stretching provides a powerful experimental tool to explore the protein folding energy landscape. In combination with a careful study of the time dependence of unfolding and the use of different thermodynamic conditions that can tune the stability of contacts, we believe that a comprehensive view of the forces involved in folding will arise.
Acknowledgments
Work at the University of California at San Diego was funded by the National Science Foundation (Grant MCB-9603839) and the University of California/Los Alamos Research (CULAR) Initiative, at the University of Illinois by the National Institutes of Health (Grant 1R01 GM44557), at Bell Laboratories by Lucent Technologies, and at The Rockefeller University by the National Science Foundation (Grant DMR-7932803) and the Alfred P. Sloan Foundation.
Footnotes
A detailed description of the model can be found in refs. 8–10. The energy function used is a contact energy in which monomers that are nearest neighbors on the lattice are considered in contact. There are two terms, one of which is the number of like contacts, Nl, (i.e., contacts between monomers of the same type) and the other of which is the number of unlike contacts, Nu. The contact part of the energy is then: Econt = NlEl + NuEu. El and Eu set the strengths of like and unlike contacts, respectively. In this work they are −3 and −1, respectively. The sequence used was ABABBBCBACBABABACACBACAACAB.
References
- 1.Tskhovrebova L, Trinick J, Sleep J A, Simmons R M. Nature (London) 1997;387:308–312. doi: 10.1038/387308a0. [DOI] [PubMed] [Google Scholar]
- 2.Rief M, Gautel M, Oesterhelt F, Fernandez J M, Gaub H E. Science. 1997;276:1109–1111. doi: 10.1126/science.276.5315.1109. [DOI] [PubMed] [Google Scholar]
- 3.Kellermayer M S Z, Smith S B, Granzier H L, Bustamante C. Science. 1997;276:1112–1116. doi: 10.1126/science.276.5315.1112. [DOI] [PubMed] [Google Scholar]
- 4.Wang J, Wolynes P. Phys Rev Lett. 1995;74:4317–4320. doi: 10.1103/PhysRevLett.74.4317. [DOI] [PubMed] [Google Scholar]
- 5.Onuchic J N, Wolynes P G, Luthey-Schulten Z, Socci N D. Proc Natl Acad Sci USA. 1995;92:3626–3630. doi: 10.1073/pnas.92.8.3626. [DOI] [PMC free article] [PubMed] [Google Scholar]
- 6.Leopold P E, Montal M, Onuchic J N. Proc Natl Acad Sci USA. 1992;89:8721–8725. doi: 10.1073/pnas.89.18.8721. [DOI] [PMC free article] [PubMed] [Google Scholar]
- 7.Lu H, Isralewitz B, Krammer A, Vogel V, Schulten K. Biophys J. 1998;75:662–671. doi: 10.1016/S0006-3495(98)77556-3. [DOI] [PMC free article] [PubMed] [Google Scholar]
- 8.Socci N D, Onuchic J N. J Chem Phys. 1994;101:1519–1528. [Google Scholar]
- 9.Socci N D, Onuchic J N. J Chem Phys. 1995;103:4732–4744. [Google Scholar]
- 10.Socci N D, Nymeyer H, Onuchich J N. Physica D. 1997;107:366–382. [Google Scholar]
- 11.Wall F T. J Chem Phys. 1942;132:485. [Google Scholar]
- 12.Wolynes P G. Proc Natl Acad Sci USA. 1997;94:6170–6175. doi: 10.1073/pnas.94.12.6170. [DOI] [PMC free article] [PubMed] [Google Scholar]
- 13.Finkelstein A V, Badretdinov A Y. Folding Design. 1997;2:115–121. doi: 10.1016/s1359-0278(97)00016-3. [DOI] [PubMed] [Google Scholar]
- 14.Hagen S J, Hofrichter J, Szabo A, Eaton W A. Proc Natl Acad Sci USA. 1996;93:11615–11617. doi: 10.1073/pnas.93.21.11615. [DOI] [PMC free article] [PubMed] [Google Scholar]
- 15.Flory P J. Statistical Mechanics of Chain Molecules. New York: Hanser; 1989. [Google Scholar]
- 16.Plaxco K W, Spitzfaden C, Campbell I D, Dobson C M. Proc Natl Acad Sci USA. 1996;93:10703–10706. doi: 10.1073/pnas.93.20.10703. [DOI] [PMC free article] [PubMed] [Google Scholar]
- 17.Onuchic J N, Socci N D, Luthey-Schulten Z, Wolynes P G. Folding Design. 1996;1:441–450. doi: 10.1016/S1359-0278(96)00060-0. [DOI] [PubMed] [Google Scholar]


