Abstract
Voltage dependence and kinetics of CaV1.2 activation are affected by structural changes in pore-lining S6 segments of the α1-subunit. Significant effects are induced by either proline or threonine substitutions in the lower third of segment IIS6 (“bundle crossing region”), where S6 segments are likely to seal the channel in the closed conformation (Hohaus, A., Beyl, S., Kudrnac, M., Berjukow, S., Timin, E. N., Marksteiner, R., Maw, M. A., and Hering, S. (2005) J. Biol. Chem. 280, 38471–38477). Here we report that S435P in IS6 results in a large shift of the activation curve (-25.9 ± 1.2 mV) and slower current kinetics. Threonine substitutions at positions Leu-429 and Leu-434 induced a similar kinetic phenotype with shifted activation curves (L429T by -6.6 ± 1.2 and L434T by -12.1 ± 1.7 mV). Inactivation curves of all mutants were shifted to comparable extents as the activation curves. Interdependence of IS6 and IIS6 mutations was analyzed by means of mutant cycle analysis. Double mutations in segments IS6 and IIS6 induce either additive (L429T/I781T, -34.1 ± 1.4 mV; L434T/I781T, -40.4 ± 1.3 mV; L429T/L779T, -12.6 ± 1.3 mV; and L434T/L779T, -22.4 ± 1.3 mV) or nonadditive shifts of the activation curves along the voltage axis (S435P/I781T, -33.8 ± 1.4 mV). Mutant cycle analysis revealed energetic coupling between residues Ser-435 and Ile-781, whereas other paired mutations in segments IS6 and IIS6 had independent effects on activation gating.
Ca2+ current through CaV1.2 channels initiates muscle contraction, release of hormones and neurotransmitters, and affects physiological processes such as vision, hearing, and gene expression (1). Their pore-forming α1-subunit is composed of four homologous domains formed by six transmembrane segments (S1–S6) (2). The signal of the voltage-sensing machinery, consisting of multiple charged amino acids (located in segments S4 and adjacent structures of each domain), is transmitted to the pore region (3). Conformational changes in pore lining S6 and adjacent segments finally lead to pore openings (activation) and closures (inactivation).
Our understanding of how CaV1.2 channels open and close is largely based on extrapolations of structural information from potassium channels. The crystal structures of the closed conformation of two bacterial potassium channels (KcsA and MlotiK) (4, 5) show a gate located at the intracellular channel mouth formed by tightly packed S6 helices. The crystal structure of the open conformation of Kv1.2 (6, 7) revealed a bent S6 with the highly conserved PXP motif apparently acting as a hinge (see 8). The activation mechanism proposed for MthK channels involves helix bending at a highly conserved glycine at position 83 (see Ref. 9, “glycine gating hinge” hypothesis).
Compared with potassium channels, the pore of CaV is asymmetric, and none of the four S6 segments has a putative helix-bending PXP motif. Furthermore, the conserved glycine (corresponding to position 83 in MthK, see Ref. 10) is only present in segments IS6 and IIS6 (for review see Ref. 11). We have shown that substituting proline for this glycine in IIS6 of CaV1.2 does not significantly affect gating (12).
Zhen et al. (13) investigated the pore lining S6 segments of CaV2.1 using the substituted cysteine accessibility method. The accessibility of cysteines was changed by opening and closing the channel, consistent with the gate being on the intracellular side. The general picture of a channel gate close to the inner channel mouth of CaV1.2 was recently supported by pharmacological studies (14).
Substitution of hydrophilic residues in the lower third of segment IIS6 of CaV1.2 (LAIA motif, 779–784, see Ref. 12) induces pronounced changes in channel gating as follows: a shift in the voltage dependence of activation accompanied by a slowing of the activation kinetics near the footstep of the m∞(V) curve and a slowing of deactivation at all potentials. Interestingly, these changes in channel gating resemble the effects of proline substitution of Gly-219 in the bacterial sodium channel from Bacillus halodurans (“Gly-219 gating hinge,” see Ref. 15).
The strongest shifts of the activation curve reported so far were observed for proline substitutions (12). As prolines in an α-helix cause a rigid kink with an angle of about 26° (16), we hypothesized that these mutants were causing a kink in helix IIS6 similar to a bend that would normally occur flexibly during the activation process (12).
Here we extend our previous study by systematically substituting residues in segment IS6 of CaV1.2 by proline or the small and polar threonine. Several functional IS6 mutants with shifted activation and inactivation characteristics were identified (S435P, L429T, and L434T), and the interdependence of IS6 and IIS6 mutations was analyzed. Mutant cycle analysis revealed both mutually independent and energetically coupled contributions of IS6 and IIS6 residues on activation gating.
EXPERIMENTAL PROCEDURES
Mutagenesis—The CaV1.2 α1-subunit coding sequence (GenBank™ accession number X15539) in-frame 3′ to the coding region of a modified green fluorescent protein (GFP)3 was kindly donated by Dr. M. Grabner (17). Substitutions in segment IS6 of the CaV1.2 α1-subunit were introduced by the “gene SOEing” technique (18). For electrophysiological studies, we used the plasmid lacking the GFP tag. Proline mutations were introduced in segment IS6 in positions G422P to F424P and N428P to S439P. The mutated fragments were cloned into an SaII-AgeI cassette. The mutated fragment of L779T was cloned into an AgeI-AfIII cassette. The AgeI restriction site was introduced as a silent mutation. This cassette was used to create G422P, S423P, F424P, N428P, L429T/L429P, V430P/V430T, L431P/L431T, G432P/G432T, V433P/V433T, L434T, S435P, E437P, F438P, and S439P. The mutated fragment of L779T was cloned into a AgeI-AfIII cassette. This cassette was used to create L779T, L429T/L779T, L429T/I781T, L434T/L779T, L434T/I781T by two double mutants S435P/I781P and S435P/I781T. Mutants that did not conduct barium currents were recloned into the GFP-tagged vector (17) to analyze whether the channels were expressed in the membrane. All constructs were checked by restriction site mapping and sequencing.
Cell Culture and Transient Transfection—Human embryonic kidney tsA-201 cells were grown at 5% CO2 and 37 °C to 80% confluence in Dulbecco's modified Eagle's/F-12 medium supplemented with 10% (v/v) fetal calf serum and 100 units/ml penicillin/streptomycin. Cells were split via trypsin EDTA and plated on 35-mm Petri dishes (Falcon) at 30–50% confluence ∼16 h before transfection. Subsequently tsA-201 cells were co-transfected with cDNAs encoding wild-type or mutant CaV1.2 α1-subunits with auxiliary β1a (19) as well as α2-δ1 subunits (20). The transfection of tsA-201 cells was performed using the FuGENE 6 transfection reagent (Roche Applied Science) following standard protocols. tsA-201 cells were used until passage number 15. No variation channel gating related to different cell passage numbers was observed.
Ionic Current Recordings and Data Acquisition—Barium currents (IBa) through voltage-gated Ca2+ channels were recorded at 22–25 °C using the patch clamp technique (21) by means of an Axopatch 200A patch clamp amplifier (Axon Instruments, Foster City, CA) 36–48 h after transfection. The extracellular bath solution contained (in mm) the following: BaCl2 5, MgCl2 1, HEPES 10, choline-Cl 140, titrated to pH 7.4 with methanesulfonic acid. Patch pipettes with resistances of 1 to 4 megohms were made from borosilicate glass (Clark Electromedical Instruments, UK) and filled with pipette solution containing (in mm) the following: CsCl 145, MgCl2 3, HEPES 10, EGTA 10, titrated to pH 7.25 with CsOH. All data were digitized using a DIGIDATA 1200 interface (Axon Instruments, Foster City), smoothed by means of a four-pole Bessel filter and saved to a disk. 100-ms current traces were sampled at 10 kHz and filtered at 5 kHz; for the steady-state inactivation protocol, currents were sampled at 1 kHz and filtered at 0.5 kHz; and tail currents were sampled at 50 kHz and filtered at 10 kHz. Leak currents were subtracted digitally using average values of scaled leakage currents elicited by a 10-mV hyperpolarizing pulse or electronically by means of an Axopatch 200 amplifier (Axon Instruments). Series resistance and offset voltage were routinely compensated. The pClamp software package (version 7.0, Axon Instruments) was used for data acquisition and preliminary analysis. Microcal Origin 5.0 was used for analysis and curve fitting.
To analyze the voltage dependence of activation, we estimated the fractions of open (activated) channels at different potentials at the current peak when channel opening reached a saturating level, and inactivation was still small. Current-voltage (I-V) curves were fitted according to the following modified Boltzmann equation: I = Gmax(V - Vrev)/(1 + exp((V0.5,act - V)/kact)), where Vrev is extrapolated reversal potential; V is membrane potential; I is peak current; Gmax is maximum membrane conductance; V0.5, act is voltage for half-maximal activation; and kact is slope factor. The voltage dependence of activation was determined from I-V curves and fitted to m∞ = 1/(1 + exp((V0.5,act - V)/kact)). The time course of current activation was fitted to a monoexponential function as follows: I(t) = A(exp(-t/τ)) + C, where I(t) is current at time t; A is the amplitude coefficient; τ is time constant; and C is steady state current. The voltage dependence of IBa inactivation (inactivation curve) was measured using a multistep protocol to account for run down (22). The pulse sequence was applied every 40 s from a holding potential of -100 mV. Inactivation curves were drawn according to a Boltzmann equation as follows: IBa, inact = Iss + (1 - Iss)/(1 + exp((V - V0.5,inact)/k)), where V is membrane potential; V0.5, inact is midpoint voltage; k is slope factor; and Iss is fraction of noninactivating current. Data are given as mean ± S.E. Statistical significance was assessed with analysis of variance and post hoc test. Student's unpaired t test was used to analyze significance of differences from 0 (ΔΔG).
Confocal Imaging—Images were obtained ∼30 h after transfection. The images were acquired with a Zeiss Axiovert 200 M microscope equipped with an LSM 510 laser scanning module, using a 63× (1.4 NA) oil immersion objective. Fluorescence from GFP-tagged CaV1.2 α1-subunits was excited at 488 nm using an argon laser, and emitted light was recorded with a 505–530 nm bandpass filter. The plasma membrane was stained with 2 μm FM4-64 (an amphiphilic styryl dye, Molecular Probes). The dye was detected with a helium-neon laser (excitation, 543 nm) in combination with a 650 nm long pass filter. The instrument was operated in the multitracking mode to minimize channel cross-talk. Pinholes were adjusted to obtain optical slices of 1-μm thickness for each channel.
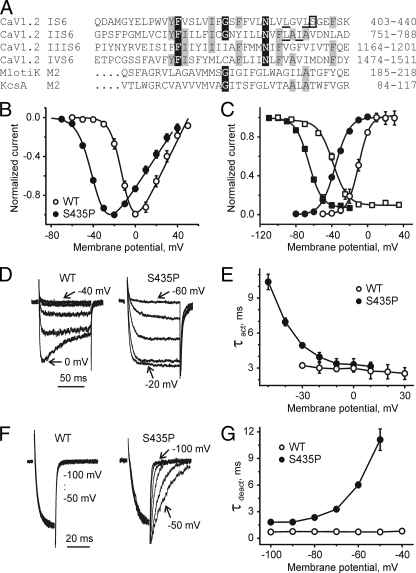
Homology Modeling—Models of the pore-forming α1-subunit of the closed CaV1.2 channel (accession number P15381) are based on the crystal structures of MlotiK (5) and KcsA (4). Sequence similarities between CaV1.2 S6 segments and MlotiK/KcsA M2 helices are in the range of 22–40%. The alignment used is the same one as suggested previously (Fig. 1A) (14). Models were built with the Modeler software (23) using the same modeling criteria as described previously (14, 24). Briefly, the four CaV1.2 domains were arranged in a clockwise manner in agreement with previous studies (24–29). Large extra- and intracellular loops have been omitted from the model, due to lack of suitable structure templates. The selectivity filter of CaV1.2 is based on homology model of the bacterial sodium channel from B. halodurans (25). The model quality has been analyzed using conventional validation programs.
FIGURE 1.
Gating changes induced by mutation S435P in CaV1.2. A, alignment of pore-lining S6 segments of CaV1.2 with pore-lining M2 helices of K+ channels MlotiK (Protein Data Bank code 3beh) and KcsA (Protein Data Bank code 1k4c). Positions with four identical residues are boxed in black, and positions with three identical residues are shaded gray. Residue Ser-435 in segment IS6 is boxed, whereas other residues of interest are underlined. B, averaged current-voltage relationships of activation of wild-type (n = 8) and mutant S435P (n = 6). C, steady-state activation and inactivation of wild-type (WT) (open symbols) and mutant S435P (filled symbols, see Table 1 for shifts of V0.5). D, representative families of IBa through wild-type and S435P mutant channels during depolarizing test pulses from -100 mV. E, mean time constants of channel activation for wild-type (n = 8) and S435P (n = 6) mutant CaV1.2 channels are plotted versus test potential. F, representative tail currents for wild-type and S435P channels. Currents were activated during a 20-ms conditioning depolarization to 0 mV for wild-type and -30 mV for S435P. Deactivation was recorded during subsequent repolarizations with 10-mV increments starting from -100 mV. G, mean time constants of channel deactivation for wild-type (n = 8) and S435P (n = 6) mutant of CaV1.2 channels are plotted versus test potential. Time constants were estimated by fitting current activation and deactivation to a mono-exponential function (see “Experimental Procedures”).
RESULTS
Proline Scan of IS6 Reveals Large Shift of Activation and Inactivation Curves for Mutant S435P—Amino acids of segment IS6 (most residues between positions 422 and 439) of the CaV1.2 α1-subunit were substituted by prolines and barium (Ba2+) currents measured with patch clamp after co-expression of the α1-subunits with auxiliary β1a and α2-δ1 subunits in tsA-201 cells. Only 1 out of the tested 14 proline mutants (S435P) conducted ionic currents. A family of inward Ba2+ currents and the corresponding current-voltage (I-V) curve of mutant S435P and the voltage dependences of steady-state inactivation are shown in Fig. 1. The current reversed at about 50 mV, indicating that the mutation did not affect ion selectivity (Fig. 1B, similar observations were made for mutants L429T and L434T, data not shown). The midpoint voltage of steady state activation changed from -9.9 ± 1.1 mV in the wild-type channel to -35.8 ± 0.6 mV in S435P mutant (Fig. 1). The mutation also shifted the midpoint voltage of the inactivation curve from -38.7 ± 1.0 mV in wild-type channels to -65.7 ± 0.7 mV (Fig. 1C) and substantially slowed channel inactivation. Wild-type channels were inactivated by 65 ± 4%, whereas mutation S435P was inactivated by 5 ± 4% during a 300-ms pulse at the peak of the I-V curve (see Table 1). In Fig. 1, E and G, the corresponding changes in current activation and deactivation kinetics are illustrated. The activation time constant of S435P ranged between 10.4 ms (-50 mV) and 3.1 ms (10 mV) (Fig. 1E), and at -30 mV the mutant displayed a 1.5-fold slower activation time course than wild type.
TABLE 1.
Influence of pore mutations on voltage-dependent gating of CaV1.2 Midpoints and slope factors of the activation curves, midpoints of the inactivation curves, and amount of channel inactivation during a 300-ms pulse (r300) to the peak potentials of the I-V curve are shown. Numbers of experiments are indicated in parentheses.
| Mutant | V0.5, act | kact | V0.5, inact | kinact | r300 |
|---|---|---|---|---|---|
| mV | mV | mV | mV | % | |
| Wild-type | –9.9 ± 1.1 (8) | 6.3 ± 0.7 | –38.7 ± 1.0 (3) | 8.1 ± 0.9 | 65 ± 4 |
| IS6 segment | |||||
| L429T | –16.5 ± 0.6 (5) | 7.5 ± 0.6 | –42.5 ± 1.1 (3) | 7.9 ± 0.9 | 69 ± 6 |
| L434T | –21.9 ± 1.3 (5) | 6.9 ± 0.9 | –51.1 ± 1.1 (3) | 8.6 ± 1.0 | 63 ± 5 |
| S435T | –11.3 ± 0.7 (5) | 6.1 ± 0.6 | –40.1 ± 0.9 (3) | 7.7 ± 0.8 | 64 ± 6 |
| S435A | –15.9 ± 0.6 (6) | 6.9 ± 0.5 | –44.1 ± 0.9 (4) | 7.8 ± 0.9 | 70 ± 5 |
| S435P | –35.8 ± 0.6 (6) | 8.8 ± 0.6 | –65.7 ± 0.7 (4) | 7.3 ± 0.7 | 5 ± 4a |
| IIS6 segment | |||||
| L779T | –18.6 ± 0.7 (5) | 6.4 ± 0.6 | –50.5 ± 1.2 (3) | 7.1 ± 0.6 | 12 ± 5a |
| I781T | –37.7 ± 1.2 (7) | 7.2 ± 1.0 | –57.8 ± 0.7 (3) | 8.9 ± 0.5 | 47 ± 3a |
| I781P | –47.2 ± 1.1 (8) | 6.3 ± 0.6 | –68.7 ± 0.8 (5) | 5.8 ± 0.5 | 53 ± 6 |
| Double mutants | |||||
| L429T/I781T | –44.0 ± 1.0 (7) | 8.3 ± 0.9 | –61.2 ± 1.0 (4) | 8.7 ± 0.9 | 41 ± 5a |
| L429T/L779T | –22.5 ± 0.8 (5) | 6.4 ± 0.7 | –49.6 ± 1.3 (3) | 8.0 ± 0.7 | 12 ± 6a |
| L434T/I781T | –50.3 ± 0.8 (5) | 5.4 ± 0.8 | –70.0 ± 1.6 (3) | 8.5 ± 1.2 | 15 ± 4a |
| L434T/L779T | –32.3 ± 0.8 (7) | 7.1 ± 0.7 | –58.2 ± 0.8 (5) | 8.2 ± 0.9 | 52 ± 5 |
| S435A/I781T | –35.3 ± 0.9 (6) | 8.7 ± 0.7 | –59.1 ± 0.9 (4) | 8.1 ± 0.8 | 48 ± 4a |
| S435P/I781T | –43.7 ± 0.9 (5) | 9.1 ± 0.9 | –64.1 ± 1.1 (3) | 8.6 ± 1.0 | 44 ± 5a |
| S435P/I781P | No current |
Data are statistically significantly different from wild type (p < 0.05). Data for wild type, I781T, and I781P are from Hohaus et al. (12). Mutations G422P, S423P, F424P, N428P, L429P, V430T/V430P, L431T/L431P, G432T/G432P, V433T/V433P, L434P, E437P, F438P, and S439P were not functional
Membrane expression of “nonconducting” constructs was examined by analyzing the subcellular distribution of GFP-tagged mutants by confocal microscopy. Wild-type and mutant GFP-tagged CaV1.2 α1-subunits were co-transfected with β1a and α2-δ1 subunits in tsA-201 cells, and the plasma membrane was visualized by staining with FM4-64. Consistent with our previous report (12), GFP-tagged nonfunctional proline mutants localized predominantly at the plasma membrane (data not shown). These findings demonstrate that the lack of current observed for these constructs is unlikely to be caused by a failure of the α1-subunits to reach the plasma membrane.
Threonine Mutations Shift the Voltage Dependence of CaV1.2 Gating—More than 90% of the proline mutants in segment IS6 did not conduct barium currents (Table 1). This distinguishes this segment from IIS6, where 8 of 14 (almost 60%) proline substitutions resulted in functional channels (12).
We have recently shown that gradual changes in hydrophobicity in selected positions of transmembrane segment IIS6 gradually shift the activation and inactivation curves of CaV1.2 (see Ref. 11). To elucidate a potential role of hydrophobic interactions in segment IS6, we systematically substituted the putative bundle crossing region (residues 429–434) by the small and polar threonine.
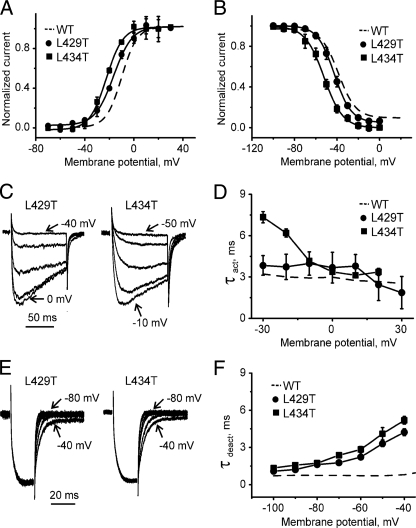
Constructs L429T and L434T conducted barium currents, whereas other threonine mutations did not result in functional channels (Fig. 2 and Table 1). L429T and L434T shifted the voltage dependence of channel activation in the hyperpolarizing direction and slightly slowed activation and deactivation kinetics. The largest shift in channel activation and the correspondingly slowest kinetics of current activation and deactivation were observed, however, for L434T suggesting a potentially important role of this residue in CaV1.2 gating.
FIGURE 2.
Gating changes induced by threonine mutations in segment IS6 of CaV1.2. A and B, averaged current-voltage relationships of activation (A) and inactivation (B) of the wild-type (WT) (dashed line, n = 8), L429T (n = 5), and L434T (n = 5) mutant channels. C, representative families of IBa through L429T and L434T mutant channels during depolarizing test pulses from -100 mV. L429T or L434T mutant CaV1.2 α1-subunits were co-expressed together with β1a and α2-δ1 subunits. D, mean time constants of channel activation for wild-type (dotted line, n = 8), L429T (n = 5), and L434T (n = 5) mutant CaV1.2 channels are plotted versus test potential. E, representative tail currents for L429T and L434T channels. Currents were activated during a 20-ms conditioning depolarization to -10 mV. Deactivation was recorded during subsequent depolarization with 10-mV increments starting from -100 mV. F, mean time constants of channel deactivation for wild-type (dotted line, n = 8), L429T (n = 5), and L434T (n = 5) mutant CaV1.2 channels are plotted versus test potential. Time constants were estimated by fitting current activation and deactivation to a mono-exponential function (see “Experimental Procedures”).
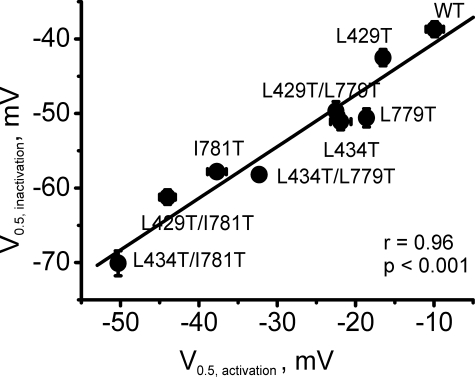
In line with our previous observations in segment IIS6, the changes in the voltage dependences of activation and inactivation occurred in parallel, which can be seen in Fig. 8 where midpoint voltages of activation curves are plotted versus midpoint voltages of inactivation curves. However, such a correlation is not observed for all CaV channel constructs (e.g. Spaetgens and Zamponi (30), Stotz and Zamponi (31), see also the IIS6 mutations A780P in Hohaus et al. (12)), and the structural basis is currently unknown.
FIGURE 8.
Correlation between potentials of half-maximal activation (V0.5, activation) and half-maximal inactivation (V0.5, activation) of the CaV1.2 mutants. Linear regression yieldeda correlation coefficient of 0.96. WT, wild type.
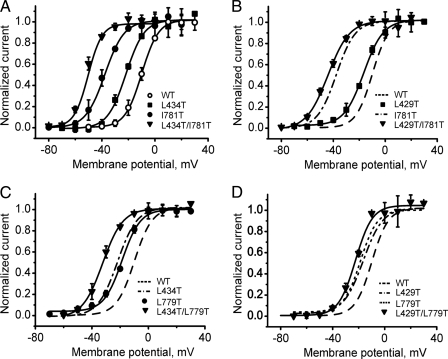
Paired Mutations in Segments IS6 and IIS6 Inducing Additive Shifts of the Activation Curve—After identification of “gating sensitive” residues in segments IS6, we made use of previously characterized mutants in segment IIS6 to study if these structural changes contribute to channel gating independently or in a coupled fashion. First we analyzed the combined impact of the IIS6 mutations L779T (-9-mV shift) and I781T (-28-mV shift, see Ref. 12) and the newly identified residues in segment IS6 L429T and L434T (causing shifts of about -7 and -12 mV, see Table 1).
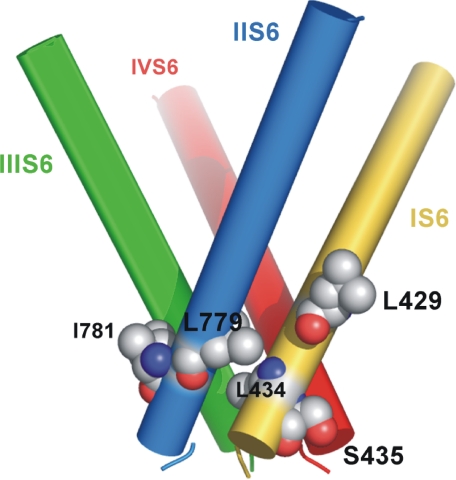
According to our homology model of the closed conformation, all four residues are located in close proximity (Fig. 9), where residues Leu-434 (IS6) and residue Leu-779 (IIS6) interact directly with each other and residues Ser-435 and Ile-781 interact with residues from neighboring S6 helices. It was therefore interesting to elucidate if the mutations in these regions of IS6 and IIS6 would have additive (independent) or nonadditive effects on the channel activation and inactivation curves.
FIGURE 9.
Illustration of the bundle crossing region of CaV1.2 in the closed channel conformation. Side view of S6 segments with residues Leu-429 and Leu-434 from IS6 and Leu-779 and Ile-781 from IIS6 are shown as spheres. Residues Leu-434 and Leu-779 are part of tight helix-helix packing between segment IS6 and IIS6, whereas residues Ser-435 and Ile-781 interact with neighboring S6 segments. Figure was generated with PyMOL.
As shown in Fig. 3, the impact of all four mutations in segments IS6 and IIS6 on the activation curves was additive. The voltage of half-maximal channel activation of construct L434T/I781T was shifted by -40 mV (-12 to 28 mV) and of construct L429T/I781T by -34 mV (-7 to 28 mV). Less prominent shifts were observed for L429T/L779T (≈-12 mV) and L434T/L779T (≈-22 mV) constructs.
FIGURE 3.
Additive shifts of the voltage dependences of channel activation. A–D, averaged voltage dependences of activation of wild-type (WT) (n = 8), I781T (n = 7), L434T (n = 5), L429T (n = 5), L779T (n = 5), and corresponding double mutants L434T/I781T (n = 5), L429T/I781T (n = 7), L434T/L779T (n = 7), and L429T/L779T (n = 5). The midpoints of the curves of the double mutants were approximately shifted by the sum of the shifts estimated for the single mutants (see Table 1).
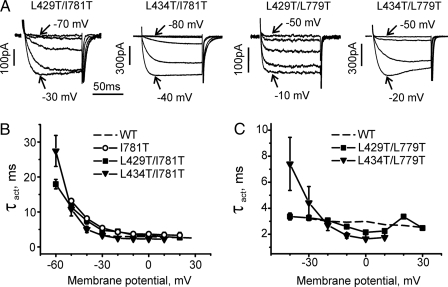
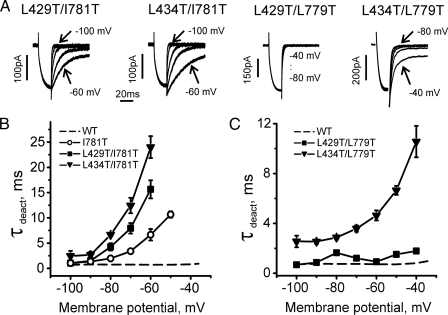
Double mutants L429T/I781T and L434T/I781T displayed slow activation at hyperpolarized potentials (Fig. 4). The large shift of the activation curve of L434T/I781T was associated with a slower activation (τact ≈27 ms at -60 mV) than measured for I781T (13 ms at -50 mV) and a reduced rate of inactivation (Table 1). Deactivation in double mutants L429T/I781T and L434T/I781T was slower than in the single mutant I781T at all potentials (Fig. 5). A slowing of inactivation was also observed for double mutants L429T/L779T (Table 1).
FIGURE 4.
Paired mutations in segments IS6 and IIS6 decelerate the activation kinetics. A, families of IBa through L429T/L779T, L429T/I781T, L434T/L779T, and L434T/I781T double mutant channels. IBa values were evoked during depolarizations from the holding potential of -100 mV. The activation time constants (τact) were obtained by fitting the activation phase of IBa to a mono-exponential function. B and C, voltage dependence of mean time constants of activation for wild-type (WT) (dashed line, n = 8) in comparison with L429T/L779T (n = 5), L429T/I781T (n = 7), L434T/L779T (n = 7), and L434T/I781T (n = 5) mutant channels.
FIGURE 5.
Paired mutations in segments IS6 and IIS6 decelerate deactivation kinetics. A, representative IBa tail currents for L429T/L779T, L429T/I781T, L434T/L779T, and L434T/I781T. Currents were activated during a 20-ms conditioning depolarization to -10 mV for L429T/L779T, -40 mV for L429T/I781T, -20 mV for L434T/L779T, and -40 mV for L434T/I781T. Deactivation was recorded during subsequent repolarizations with 10-mV increments starting from -100 mV. B and C, voltage dependence of mean time constants of deactivation of wild-type (WT) (n = 8) and mutant I781T (n = 7) in comparison with L429T/L779T (n = 5), L429T/I781T (n = 7), L434T/L779T (n = 7), and L434T/I781T (n = 5). Time constants were estimated by fitting current deactivation to a mono-exponential function (see “Experimental Procedures”).
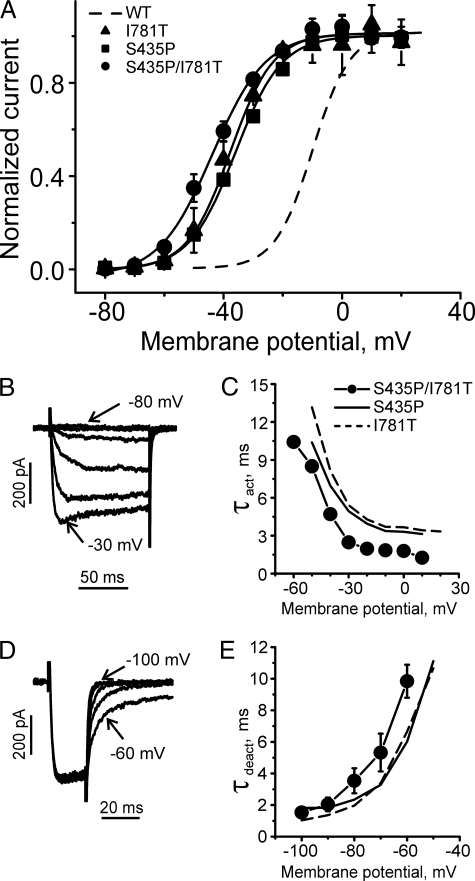
Paired Mutations in Segments IS6 and IIS6 Inducing Nonadditive Shifts of the Activation Curve—Paired mutation of S435P (IS6, Fig. 1) and I781P (IIS6, see Ref. 12), each inducing a strong shift of the activation curve by -26 and -37 mV respectively, did not result in a conducting channel (Table 1). Double mutant S435P/I781T was functional, however (see Fig. 6). The corresponding shifts of the channel activation curves of S435P (-26 mV) and I781T (-28 mV) were not additive (-26 to -28 mV ≠ -33 mV, see Fig. 6A). Interestingly, the activation and deactivation time course of S435P/I781T resembled the kinetics of single mutants I781T and S435P (compare Fig. 6, B–E). Nonadditive shifts of the activation curves indicate energetic coupling of the underlying conformational changes in segment IS6 and IIS6 (32).
FIGURE 6.
Gating of double mutant S435P/I781T. A, averaged activation curves of mutants S435P/I781T (n = 5), S435P (n = 6), and I781T (n = 7). Wild type (WT) channel activation curve is shown by the dashed line. B, representative IBa through double mutant S435P/I781T during depolarizing pulses from a holding potential of -100 mV (10-mV increments). C, mean time constants of channel activation for S435P/I781T double mutant (n = 5) and S435P (n = 6) and I781T (n = 7) mutants are plotted versus test potential. D, representative tail currents through mutant S435P/I781T. Currents were activated during a 20-ms conditioning depolarization to -10 mV. Deactivation was recorded during subsequent hyperpolarization (10-mV increment) starting from -100 mV. E, mean time constants of channel deactivation for S435P/I781T double mutant (n = 5) and S435P (n = 6) and I781T (n = 7) mutants are plotted versus test potential. Time constants were estimated by fitting current activation and deactivation to a mono-exponential function (see “Experimental Procedures”).
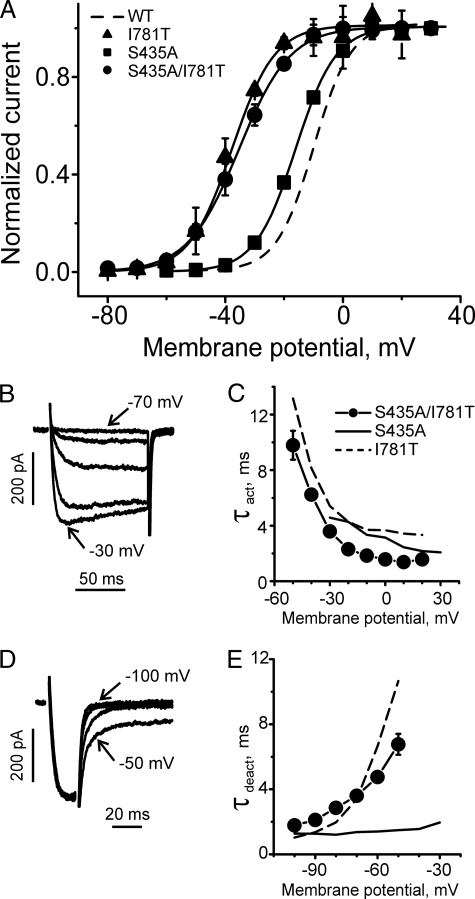
To elucidate whether these changes resulted from helix bending in IS6 by S435P, we additionally analyzed the double mutant S435A/I781T. S435A induced a statistically significant shift of the activation curve into the hyperpolarizing direction by 6 mV. The paired mutation shifted the activation curve, however, to a similar extent as I781T (Fig. 7 and Table 2).
FIGURE 7.
Gating of double mutant S435A/I781T. A, averaged activation curves of mutants S435A/I781T (n = 6), S435A (n = 6), and I781T (n = 7). Wild type (WT) channel activation curve is shown as dashed line. B, representative IBa through double mutant S435A/I781T during depolarizing pulses from a holding potential of -100 mV (10-mV increments). C, mean time constants of channel activation for S435A/I781T double mutant (n = 6) and S435A (n = 6) and I781T (n = 7) mutants are plotted versus test potential. D, representative tail currents through mutant S435A/I781T. Currents were activated during a 20-ms conditioning depolarization to -10 mV. Deactivation was recorded during subsequent hyperpolarization (10-mV increment) starting from -100 mV. E, mean time constants of channel deactivation for S435A/I781T double mutant (n = 6) and S435A (n = 6) and I781T (n = 7) mutants are plotted versus test potential. Time constants were estimated by fitting current activation and deactivation to a mono-exponential function (see “Experimental Procedures”).
TABLE 2.
Double mutant cycle analysis of voltage-dependent gating Perturbation energies upon mutation (ΔG) for the mutant channels protein relative to wild-type channel and coupling free energies (ΔΔG) between pairs of residues are shown.
| Mutant | ΔG | ΔΔG |
|---|---|---|
| kcal/mol | kcal/mol | |
| IS6 segment | ||
| L429T | –0.37 ± 0.25 | |
| L434T | –0.95 ± 0.41 | |
| S435A | –0.43 ± 0.25 | |
| S435P | –1.48 ± 0.29 | |
| IIS6 segment | ||
| L779T | –0.79 ± 0.30 | |
| I781T | –2.18 ± 0.57 | |
| Double mutants | ||
| L429T/I781T | –2.22 ± 0.46 | 0.33 ± 0.78 |
| L429T/L779T | –1.15 ± 0.36 | 0.01 ± 0.54 |
| L434T/L779T | –1.77 ± 0.39 | –0.02 ± 0.64 |
| L434T/I781T | –4.61 ± 0.93 | –1.47 ± 1.17 |
| S435A/I781T | –1.48 ± 0.33 | 1.13 ± 0.70 |
| S435P/I781T | –1.92 ± 0.37 | 1.74 ± 0.74a |
Data are statistically significantly different from 0 (p < 0.05)
Correlation between Shifts of the Activation and Inactivation Curves—In line with our previous findings in IIS6, changes in the voltage dependences of channel activation and inactivation occurred in parallel. Larger shifts of the activation curves usually resulted in larger shifts of the midpoint of the inactivation curves. This is evident from Fig. 8 where the midpoint voltages of the activation curves are plotted versus the midpoint voltages of the inactivation curves. Fitting the data with a regression function revealed a correlation coefficient of 0.96 (p < 0.001, see Fig. 8).
DISCUSSION
Gating-related Residues in Segment IS6—In this study we have analyzed the interdependence of structural changes in pore-forming segments IS6 and IIS6 of CaV1.2 in activation (and inactivation) gating. The identification of residues with a strong impact on channel gating in segment IS6 was a prerequisite for our study. In continuation of our previous work (where substitutions by either proline or threonine had the strongest effects, see Ref. 12), we systematically replaced IS6 residues by proline and threonine. Proline scanning of segment IS6 resulted in only one functional mutant S435P, inducing a shift about -26-mV shift of the activation and inactivation curves (Fig. 1). Activation and deactivation of S435P barium currents were significantly slower than in wild type. These changes are analogous to previously described proline mutations between positions 779 and 781 (LAIA) of segment IIS6. Prolines could cause rigid kinks in helices that imitate one of the possible conformations of a natural “hinge.” It was therefore tempting to speculate that these conformational changes contribute to an apparent stabilization of the open and destabilization of the closed channel states (11, 12). It is also possible that proline mutations facilitate channel opening via destabilization of hydrogen bonding networks in the closed conformation, because the amide of proline cannot act as a hydrogen donor and thus disrupts the backbone hydrogen bond network that stabilizes the α-helix. This could decrease the energy required for the transition from the closed to the open channel conformation. α-Helix destabilization conferred by prolines has been suggested to be required for normal gating in some potassium channels (33, 34).
The failure of IS6 proline mutations to produce functional channels may be related to consequences of helix bending in segment IS6. Hence, confocal imaging analysis provided evidence for correct targeting of nonfunctional constructs (data not shown). Helix IS6 is unique, because it contains three glycines at position Gly-422, Gly-432, and Gly-436. In addition to its unique flexibility, glycine is also the smallest residue, enabling tight helix-helix packing. Helix-stabilizing alanine substitutions in this area (G432A and G436A) are functional (35). Therefore, proline mutations might disrupt packing, whereas alanine, which is the second smallest residue, is well tolerated.
A similar gating phenotype as observed for S435P was produced by threonine mutations (L429T and L434T) in the putative bundle crossing region of IS6 (Fig. 2, see Fig. 9 for putative location of these residues), which were later used to create paired mutations in IS6 and IIS6. These findings extend our previous study where we identified a cluster of residues in segment IIS6 as “gating-related region” (LAIA-motif, see Ref. 12). The deceleration of deactivation observed for S435P, L429T, and L434T (Figs. 1 and 2) is a strong indication for stabilization of the open channel conformation. The strong effect of S435P gives further evidence that a putative helix bending in the pore of CaV1.2 is likely to occur close to the inner channel mouth. The underlying molecular mechanism remains unclear, however.
Larger Shifts of Steady State Curves in Double Mutants L429T/I781T and L434T/I781T Correlate with Slower Activation and Deactivation at Hyperpolarized Voltages—Substitutions of Ile-781 in IIS6 by residues of different hydrophobicity, size, and polarity all shifted channel activation in the hyperpolarizing direction with I781P causing the most severe (-37 mV shift, see Ref. 12) and slowed activation and deactivation. Larger shifts of the activation curves were associated with stronger deceleration of current kinetics. Our new data from double mutants confirm and extend this finding. Construct L434T/I781T shifted the activation curves by approximately -40 mV and displayed the slowest activation time course (τm = 27 ms at -60 mV), whereas the activation curve of the faster activating L429T/I781T (τm = 17 ms at -60 mV) was shifted by approximately -34 mV (Fig. 3 and Fig. 4B). This trend was even more evident for the process of current deactivation, where the kinetics of the current decay was slowest for L434T/I781T > L429T/I781T > I781T > wild type (Figs. 3 and 5). Also the rate of inactivation for these mutations was slowed (Table 1). Similar shifts and deceleration of deactivation kinetics were observed in the bacterial sodium channel from B. halodurans when the conserved glycine in position 219 (corresponding to a putative hinge glycine in S6 of most K+ channels) was mutated to proline (15).
Additive Effects of Mutations in Segments IS6 and IIS6—Mutant cycle analysis was used to compute the interaction energy between sets of residues in segment IS6 and IIS6 on the basis of the free energy changes (32, 36–38). We analyzed IS6 and IIS6 mutations separately or together by calculating the free energies according to Equations 1, 2, 3, 4,
 |
(Eq. 1) |
 |
(Eq. 2) |
 |
(Eq. 3) |
and
 |
(Eq. 4) |
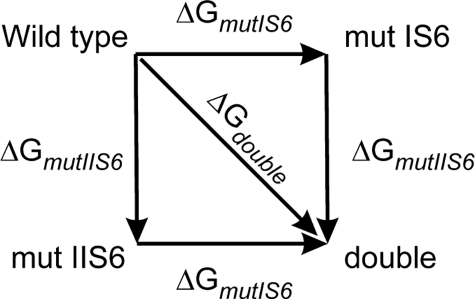
with V0.5 representing the voltage of half-activation and k the slope of the curve at V0.5 (see Table 1 and Fig. 3). If the gating-related residues in the two neighboring segments IS6 and IIS6 do not interact, then the change in free energy (ΔGdouble) of the double mutant is equal to the sum of the changes in free energy of the two single mutations (ΔGmut IS6 and ΔGmut IIS6; see Scheme 1). If these residues were energetically coupled, then the change in free energy for the double mutant would differ from the sum of the two single mutations.
SCHEME 1.
Our data show that mutations L429T and L434T in IS6 and L779T and I781T in segment IIS6 contribute independently to the opening of CaV1.2 with ΔΔG ≈0 kcal/mol (see Table 2). This is evident from mutant cycle analysis (see also Fig. 3 and Table 2). We therefore conclude that these individual conformational changes in segments IS6 and IIS6 are energetically independent.
Energetic Coupling between S435P in IS6 and I781T in IIS6—Mutation S435P in segment IS6 displayed the strongest impact on activation gating (Fig. 1). Our initial attempt to combine this mutation with I781P in segment IIS6 (inducing the largest shift of the activation curve, see Ref. 12) did not result in functional channel constructs. Therefore, we combined S435P with the somewhat milder gating perturbation caused by I781T. Both mutations induced comparable shifts of the activation curves ΔV0.5act.(S435P) ≈-26 mV, ΔV0.5act.(I781T) ≈ -28 mV).
The nonadditive shifts of the activation curves by double mutant S435P/I781T (ΔV0.5act.(S435P/I781T) ≈-33 mV, see Fig. 6A) strongly suggest interdependence of the gating perturbations in the two S6 segments. Mutant cycling analysis revealed a significant ΔΔG = 1.74 ± 0.74 kcal/mol (p < 0.05, see Table 2) suggesting energetic coupling. Interestingly, the kinetic phenotype of S435P/I781T resembles the activation and deactivation of the respective point mutants (Fig. 6, C and E). One possibility would be that these residues interact with each other, and replacement of either Ser-435 or Ile-781 (or both of them) disrupts their interaction and therefore causes similar gating changes. Substitution of Ser-435 by the helix-stabilizing alanine shifted the steady state activation curve by 6 mV to the left. This shift was small but statistically significant. Double mutation S435A/I781T induced nonadditive changes in the activation curves (Fig. 7, i.e. the difference between midpoints of curves for double mutant and for I781T was smaller than the shift observed for single mutant S435A). Mutant cycle analysis yielded, however, a ΔΔG ≈1.13 ± 0.70 kcal/mol that was statistically not significantly different from zero. Thus, compared with S435P/I781T where free-energy coupling was clearly evident from mutant cycling analysis, for S435A/I781T cooperativity is less likely (see Table 2). The locations of Ser-435 and Ile-781 in the homology model are illustrated in Fig. 9. A distance of 10.5 Å between the C-β atoms makes a direct interaction unlikely. Furthermore, residues Ser-435 and Ile-781 are both facing the opposite site of the pore. Cooperativity may, however, reflect long range coupling of residues (for review see Ref. 39). Stary et al. (40) suggested such an interaction between residues in neighboring IIS6 and IIIS6 segments of Cav1.2 based on MD simulations.
Pore facing residues Leu-434 and Leu-779, which are (according to the model) in close contact, are not energetically coupled (Table 2). The underlying mechanism and the contributions of different S6 segments to the stability of closed and/or open CaV1.2 conformations warrant further research.
The nucleotide sequence(s) reported in this paper has been submitted to the GenBank™/EBI Data Bank with accession number(s) X15539.
This work was supported by Austrian Science Fund 15914 (to S. H.).
Footnotes
The abbreviation used is: GFP, green fluorescent protein.
References
- 1.Catterall, W. A., Striessnig, J., Snutch, T. P., and Perez-Reyes, E. (2003) Pharmacol. Rev. 55 579-581 [DOI] [PubMed] [Google Scholar]
- 2.Catterall, W. A. (2000) Annu. Rev. Cell Dev. Biol. 16 521-555 [DOI] [PubMed] [Google Scholar]
- 3.Jiang, Y., Ruta, V., Chen, J., Lee, A., and MacKinnon, R. (2003) Nature 423 42-48 [DOI] [PubMed] [Google Scholar]
- 4.Zhou, Y., Morais-Cabral, J. H., Kaufman, A., and MacKinnon, R. (2001) Nature 414 43-48 [DOI] [PubMed] [Google Scholar]
- 5.Clayton, G. M., Altieri, S., Heginbotham, L., Unger, V. M., and Morais-Cabral, J. H. (2008) Proc. Natl. Acad. Sci. U. S. A. 105 1511-1515 [DOI] [PMC free article] [PubMed] [Google Scholar]
- 6.Long, S. B., Campbell, E. B., and MacKinnon, R. (2005) Science 309 897-903 [DOI] [PubMed] [Google Scholar]
- 7.Long, S. B., Tao, X., Campbell, E. B., and MacKinnon, R. (2007) Nature 450 376-382 [DOI] [PubMed] [Google Scholar]
- 8.Webster, S. M., Del Camino, D., Dekker, J. P., and Yellen, G. (2004) Nature 428 864-868 [DOI] [PubMed] [Google Scholar]
- 9.Jiang, Y., Lee, A., Chen, J., Cadene, M., Chait, B. T., and MacKinnon, R. (2002) Nature 417 515-522 [DOI] [PubMed] [Google Scholar]
- 10.Jiang, Y., Lee, A., Chen, J., Cadene, M., Chait, B. T., and MacKinnon, R. (2002) Nature 417 523-526 [DOI] [PubMed] [Google Scholar]
- 11.Hering, S., Beyl, S., Stary, A., Kudrnac, M., Hohaus, A., Guy, H. R., and Timin, E. (2008) Channels 2 61-69 [DOI] [PMC free article] [PubMed] [Google Scholar]
- 12.Hohaus, A., Beyl, S., Kudrnac, M., Berjukow, S., Timin, E. N., Marksteiner, R., Maw, M. A., and Hering, S. (2005) J. Biol. Chem. 280 38471-38477 [DOI] [PMC free article] [PubMed] [Google Scholar]
- 13.Zhen, X. G., Xie, C., Fitzmaurice, A., Schoonover, C. E., Orenstein, E. T., and Yang, J. (2005) J. Gen. Physiol. 126 193-204 [DOI] [PMC free article] [PubMed] [Google Scholar]
- 14.Beyl, S., Timin, E. N., Hohaus, A., Stary, A., Kudrnac, M., Guy, R. H., and Hering, S. (2007) J. Biol. Chem. 282 3864-3870 [DOI] [PMC free article] [PubMed] [Google Scholar]
- 15.Zhao, Y., Yarov-Yarovoy, V., Scheuer, T., and Catterall, W. A. (2004) Neuron 41 859-865 [DOI] [PubMed] [Google Scholar]
- 16.Cordes, F. S., Bright, J. N., and Sansom, M. S. (2002) J. Mol. Biol. 323 951-960 [DOI] [PubMed] [Google Scholar]
- 17.Grabner, M., Dirksen, R. T., and Beam, K. G. (1998) Proc. Natl. Acad. Sci. U. S. A. 95 1903-1908 [DOI] [PMC free article] [PubMed] [Google Scholar]
- 18.Horton, R. M., Hunt, H. D., Ho, S. N., Pullen, J. K., and Pease, L. R. (1989) Gene (Amst.) 77 61-68 [DOI] [PubMed] [Google Scholar]
- 19.Ruth, P., Rohrkasten, A., Biel, M., Bosse, E., Regulla, S., Meyer, H. E., Flockerzi, V., and Hofmann, F. (1989) Science 245 1115-1118 [DOI] [PubMed] [Google Scholar]
- 20.Ellis, S. B., Williams, M. E., Ways, N. R., Brenner, R., Sharp, A. H., Leung, A. T., Campbell, K. P., McKenna, E., Koch, W. J., Hui, A., Schwartz, A., and Harpold, M. M. (1988) Science 241 1661-1664 [DOI] [PubMed] [Google Scholar]
- 21.Hamill, O. P., Marty, A., Neher, E., Sakmann, B., and Sigworth, F. J. (1981) Pfluegers Arch. 391 85-100 [DOI] [PubMed] [Google Scholar]
- 22.Hemara-Wahanui, A., Berjukow, S., Hope, C. I., Dearden, P. K., Wu, S. B., Wilson-Wheeler, J., Sharp, D. M., Lundon-Treweek, P., Clover, G. M., Hoda, J. C., Striessnig, J., Marksteiner, R., Hering, S., and Maw, M. A. (2005) Proc. Natl. Acad. Sci. U. S. A. 102 7553-7558 [DOI] [PMC free article] [PubMed] [Google Scholar]
- 23.Sali, A., and Blundell, T. L. (1993) J. Mol. Biol. 234 779-815 [DOI] [PubMed] [Google Scholar]
- 24.Stary, A., Shafrir, Y., Hering, S., Wolschann, P., and Guy, H. R. (2008) Channels 2 210-215 [DOI] [PubMed] [Google Scholar]
- 25.Shafrir, Y., Durell, S. R., and Guy, H. R. (2008) Biophys. J. 95 3650-3662 [DOI] [PMC free article] [PubMed] [Google Scholar]
- 26.Huber, I., Wappl, E., Herzog, A., Mitterdorfer, J., Glossmann, H., Langer, T., and Striessnig, J. (2000) Biochem. J. 347 829-836 [PMC free article] [PubMed] [Google Scholar]
- 27.Zhorov, B. S., Folkman, E. V., and Ananthanarayanan, V. S. (2001) Biochem. Biophys. 393 22-41 [DOI] [PubMed] [Google Scholar]
- 28.Lipkind, G. M., and Fozzard, H. A. (2003) Mol. Pharmacol. 63 499-511 [DOI] [PubMed] [Google Scholar]
- 29.Dudley, S. C., Jr., Chang, N., Hall, J., Lipkind, G., Fozzard, H. A., and French, R. J. (2000) Gen. Physiol. 116 679-690 [DOI] [PMC free article] [PubMed] [Google Scholar]
- 30.Spaetgens, R. L., and Zamponi, G. W. (1999) J. Biol. Chem. 274 22428-22436 [DOI] [PubMed] [Google Scholar]
- 31.Stotz, S. C., and Zamponi, G. W. (2001) J. Biol. Chem. 276 33001-33010 [DOI] [PubMed] [Google Scholar]
- 32.Yifrach, O., and MacKinnon, R. (2002) Cell 111 231-239 [DOI] [PubMed] [Google Scholar]
- 33.Shrivastava, I. H., Capener, C. E., Forrest, L. R., and Sansom, M. S. (2000) Biophys. J. 78 79-92 [DOI] [PMC free article] [PubMed] [Google Scholar]
- 34.Labro, A. J., Raes, A. L., Bellens, I., Ottschytsch, N., and Snyders, D. J. (2003) J. Biol. Chem. 278 50724-50731 [DOI] [PubMed] [Google Scholar]
- 35.Raybaud, A., Dodier, Y., Bissonnette, P., Simoes, M., Bichet, D. G., Sauvé, R., and Parent, L. (2006) J. Biol. Chem. 281 39424-39436 [DOI] [PubMed] [Google Scholar]
- 36.Hidalgo, P., and MacKinnon, R. (1995) Science 268 307-310 [DOI] [PubMed] [Google Scholar]
- 37.Ranganathan, R., Lewis, J. H., and MacKinnon, R. (1996) Neuron 16 131-139 [DOI] [PubMed] [Google Scholar]
- 38.Zandany, N., Ovadia, M., Orr, I., and Yifrach, O. (2008) Proc. Natl. Acad. Sci. U. S. A. 105 11697-11702 [DOI] [PMC free article] [PubMed] [Google Scholar]
- 39.Horovitz, A. (1996) Folding Des. 1 R121-R126 [DOI] [PubMed] [Google Scholar]
- 40.Stary, A., Kudrnac, M., Beyl, S., Hohaus, A., Timin, E. N., Wolschann, P., Guy, R. H., and Hering, S. (2008) Channels 2 216-223 [DOI] [PMC free article] [PubMed] [Google Scholar]


