

Abstract
Extracellular UDP-sugars promote cellular responses by interacting with widely distributed P2Y14 receptors, but the mechanisms by which these molecules are released from cells are poorly understood. Given the active role of UDP-sugars in glycosylation reactions within the secretory pathway, we hypothesized that UDP-sugar release includes an exocytotic component. This hypothesis was tested by assessing the contribution of endoplasmic reticulum (ER)/Golgi-resident UDP-GlcNAc transporters to the cellular release of their cognate substrates. A sensitive and highly selective assay for UDP-GlcNAc mass was developed using purified AGX2, an isoenzyme of human UDP-GlcNAc pyrophosphorylase. Robust constitutive release of UDP-GlcNAc was observed in yeast as well as in well differentiated human airway epithelial cells. The human UDP-GlcNAc transporter HFRC1 was overexpressed in human bronchial epithelial cells and was shown to localize in the Golgi and to enhance the surface expression of N-acetylglucosamine-rich glycans. HFRC1-overexpressing cells also displayed increased constitutive and hypotonic stress-stimulated release of UDP-GlcNAc. Yeast mutants lacking Yea4 (the ER UDP-GlcNAc transporter endogenously expressed in Saccharomyces cerevisiae) showed reduced UDP-GlcNAc release. Yea4-deficient cells complemented with Yea4 showed UDP-GlcNAc release rates at levels similar to or higher than wild type cells. Our results illustrate that ER/Golgi lumen constitutes a significant source of extracellular UDP-sugars and therefore plays a critical role in nucleotide sugar-promoted cell signaling.
Extracellular nucleotides perform important signaling functions via activation of broadly distributed P2X and P2Y purinergic receptors (1, 2). P2X receptors comprise seven species (P2X1-P2X7) of ATP-gated ion channels. P2Y receptors belong to the superfamily of G protein-coupled receptors. At least eight human P2Y receptor species have been identified, seven of which (P2Y1, P2Y2, P2Y4, P2Y6, P2Y11, P2Y12, and P2Y13) are activated by adenine and/or uridine nucleoside di- and triphosphates (2). The P2Y14 receptor was identified as the eighth member of the P2Y family (3, 4). Unlike other P2 receptors, the human P2Y14 receptor is activated by UDP-Glc, UDP-GlcNAc, and other UDP-sugars but not by di- or triphosphonucleotides (3).
P2Y14 receptor transcripts are expressed in several human tissues, including placenta, stomach, intestine, adipose, brain, lung, spleen, heart, and circulating leukocytes (3, 5-7). UDP-sugar-promoted signaling has been reported in astrocytes and microglial cells (8, 9), lung epithelial cells (10), bone marrow hematopoietic stem cells (11), and multiple types of peripheral immune cells, including neutrophils, lymphocytes, and dendritic cells (6, 7, 12, 13). These observations suggest that UDP-sugars, high energy donor substrates in biosynthetic reactions, potentially are released from cells in a regulated fashion to perform autocrine/paracrine signaling. Indeed, nonlytic release of UDP-Glc has been recently reported in several cell types (14-16). However, the mechanisms involved in the cellular release of UDP-sugars are not well defined.
Nucleotide and nucleotide sugar release is postulated to occur via two possible scenarios: (i) exocytotic release from vesicles and (ii) cytosolic release through plasma membrane channels or transporters (17, 18). Ca2+-regulated exocytosis of ATP-rich secretory granules has been documented with nerve terminals, chromaffin cells, pancreatic acinar cells, and other excitatory/secretory tissues (18). Circumstantial evidence supports the involvement of the secretory pathway in the release of nucleotides and UDP-sugars from nonexcitatory cells (e.g. epithelial, endothelial, and astrocytoma cells). For example, nucleotide release was associated with vesicle exocytosis and/or was impaired in cells treated with Golgi-disrupting agents or by conditions resulting in impaired vesicle trafficking/fusion (15, 16, 19-23). However, unambiguous proof of vesicular nucleotide release from nonexcitatory cells (as opposed to vesicular insertion of a nucleotide channel into the plasma membrane) is lacking. A major limitation in assessing the contribution of vesicular nucleotides to nucleotide release is the scarcity of reagents to selectively manipulate nucleotide levels in the lumen of the secretory pathway of nonexcitatory/nonsecretory cells.
UDP-sugars are synthesized in the cytosol and transported into the lumen of the endoplasmic reticulum (ER)2 and Golgi apparatus to serve as sugar donors for glycosyltransferase-catalyzed reactions. ER/Golgi-resident nucleotide sugar transporters translocate cytosolic UDP-sugars to these organelles, using luminal UMP as an antiporter substrate (24, 25). ATP is also translocated to the ER and Golgi, via ATP/AMP antiporters, where it serves as an energy source for protein folding reactions (25, 26). Nucleotides imported to the ER/Golgi reach concentrations up to 20-fold higher than cytosolic levels (25). Since ER/Golgi nucleotides and nucleotide sugars do not diffuse back to the cytosol, they can potentially be delivered as cargo molecules and released from cells (e.g. during export of glycoconjugates). Thus, by regulating the entry of nucleotides to the ER/Golgi, nucleotide transporters may contribute to the cellular release of their cognate substrates.
The molecular identities of the putative Golgi ATP/AMP and UDP-Glc/UMP antiporters (27, 28) are not known (24). However, Golgi UDP-GlcNAc/UMP and other UDP-sugar/UMP antiporters (currently designed as SLC35 nucleotide sugar transporters) have been identified at the molecular level in several species. In humans, three gene products, SLC35A3, SLC35B4, and SLC35D2, have been characterized as Golgi-resident UDP-sugar/UMP translocators with relatively high selectivity toward UDP-GlcNAc (24, 29, 30). SLC35D2, also known as HFRC1, is the human homologue to the fruit fly fringe connection (Frc) transporter and may facilitate transport of UDP-Glc into the Golgi in addition to UDP-GlcNAc (29). A bona fide, highly selective UDP-GlcNAc/UMP antiporter named Yea4, which is distantly related to SLC35B4, is expressed in Saccharomyces cerevisiae ER. The present study examines the contribution of UDP-GlcNAc transporters to the cellular release of their UDP-sugar substrates. We have amplified cDNA encoding AGX2 (an isoform of UDP-GlcNAc pyrophosphorylase) and used this enzyme to develop an assay that quantifies UDP-GlcNAc with nanomolar sensitivity. By manipulating the expression of HFRC1 and Yea4, we tested the hypothesis that UDP-sugar release encompasses a vesicular component.
EXPERIMENTAL PROCEDURES
AGX2 Expression and Purification—The coding sequence of UDP-GlcNAc pyrophosphorylase (AGX2; GenBank™ accession number AB011004) was amplified from human testis cDNA with up and down primers harboring BamHI and HindIII restriction sites, respectively, at their 5′-ends. The PCR product was digested with BamHI and HindIII and ligated into similarly digested pMal-C2KV, thus introducing a His6-tagged maltose-binding protein and a tobacco etch virus cleavage site at the N terminus of AGX2. pMal-C2KV/AGX2 was transformed into BL21 Escherichia coli (Invitrogen), and the His6-tagged maltose-binding protein-AGX2 fusion protein was induced overnight at 22 °C with 0.3 mm isopropyl-β-d-thiogalactopyranoside. The fusion protein was purified from culture supernatants over a Ni2+-chelating column, dialyzed to remove imidazole, and cleaved from His6-tagged maltose-binding protein by overnight digestion with tobacco etch virus protease. AGX2 was purified from the digest by passing the mixture over the Ni2+-chelating column a second time to remove undigested fusion protein and His6-tagged maltose-binding protein, as previously described (31). AGX2-eluting fractions were pooled, concentrated to 1.5 mg/ml, and stored at -80 °C.
Titration of UDP-GlcNAc Pyrophosphorylase—UDP-Glc-NAc pyrophosphorylase activity was assessed in a reaction mix (100 μl) containing 25 mm HEPES (pH 7.4), 1.2 mm MgCl2, and, unless indicated otherwise, 1 mm PPi and 2 mm UDP-GlcNAc. Conversion of UDP-GlcNAc to UTP was monitored by HPLC. Incubations were allowed to proceed for various times at 37 °C and terminated by heating the samples for 2 min at 95 °C. One enzyme unit was defined as the amount of AGX2 catalyzing the formation of 1 μmol of UTP/min at 37 °C. The Michaelis constants were determined using 0.1 unit/ml AGX2. The data were fitted with a nonlinear least squares equation, using SigmaPlot version 10. Vmax and Km values represent the mean of at least two independent measurements, which varied by <10% from each other.
To assess the efficiency of AGX2 in catalyzing the conversion of UDP-GlcNAc to UTP under low substrate concentrations (i.e. [S] ≪ Km), incubations were carried out in 100 μl of HEPES-buffered (pH 7.4) minimum essential medium (H-MEM) containing 0.3 units/ml AGX2, 100 nm PPi, and 4-40 nm UDP-GlcNAc. UDP-[3H]GlcNAc (0.05 μCi) was used as a radiotracer, and the conversion of UDP-[3H]GlcNAc to N-[3H]acetylglucosamine-1P ([3H]GlcNAc-1P) was monitored by HPLC, as detailed below.
Quantification of UDP-GlcNAc in Extracellular Solutions—The UDP-GlcNAc-dependent conversion of [32P]PPi to [32P]UTP was assessed in 100 μl of HEPES-buffered (pH 7.4) samples containing 0.3 units/ml UDP-GlcNAc pyrophosphorylase and 100-200 nm [32P]PPi (100,000 cpm). After incubating at 37 °C for 1 h, nonradiolabeled 1 mm PPi was added to samples, followed by immediate heating at 95 °C for 2 min. Conversion of [32P]PPi to [32P]UTP was monitored by HPLC. A calibration curve, using known concentrations of UDP-Glc-NAc, was performed in parallel to calculate the mass of UDP-GlcNAc present in test samples.
Preparation of [32P]Pyrophosphate—To obtain high specific activity [32P]PPi, [γ-32P]ATP (100 μCi, specific activity >3000 Ci/mmol) was incubated with 0.5 units/ml nucleotide pyrophosphatase from Crotalus adamanteus (Sigma) at 37 °C for 30 min, as described previously (14). Freshly prepared [32P]PPi was stored at -20 °C and used within 2 weeks. Commercially available, low specific activity [32P]PPi (60 Ci/mmol) was purchased from PerkinElmer Life Sciences.
Cell Culture and Incubations—Polarized cultures of well differentiated primary human bronchial epithelial (HBE) and nasal epithelial cells and immortalized 16HBE14o- and Calu-3 human airway epithelial cells were grown on 12-mm Transwell supports (Costar) and maintained at an air-liquid interface that mimics the in vivo environment of the airway epithelia, as previously described (32). Cultures were rinsed three times and preincubated for 1 h in minimal essential medium (300 μl mucosal, 500 μl basolateral) at 37 °C in a humidified incubator supplemented with 5% CO2. After the addition of desiderated reagents, aliquots (200 μl) were removed at the times indicated, heated at 95 °C for 2 min, and either used immediately or stored at -20 °C. For intracellular measurements, cultures were lysed with 5% trichloroacetic acid, which was subsequently extracted with ethylic ether, as described (32).
Bronchoalveolar Lavage Fluid (BALF)—BALF was obtained from cystic fibrosis and control disease (non-cystic fibrosis) patients via clinically indicated bronchoscopy, as previously described (33).
Protein Assay—Protein concentration was determined by the BCA protein assay kit (Pierce), according to the manufacturer's instructions.
Metabolism of Extracellular UDP-GlcNAc—Cells were rinsed twice and incubated in 300 μl of H-MEM in the presence of trace amounts of UDP-[3H]GlcNAc. Medium samples were collected at the indicated times, and 3H-labeled species were separated and analyzed by HPLC.
HPLC Analysis—[32P]UTP and [32P]PPi were separated by HPLC (Shimatzu) using 3.9 × 150 mm (Nova-Pack C18 column) with an ion pairing mobile phase (1 ml/min) consisting of 8 mm tetrabutylammonium hydrogen sulfate, 60 mm KH2PO4, pH 5.3, and 7.5% methanol. UDP-[3H]GlcNAc and [3H]Glc-NAc-1P [3H]GlcNAc were resolved from each other using a slightly modified mobile phase, consisting of 8 mm tetrabutylammonium hydrogen sulfate, 30 mm KH2PO4, pH 5.3, and 3% methanol. The HPLC apparatus was equipped with a Radiometer Flow-One® Beta detector (Packard) and a SPD-10A UV detector (Shimatzu), and radioactivity and absorbance at λ = 260 nm were monitored on-line, as previously described (14).
Liquid Chromatography-Tandem Mass Spectrometry—Liquid chromatography-tandem mass spectrometry analysis was performed at the UNC Mass Spectrometry core facility. Briefly, samples (10 μl) were injected onto a C18 HPLC column (Acquity T3-HSS) and separated using a gradient developing from 5 to 95% methanol in 0.1% acetic acid. The UDP-N-acetylhexosamine signal was assessed using selected reaction monitoring of the transition from m/z 606 to 385 in tandem mass spectrometry, as described (34).
HFRC1 Overexpression—HA-tagged HFRC1 cDNA (GenBank™ accession number XM_047286 (29)) was subcloned into the puromycin-encoding retroviral vector pQCXIP (Clontech). Retroviruses carrying HA-tagged HFRC1 or viruses produced from pQCXIP without gene insert (“mock” viruses) were added to cells and incubated with Polybrene (8 μg/ml) for 2 h at 37 °C (35). Cells were rinsed and subsequently selected with puromycin (0.5 μg/ml) for 1 week.
Immunofluorescence and Confocal Microscopy Studies—Vector- and HA-tagged HFRC1-transformed cells were detached by a brief incubation in Varsene (Invitrogen) and centrifuged onto glass slides using a StatSpin Cytofuge® (Iris Sample Processing, Westwood, MA). Localization of HFRC1 was revealed by immunofluorescence, using either an anti-HA monoclonal (36) or an anti-HA polyclonal antibody. Elements of the cis- and trans-Golgi were revealed with monoclonal antibodies against GM-130 and p-230, respectively (BD Biosciences, San Jose, CA). Heparan sulfate was detected with an antibody against perlecan (Neomarkers, Fremont, CA). Polarized cultures of 16HBE14o- cells were stained with FITC-labeled wheat germ agglutinin, as described previously (31). Immunostaining and confocal microscopy analysis were performed as previously described (15), using a Leica Sp5 confocal microscopy. Images were processed and quantified using Adobe Photoshop CS.
Reverse Transcription-PCR Analysis of SLC35 Transporter Expression—Total RNA was isolated from freshly cultured cells using the RNeasy kit (Qiagen Inc., Valencia, CA) and reverse transcribed into cDNA using Superscript (Invitrogen). PCR was performed using standard procedures and Amplitaq Gold (Applied Biosystems, Foster City, CA). Primers used to amplify HFRC1/SLC35D2, SLC35A3, and SLC35B4 were 5′-TCCTCATCGTGCTTGTCAAC-3′ and 5′-GGAGAGGCAGAGGAAAC-3′; 5′-CCCTGGGAATTTTGGTCTTTC-3′ and 5′-GATCCCTGATGGAATAGCAAG-3′; and 5′-TTACTCTGTGCGCTTGCTTC-3′ and 5′-cagggcatagttgttcaccac-3′, respectively.
Quantitative PCR for the target genes was performed using a Lightcycler PCR apparatus and a Lightcycler Fast start DNA master SYBR Green I kit (Roche Applied Science). Quantitative PCR was performed using a Lightcycler PCR machine and a Lightcycler Fast start DNA master SYBR Green I kit from Roche Applied Science. The average cross-over point was determined using the Roche software. The relative expression levels of the SLC35D2, SLC35A3, and SLC35B4 were calculated from the efficiency of the PCR and the crossing point and normalized to the expression of the reference gene 18 S, as previously described (37).
Nucleotide Release from S. cerevisiae—Wild type (WT) BY4741 (MATa his3Δ leu2Δ met15Δ ura3Δ) and Yea4-deficient Yel004W BY4741 (MATa his3Δ leu2Δ met15Δ ura3Δ yel004w::KanMX4) strains were grown overnight in yeast peptone dextrose (YPD) medium. Cells were centrifuged (13,000 rpm, 5 min) and resuspended in 20 mm Tris, 1 mm KH2PO4/K2HPO4-buffered solution (pH 7.6), containing 1% (w/v) glucose (TK buffer). Cells were preincubated for 1 h at 30 °C while shaking, centrifuged, resuspended in TK at a density of 108 cells/ml, and incubated at 30 °C for the indicated times under continuous shaking. Cells were centrifuged, and supernatants were collected and stored on ice. Samples were boiled for 2 min, transferred to ice, and stored at -20 °C. For intracellular measurements, cells were resuspended in 100 μl of TK and lysed with 5% trichloroacetic acid, as described above. Samples were supplemented with 1.6 mm CaCl2 and 2 mm MgCl2 prior to nucleotide analysis.
Amplification and Expression of S. cerevisiae Yea4—The yea4 gene, including the promoter, open reading frame (GenBank™ accession number U18530), and polyadenylation site, was amplified by PCR. The oligonucleotide primers were 5′-GCGGCCGCAACTTCATAGATGGACAG-3′ and 5′-GCGGCCGCAAACTTACGTCAACACCAC-3′ (the underlines indicate the NotI sites). PCR was carried out on S. cerevisiae genomic DNA using Phusion Hot Start DNA polymerase. The reaction was performed with an initial hot start cycle of 98 °C for 2 min; 35 cycles of 98 °C for 10 s, 58 °C for 15 s, and 72 °C for 45 s; and a final cycle of 72 °C for 7 min. The PCR product was subcloned into pCR-BluntII-TOPO (Invitrogen), and its nucleotide composition was verified by DNA sequencing. The yea4 fragment was inserted into a pYC240 plasmid (kindly provided by Dr. Kjeld Olesen, Carlsberg Research Laboratory, Copenhagen-Valby, Denmark). S. cerevisiae Yel004W BY4741 was transformed with pYC240-yea4 plasmid according to Gietz et al. (38).
Chitin Staining—Preparation of cells for chitin staining using Calcofluor White Stain (Fluka) was performed, following the manufacturer's instructions. Briefly, cells were grown overnight in YPD (in the presence of 300 μm hygromycin B for pYC240-transfected cells) and washed twice in TK. Cells were resuspended in TK at a density of 1 × 10⁸ cells/ml. Fifty microliters of the cell suspension were mixed with 20 μl of Calcofluor White Stain and transferred onto a glass coverslip. The cells were examined under a mercury lamp using a UV filter in a Leica DMIRB microscope with a ×40 PlanApo lens (Leica, Germany). Images were collected with a CCD camera and processed as above.
Measurements of UDP-glucose and ATP—The mass of UDP-Glc was assessed as previously described (14), and ATP was quantified using the off-line luciferin-luciferase assay, as described previously (39).
Reagents—[γ-32P]ATP was obtained from Amersham Biosciences. UDP-d-[6-3H]-N-acetylglucosamine (38.3 Ci/mmol), UDP-glucose pyrophophosphorylase, luciferase, brefeldin A (BFA), and anti-HA-polyclonal antibody were purchased from Sigma. Luciferin was obtained from BD PharMingen (Franklin Lakes, NJ). All other chemicals were of the highest purity available. Anti-HA monoclonal antibody was obtained from Covance (Princeton, NJ).
Data Analysis—The rate of UDP-GlcNAc hydrolysis (Vh) was calculated according to Vh = kS, where S represents the mass of extracellular UDP-GlcNAc at steady state, and k is the first order rate constant (k = 0.693/t½) of UDP-[3H]GlcNAc decay. Flow-One Analysis software (Packard Instruments Co.) was used for analyzing the HPLC tracings. Differences between means were determined by paired Student's t test and were considered significant at p < 0.05.
RESULTS
Quantification of UDP-GlcNAc Using Recombinant UDP-GlcNAc Pyrophophorylase—UDP-GlcNAc pyrophosphorylase catalyzes the reversible pyrophosphorolysis of UDP-GlcNAc, according to the following reaction.
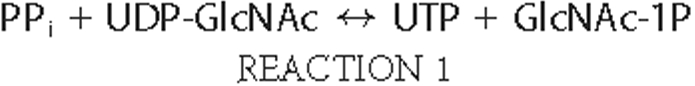
Two UDP-N-acetylhexosamine pyrophosphorylase isoforms, AGX1 and AGX2, have been identified at the molecular level. Although AGX1 displays higher activity toward UDP-GalNAc (40), AGX2 exhibits nearly 10-fold higher affinity for UDP-GlcNAc relative to UDP-GalNAc (40, 41). Therefore, we chose to use AGX2 to develop an assay for the potential quantification of UDP-GlcNAc. The coding sequence of AGX2 was amplified by PCR from human testis cDNA, cloned, and expressed in E. coli, and the expressed protein was purified to near homogeneity. As illustrated in Fig. 1A, AGX2 was resolved as a single band migrating at ∼57 kDa on SDS-PAGE. Purified AGX2 exhibited a specific activity of 66 units/mg protein. Consistent with previous studies (41), AGX2 displayed a Km of 33 ± 2 μm for UDP-GlcNAc (Fig. 1B). AGX2 also displayed a Km of 45 ± 3 μm for PPi (Fig. 1C), a value that had not been previously defined.
FIGURE 1.

Purification and characterization of UDP-GlcNAc pyrophosphorylase. A, purified AGX2 (1.5 μg) was subjected to SDS-PAGE on a 10% (w/v) acrylamide gel, as described under “Experimental Procedures.” Molecular masses (in kDa) are indicated on the left. B and C, the UDP-GlcNAc and PPi dependence of the AGX2-catalyzed synthesis of UTP was assessed in the presence of 0.1 unit/ml AGX2 and either 1 mm PPi (B) or 2 mm UDP-GlcNAc (C). The data represent the mean value ± S.D. of two independent experiments (n = 4).
Our goal was to use AGX2 to quantify UDP-GlcNAc in extracellular solutions. Based on previous measurements of extracellular nucleotides, our assumption was that UDP-GlcNAc concentrations in bulk extracellular solutions bathing cell cultures should be within the low nanomolar range (18). Therefore, an initial evaluation of the efficiency of AGX2 in catalyzing the pyrophosphorolysis of 10 nm UDP-GlcNAc was assessed. Conversion of 10 nm UDP-[3H]GlcNAc (0.05 μCi) to [3H]GlcNAc-1P was completed within 45 min in the presence of 0.3 units/ml AGX2 and 100 nm PPi (Fig. 2A), and identical results were obtained using 4, 15, 20, and 30 nm UDP-GlcNAc (not shown). Using [32P]PPi as a radiotracer, the sensitivity, selectivity, and linearity of AGX2-catalyzed conversion of UDP-GlcNAc to [32P]UTP were determined. Representative HPLC tracings of the conversion of 100 nm [32P]PPi to [32P]UTP in the absence or presence of 10 nm UDP-GlcNAc are shown in Fig. 2B. Formation of [32P]UTP was readily observed with UDP-GlcNAc concentrations as low as 2 nm, and the reaction was linear up to 30 nm UDP-GlcNAc (Fig. 2C). The sensitivity of the reaction could be further increased (to <1 nm) by decreasing the mass of the radiotracer (e.g. 30 nm [32P]PPi), and linearity was extended to 100 nm UDP-GlcNAc by increasing PPi concentration to 200 nm (not shown).
FIGURE 2.

Specificity and sensibility of the AGX2-catalyzed reaction. A and B, HPLC tracings illustrating the AGX2-catalyzed conversion of 10 nm UDP-[3H]GlcNAc to [3H]GlcNAc-1P in the presence of 100 nm PPi (A) and of 100 nm [32P]PPi to [32P]UTP in the absence or presence of 30 nm UDP-GlcNAc (B). C, UDP-GlcNAc calibration curve obtained in the presence of 100 nm [32P]PPi. D, the conversion of [32P]PPi to [32P]UTP was measured in the presence of the indicated concentration of UDP-GlcNAc, UDP-GalNAc, UDP-Glc, UDP-Gal, or UDP-GlcA. All incubations were in the presence of 0.3 units/ml AGX2. The data represent the mean value ± S.D. of four independent experiments performed in triplicate (A-C) and two independent experiments performed with triplicate samples (D).
An important control for the quantification of UDP-GlcNAc in biological samples is to assess the potential interference of UDP-GalNAc and other naturally occurring nucleotides. The AGX2-catalyzed conversion of [32P]PPi to [32P]UTP was highly selective for UDP-GlcNAc, since negligible formation of [32P]UTP was observed when UDP-GlcNAc was replaced with UDP-GalNAc (i.e. at concentrations of ≤30 nm, the signal generated by UDP-GalNAc was indistinguishable from noise (Fig. 2D); 100 nm UDP-GalNAc was needed to generate a [32P]UTP signal equivalent to that observed with 2 nm UDP-GlcNAc (Fig. 2D)). Thus, although AGX2 has been reported to display some reactivity toward UDP-GalNAc (40, 41), our AGX2-based assay (i.e. at 1-100 nm UDP-N-acetylhexosamine and 100 nm PPi) is nearly 50-fold more selective for UDP-GlcNAc than for UDP-GalNAc. In addition, at 100 nm concentration,, UDP-GlcA, and UDP-Glc as well as ATP, ADP, AMP, UTP, UDP, UMP, GTP, GDP, or GMP were not substrates of AGX2 (Fig. 2D) (data not shown). Given that the pyrophosphorolysis reaction displays an equilibrium constant of 5 ± 1.6 (42), our assay conditions ensured that the direction of the reaction would be highly favorable toward [32P]UTP synthesis. Indeed, the reaction product UTP, at concentrations in the range observed in extracellular solutions (43), had no significant effect on the UDP-GlcNAc-dependent conversion of [32P]PPi to [32P]UTP (data not shown). Moreover, the reaction was not affected by the presence of 100 nm UDP-GalNAc, UDP-Glc, UDP-Gal, UDP-GlcA, ATP, ADP, or UDP (data not shown). In sum, using purified AGX2, we have developed a sensitive and highly selective assay for the quantification of UDP-GlcNAc in biological samples.
Cellular Release of UDP-GlcNAc—The extent to which UDP-GlcNAc accumulates in airway surface liquid both in vitro and in vivo was examined using cultures of polarized airway epithelial cells as well as BALFs from lung disease patients. UDP-GlcNAc levels in the mucosal solutions bathing primary and immortalized cultures of airway epithelial cells were in the 2-10 nm range and were similar to UDP-Glc levels (Table 1). The relative abundance of extracellular UDP-GlcNAc and UDP-Glc in airway surface liquid from cultured cells did not strictly correlate with the relative cellular content of these molecules (Table 1), suggesting differences in rates of release and/or extracellular metabolism between the two UDP-sugars. UDP-GlcNAc and UDP-Glc levels in BALF were remarkably high (∼300 nm) compared with those detected in culture cells (Table 1).
TABLE 1.
Airway surface liquid levels of UDP-sugars
UDP-GlcNAc and UDP-Glc were determined in the mucosal medium (300 μl) bathing resting confluent cultures of human airway epithelial cells and in human BALF obtained by clinically indicated bronchoscopy. The data represent the mean ± S.D. (culture cells) or mean ± S.E. (BALF); the number of samples is indicated in parenthesis. ND, not determined. ASL, airway surface liquid; TCA, trichloroacetic acid.
|
UDP-GlcNAc
|
UDP-Glc
|
|||
|---|---|---|---|---|
| ASL | TCA | ASL | TCA | |
| nm | pmol/well | nm | pmol/well | |
| Normal primary HBE (10) | 5.2 ± 0.1 | 2150 ± 150 | 5.6 ± 0.2 | 402 ± 25 |
| Normal primary HNE (3) | 1.7 ± 0.5 | ND | ND | ND |
| CF primary HNE (5) | 8.6 ± 3.8 | ND | ND | ND |
| 16HBE14o− (10) | 5.4 ± 0.2 | 1750 ± 300 | 3.8 ± 0.1 | 1850 ± 450 |
| Calu-3 (10) | 8.2 ± 0.9 | 2050 ± 50 | 6.0 ± 0.8 | 550 ± 40 |
| BALF (9) | 342 ± 129 | 281 ± 103 | ||
Extracellular nucleotide levels reflect a steady state in which nucleotide hydrolysis by ectoenzymes is balanced by cellular nucleotide release. Therefore, we asked whether extracellular UDP-GlcNAc accumulation on resting cells reflected a cellular process of basal (i.e. constitutive) release (we use the term “constitutive” to refer to a release process that occurs in nonstimulated cells) and metabolism. UDP-[3H]GlcNAc added to the mucosal surface of polarized 16HBE14o- cell monolayers decayed with a t½ of 12 min (Fig. 3A), whereas UDP-GlcNAc mass on these cells remained constant (5 ± 0.5 nm) for up to 120 min (Fig. 3B) (data not shown). Thus, the rate of hydrolysis (Vh) of UDP-GlcNAc was calculated as Vh = 86 fmol/min (Fig. 3A).
FIGURE 3.

Metabolism and cellular release of UDP-GlcNAc. A, UDP-[3H]GlcNAc (5 nm) was added for the indicated times to the mucosal compartment of polarized 16HBE14o- cells in the presence or absence of 300 μm β,γ-metATP. The resulting species were separated and quantified by HPLC, as indicated under “Experimental Procedures.” B, UDP-GlcNAc released to the extracellular medium was measured in the presence or absence of 300 μm β,γ-metATP. The data represent the mean value ± S.D. of two independent experiments performed in triplicate. C, cells were incubated for 1 h with vehicle or 3 μm BFA, and Golgi structures were revealed with monoclonal anti-Golgi p230 antibody, followed by FITC-labeled secondary antibody. Nuclei were stained with propidium iodide. Each panel is the overlay of the FITC (green) and nuclei (red) images acquired in face by confocal microscopy. Bar, 20 μm. D, UDP-GlcNAc measurements were performed in cells preincubated for 60 min in the presence of vehicle or 3 μm BFA. At the end of this period, 300 μm βγ-metATP was added to cells for an additional 30 min. The data represent the mean ± S.D. from at least two experiments performed in quadruplicates.
The product of UDP-[3H]GlcNAc hydrolysis on 16HBE14o- cells co-eluted with an authentic standard of [3H]GlcNAc-1P, consistent with an ectonucleotide pyrophosphatase-catalyzed reaction (i.e. UDP-sugar → UMP + sugar-1P) (14-16). We have previously illustrated that the ectonucleotide pyrophosphatase inhibitor β,γ-metATP (44) markedly inhibited UDP-Glc hydrolysis on 1321N1 human astrocytoma cells (16). Consistent with its ectonucleotide pyrophosphatase-inhibitory effect, 300 μm β,γ-metATP nearly abolished (>98% inhibition) UDP-[3H]GlcNAc hydrolysis on 16HBE14o- cells (Fig. 3A). Predictably, extracellular UDP-GlcNAc concentrations on resting 16HBE14o- cells increased 3-fold (from 5 ± 0.5 to 18 ± 2 nm) after a 60-min incubation following the addition of 300 μm β,γ-metATP (Fig. 3B). Control experiments indicated that β,γ-MetATP does not interfere with the UDP-GlcNAc assay (data not shown). Thus, increased UDP-GlcNAc accumulation in the presence of β,γ-metATP reflected tonic release of the nucleotide sugar (i.e. constitutive release). As expected, the experimentally observed rate of UDP-GlcNAc release (65 fmol/min; Fig. 3B) approached the above calculated rate of UDP-GlcNAc hydrolysis (Vh) at steady-state (Fig. 3A). Unlike mucosal release, release of UDP-GlcNAc to the basolateral solution of 16HBE14o- was minor (i.e. basolateral UDP-GlcNAc levels remained ≤1.0 nm after 60 min of β,γ-metATP addition). This observation is in agreement with previous studies indicating that polarized airway epithelial cells release nucleotides predominantly to the mucosal compartment (15, 32).
As mentioned above (see Fig. 2D), the possibility that UDP-GalNAc has contributed to the signal in our AGX2-based assay was unlikely. Moreover, to unambiguously rule out that 16HBE14o- samples contained UDP-GalNAc at concentrations sufficient to affect the AGX2-based assay, liquid chromatography-tandem mass spectrometry analysis was performed. It is worth nothing that although liquid chromatography-tandem mass spectrometry quantifies UDP-N-acetylhexosamines with ∼1 nm sensitivity, this approach cannot separate UDP-GlcNAc from UDP-GalNAc (45, 46). Nevertheless, the results, illustrated in supplemental Fig. 1, indicated that the total content of UDP-N-acetylhexosamine in these samples was 5-15 nm. Therefore, 16HBE14o- samples could not contain UDP-GalNAc in concentrations high enough to generate a signal detectable by the AGX2-based assay.
Since UDP-sugars are actively transported to the lumen of the ER/Golgi to serve in glycosylation reactions, an attractive hypothesis is that cellular release of these molecules is associated with the trafficking of vesicles from the Golgi to the cell surface (14, 18). The fungal metabolite BFA disrupts retrograde movements along the secretory pathway, disassembling the Golgi network (47, 48). Fig. 3C illustrates that incubation of 16HBE14o- cells with BFA (3 μm, 90 min) provoked profound changes in Golgi morphology, as illustrated by the striking decrease in fluorescence attained with the Golgi marker p230. BFA significantly (although not completely) reduced UDP-GlcNAc release from resting 16HBE14o- cells (Fig. 3D). The BFA-sensitive component of UDP-GlcNAc release could reflect either release of the UDP-sugar from Golgi-derived vesicles or vesicular insertion of a UDP-GlcNAc channel or transporter to the plasma membrane. In addition, BFA-insensitive UDP-sugar release may have occurred through COP1-independent vesicle trafficking/exocytosis or via a plasma membrane-resident conductance.
Overexpression of Golgi UDP-GlcNAc Transporter HFRC1—To more conclusively assess the contribution of Golgi UDP-GlcNAc to UDP-GlcNAc release, an alternative experimental strategy was implemented (i.e. manipulating the entry of UDP-GlcNAc to the Golgi lumen). HFRC1, a Golgi-resident UDP-GlcNAc/UMP translocator, was HA-tagged and stably expressed in 16HBE14o- cells via a retroviral vector. HA-HFRC1 expression assessed with a monoclonal anti-HA antibody is illustrated in Fig. 4A. Anti-HA immunoreactivity was evident in HA-HFRC1-transformed but not in empty vector-transformed cells and exhibited a distribution similar to that of the cis- and trans-Golgi markers GM130 and p230 (Fig. 4A), as previously reported (29, 30). Co-localization of HA-HFRC1 with GM130 and p230 was confirmed using a polyclonal anti-HA-antibody (Fig. 4B).
FIGURE 4.

HA-HFRC1 localizes in the Golgi and confers enhanced cell surface expression of N-acetylglucosamine-containing glycans. A, cells expressing HA-tagged HFRC1 or empty vector were analyzed by immunofluorescence, using monoclonal antibodies against HA (left) and Golgi markers GM130 and p230 (right), followed by FITC-labeled secondary antibody. Nuclei were stained with propidium iodide. Each panel is the overlay of the FITC (green) and nuclei (red) images acquired in face by confocal microscopy. Bar, 25 μm. B, HA-HFRC1-expressing cells were analyzed as above, using polyclonal anti-HA antiserum (HA, red) and monoclonal anti-Golgi GM130 and p230 (Golgi, green) antibodies; nuclei are in blue. An overlay image of HA and Golgi immunostaining is illustrated in the right panel. Bar, 25 μm. C, HA-HFRC1- and empty vector-transfected cells were stained for heparan sulfate (green). Bar, 25 μm. Quantification of cell surface fluorescence intensity is shown in the right panel. The data (expressed in arbitrary units) represent fluorescence intensity associated with the cell surface (mean ± S.D., n = 4). D, xz confocal images of HA-HFRC1- and empty vector-transfected cells stained with fluorescence-labeled wheat germ agglutinin (green); nuclei were stained with propidium iodide (red). Bar, 10 μm. Quantification of wheat germ agglutinin fluorescence intensity associated with the apical surface is shown in the right panel (mean ± S.D., n = 9).
By controlling UDP-GlcNAc entry to the Golgi, HFRC1 modulates the epithelial cell surface expression of N-acetylglucosamine-rich glycoconjugates (29). Consistent with this concept, HA-HFRC1-transformed 16HBE14o- cells displayed enhanced cell surface immunoreactivity toward heparan sulfate (Fig. 4C), relative to empty vector-transformed cells. HFRC1-overexpresing 16HBE14o- cells also displayed increased apical surface binding of wheat germ agglutinin (Fig. 4D), a lectin that recognizes N-acetylglucosamine and sialic acids in airway epithelia (31, 49). Taken together, the results in Fig. 4 indicate that HA-HFRC1 was functionally expressed in the Golgi of 16HBE14o- cells.
Overexpression of HFRC1 resulted in enhanced cellular release of UDP-GlcNAc (Fig. 5A). Resting HA-HFRC1-expressing cells displayed a 3.3-fold increased rate of mucosal UDP-GlcNAc release relative to vector-transformed cells (Fig. 5A). The calculated rates of mucosal UDP-GlcNAc release from resting vector- and HFRC1-transformed cells were 60 and 200 fmol/min, respectively (Fig. 5A). Basolateral levels of UDP-GlcNAc also increased in HFRC1-expressing cells (from 0.9 ± 0.3 to 4.3 ± 0.7 nm), but rates of basolateral release (HFRC1, 56 fmol/min; vector, 29 fmol/min) were considerably lower than their respective mucosal rates (Fig. 5A). HA-HFRC1-conferred UDP-GlcNAc release was markedly reduced by BFA (Fig. 5B).
FIGURE 5.

Enhanced release of UDP-GlcNAc from HA-HFRC1-transformed 16HBE14o- cells. A, UDP-Glc-NAc release from resting control (empty vector)- or HA-HFRC1-transfected cells was measured in the mucosal (M) and basolateral (BL) compartments, in the presence of 300 μm β,γ-metATP. B, BFA (added as in Fig. 3D) inhibits UDP-GlcNAc release from vector- or HA-HFRC1-expressing resting 16HBE14o- cells. C, effect of UMP (300 μm) on the release of UDP-GlcNAc in isotonic solution (Iso) or in response to 50% hypotonic (Hypo) shock (5 min). D, ATP was measured in the mucosal compartment of resting empty vector- or HA-HFRC1-transfected cells. E, effect of hypotonic shock on ATP release (samples were the same as in C, without UMP addition). The data represent the mean value ± S.D. of two independent experiments performed with triplicate samples.
HFRC1 overexpression resulted in enhanced constitutive release of UDP-Glc, in addition to UDP-GlcNAc. Mucosal UDP-Glc concentrations varied from 0.5 ± 0.3 to 2.5 ± 0.5 nm in control cells and from 0.6 ± 0.3 to 4.5 ± 1.1 nm in HA-HFRC1-expressing cells, after a 30-min incubation with β,γ-metATP. The calculate rates of mucosal UDP-Glc release were 22 fmol/min and 43 fmol/min in vector-transformed and HFRC1-transformed cells, respectively. Although these changes were considerably smaller than changes in UDP-Glc-NAc, the results are consistent with the notion that HFRC1 transports UDP-Glc, in addition to UDP-Glc-NAc, to the Golgi lumen (29).
Although constitutive nucleotide release through the apical plasma membrane is an important source of airway surface liquid nucleotides (32), enhanced mucosal nucleotide release occurs in lung epithelial cells subjected to a broad variety of stimuli relevant to the airways (e.g. shear stress and osmotic stress) (31). Hypotonic cell swelling is a commonly employed means to impart acute, robust nonlytic ATP release from 16HBE14o- and other airway epithelial cells (19, 31, 50, 51). Therefore, we asked whether 16HBE14o- cells release UDP-Glc-NAc in response to hypotonic stress and whether such release is affected by overexpression of HFRC1. Hypotonic shock promoted a small but significant release of UDP-GlcNAc onto the mucosal medium, which was increased (>2-fold) in HFRC1-overexpressing 16HBE14o- cells (Fig. 5C). Results obtained with early passages of retrovirus-infected cells were reproduced with two independently isolated clones of HA-HFRC1-transformed cells, arguing against a cell selection artifact accounting for the enhanced UDP-GlcNAc release.
All known UDP-sugar transporters, including HFRC1, are ER/Golgi-resident proteins that translocate UDP-sugars from the cytosol to the lumen of the Golgi, using luminal UMP as antiporter substrate (24, 25, 29). However, the possibility that these proteins were expressed at the plasma membrane of 16HBE14o- cells, therefore exchanging cytosolic UDP-GlcNAc for extracellular UMP, has not been formally examined. Moreover, an important control for our HFRC1 overexpression experiments was to rule out the possibility that a small amount of this transporter, not detectable by immunofluorescence, was expressed at the plasma membrane of the cells as an overexpression artifact.
Accordingly, we asked whether exogenous UMP promotes cellular release of UDP-GlcNAc. Fig. 5C indicates that the addition of UMP (300 μm) to cultures did not enhance UDP-sugar release from HFRC1- or vector-transformed 16HBE14o- cells, either under resting conditions or during hypotonic shock. Thus, the possibility that HA-HFRC1 or an endogenous UDP-sugar/UMP translocator was expressed at the cell surface and facilitated the exchange of cytosolic UDP-GlcNAc for extracellular UMP is highly unlikely.
Last, ATP release was not affected by HFRC1 overexpression (Fig. 5, D and E), therefore arguing against a nonselective mechanism (e.g. plasma membrane instability) accounting for the enhanced UDP-sugar release in HA-HFRC1-transformed cells.
In sum, overexpression of HFRC1 in the Golgi of 16HBE14o- cells resulted in enhanced production of N-acetylglucosamine-rich glycans and increased release of UDP-Glc-NAc (and to a lesser extent UDP-Glc). These results strongly suggest that entry of UDP-sugars into the Golgi contributes to the cellular release of these molecules (i.e. from the secretory pathway).
Yeast Releases UDP-GlcNAc in a Yea4-dependent Manner—Three UDP-GlcNAc transporters have been identified in the human genome, SLC35A3, SLC35B4, and HFRC1/SLC35D2 (24, 29, 30). Quantitative reverse transcription-PCR analysis indicated a relative abundance of HFRC1, SLC35B4, and SLC35A3 transcripts in 16HBE14o- cells of 0.23, 0.20, and 0.57, respectively. In contrast to the redundancy of human UDP-Glc-NAc transporters, Yea4 is a major UDP-GlcNAc transporter in S. cerevisiae, accounting for ∼40% of the UDP-GlcNAc transport activity associated with the particulate fraction of these cells (52). Therefore, we turned to this yeast model for gene deletion experiments.
Yeasts have been useful for identifying components of the ATP release machinery (53), and we have recently reported that S. cerevisiae releases UDP-Glc constitutively in addition to ATP (54). These studies were expanded to define the contribution of the secretory pathway to UDP-GlcNAc release, using WT and Yea4-deficient (yea4Δ) yeast.
UDP-GlcNAc within the ER/Golgi is a major precursor for the synthesis of the yeast wall component chitin (52). Accordingly, yea4Δ cells displayed reduced staining for chitin relative to WT cells (Fig. 6, A and B). Complementing yea4Δ cells with the WT yea4 gene resulted in chitin staining intensity that was similar to or stronger than that observed with WT cells (Fig. 6, A and B).
FIGURE 6.

Yeast release UDP-GlcNAc in a Yea4-dependent manner. A, chitin staining in WT, yea4Δ, and Yea4-complemented yea4Δ (ΔYea4/Yea4+) cells. B, quantification of chitin staining. The data (expressed in arbitrary units) represent the number of pixels displaying fluorescence intensity 5 times greater than background (mean ± S.D., n = 6). C, yeasts were incubated for 2 h at 30 °C in the presence of 5 nm UDP-[3H]GlcNAc, and UDP-[3H]GlcNAc hydrolysis was accessed by HPLC. D, release of UDP-GlcNAc from WT, yea4Δ, and Yea4-complemented yea4Δ cells was assessed at the times indicated, as described under “Experimental Procedures.” E, cells were incubated in the presence or absence of 300 μm UMP for 2 h. The data (C and D) represent the mean value ± S.D. of two independent experiments performed with quadruplicate samples.
Unlike human cells, yeasts do not hydrolyze extracellular UDP-[3H]GlcNAc, as indicated by the total recovery of UDP-[3H]GlcNAc after a 120-min incubation period of the radiotracer with a 108 cell/ml suspension (Fig. 6C). UDP-[3H]GlcNAc stability was not affected by the yea4Δ deletion (Fig. 6C). Therefore, changes in extracellular UDP-GlcNAc levels in yeast directly reflect changes in UDP-GlcNAc release rates. Incubation of yeast (108 cells/ml) resulted in gradual extracellular accumulation of UDP-GlcNAc, which increased to ∼4, 10, and 20 nm after 30, 60, and 120 min, respectively (Fig. 6D). Extracellular UDP-GlcNAc levels in ΔYea cells were significantly lower than in WT cells (Fig. 6D). Extracellular UDP-Glc and ATP levels were not affected by the yea4Δ deletion (54). Decreased UDP-GlcNAc release in yea4Δ cells was not a consequence of secondary defects, since complementing yea4Δ cells with the WT yea4 gene restored the UDP-GlcNAc release phenotype of WT cells (Fig. 6D). Intracellular levels of UDP-GlcNAc increased with time, from 440 pmol/108 cells (t = 0) to 1890 pmol/108 cells (120 min), but were nearly identical among WT, yea4Δ, and Yea4-complemented yea4Δ cells at each given time point (not shown). The addition of 300 μm UMP to the incubation medium did not affect the rate of release of UDP-GlcNAc either in WT or Yea4-complemented strains (Fig. 6E), ruling out the possibility that Yea4 or another UDP-GlcNAc/UMP translocator was expressed at the plasma membrane as an experimental artifact.
DISCUSSION
Despite the recognized signaling roles of extracellular UDP-sugars, the mechanisms by which these molecules are released from cells to accomplish extracellular functions are not understood. Cellular release of UDP-sugars may involve both conductive and vesicular pathways. Our study was aimed at defining the involvement of one potential component (i.e. the ER/Golgi lumen). We reasoned that by controlling the entry of UDP-sugars to the lumen of the secretory pathway, ER/Golgi-resident SLC35 transporters regulate the cellular release of their cognate substrates into the extracellular milieu. We tested this hypothesis by examining the contribution of ER/Golgi UDP-GlcNAc translocators to UDP-GlcNAc release.
Previously, evidence for the release of nucleotides from Golgi-derived vesicles (in nonexcitatory/secretory cells) has been circumstantial. For example, the fungus metabolite BFA blocks traffic between the ER and the cis-Golgi and has been shown to inhibit ATP release from a number of cells (reviewed in Ref. 18). We have recently reported that BFA impaired UDP-sugar release from astrocytoma cells and yeast (16, 54), and our present data (Figs. 3D and 5B) illustrated that BFA significantly reduced UDP-sugar release from airway epithelial cells. However, although these observations support the involvement of vesicles in the cellular release of ATP and UDP-sugars, they do not distinguish between vesicular nucleotide release and vesicular trafficking and plasma membrane insertion of a nucleotide channel/transporter.
By amplifying and purifying recombinant AGX2, a highly sensitive and selective assay for UDP-GlcNAc was developed. Using this novel assay, we demonstrated the regulated release of UDP-GlcNAc from complex systems, including highly differentiated polarized airway epithelia and unicellular organisms. More importantly, this assay positioned us to examine, for the first time, the extent to which UDP-sugar release depends on its entry to the Golgi lumen. The major finding of our study was that UDP-GlcNAc was released from cells in a UDP-GlcNAc transporter-dependent manner; i.e. release of UDP-GlcNAc was increased in airway epithelial cells overexpressing a Golgi UDP-GlcNAc transporter, and it was impaired in yeast missing its UDP-GlcNAc transporter gene.
HFRC1, also named SLC35D2, is a Golgi-resident UDP-GlcNAc transporter abundantly expressed in epithelium-rich and other tissues (29, 30). By importing UDP-GlcNAc into the Golgi, HFRC1 is involved in the synthesis of N-acetylglucosamine-rich glycans (29). We showed that HA-HFRC1-expressing human bronchial epithelial cells displayed both Golgi localization of the HA-tagged transporter and enhanced cell surface expression of N-acetylglucosamine-rich glycans (Fig. 4). Particularly relevant to our central hypothesis was the finding that HFRC1-transformed 16HBE14o- cells displayed nearly 3-fold faster release of UDP-GlcNAc than control cells (Fig. 5A).
We and others have previously shown that airway epithelial and other cells undergo rapid vesicle-plasma membrane fusion upon hypotonic stress, a mechanism that compensates for the expanding volume during hyposmotic swelling (21, 23, 50, 55). Correlation between hypotonic stress-promoted vesicle exocytosis and ATP release has been interpreted as evidence for exocytotic ATP release (19, 21, 23, 56). However, as stated above, it was not clear whether ATP was released from vesicles or diffused from cells via a channel inserted into the plasma membrane during vesicle fusion. Our present study illustrates that, in addition to facilitating constitutive UDP-sugar release, HFRC1 conferred enhanced UDP-GlcNAc release to hypotonically stimulated airway epithelial cells (Fig. 5C). Therefore, we propose that UDP-GlcNAc-loaded vesicles undergo exocytosis upon hypotonic stress.
There is a general consensus that UDP-sugar/UMP antiporters localize selectively within ER and Golgi membranes (24, 29, 57, 58), but expression of these transporters at the plasma membrane has not been formally investigated. Moreover, an important control in our study was to rule out the possibility that HFRC1 or another UDP-GlcNAc transporter was expressed at the plasma membrane either naturally or as an experimental artifact. Taking advantage of the fact that HFRC1, like all known UDP-sugar transporters, uses UMP as antiporter substrate, we asked whether exogenous UMP promotes cellular release of UDP-GlcNAc. Our data (Fig. 5C) demonstrated that UMP (300 μm) has no effect on UDP-sugar release from HFRC1- or vector-transformed 16HBE14o- cells, either under resting conditions or during hypotonic shock. Thus, the possibility that HFRC1 or another endogenous UDP-sugar/UMP translocator was expressed at the cell surface and facilitated the exchange of cytosolic UDP-GlcNAc for extracellular UMP is not supported by our results.
Although UDP-GlcNAc is indisputably the substrate of HFRC1/SLC35D2, it has been shown that HFRC1 also facilitates entry of UDP-Glc into the Golgi (29). HFRC1-transformed 16HBE14o- cells displayed enhanced release of UDP-Glc although less robustly than UDP-GlcNAc. Whether HFRC1 is itself a Golgi UDP-Glc translocator, as previously proposed (29) or whether the increased availability of UMP in the Golgi of HFRC1-overexpressing cells promoted the activity of a separate UDP-Glc/UMP antiporter has not been unambiguously established. Regardless of the interpretation of the UDP-Glc data, our results establish for the first time a link between UDP-sugar entry into the Golgi and UDP-sugar release. On a speculative basis, we hypothesize that basal UDP-sugar release observed in epithelial cells reflects release of these cargo molecules during constitutive export of glycans to the cell surface.
In addition to HFRC1/SLC35D2, two other members of the SLC35 family of nucleotide sugar transporters (SLC35A3 and SLC35B4) translocate UDP-GlcNAc to the Golgi in humans. Indeed, our data indicate that SLC35A3 and SLC35B4 combined account for 77% of the transcripts encoding for UDP-GlcNAc transporters in 16HBE14o- cells. Hence, removal of endogenous HFRC1 would be unlikely to affect UDP-GlcNAc release from these cells. Unlike humans, one UDP-GlcNAc transporter has been identified in yeast, Yea4, which accounts for ∼40% of the UDP-GlcNAc transport activity present in the ER/Golgi fraction of these cells (52). Yea4 is distantly related to human SLC35B4 and participates in the synthesis of chitin, a linear homopolymer of β-1,4-linked N-acetylglucosamine residues (52). Consistent with its decreased [H]UDPG transport activity, Yeasts with a deletion for yea4 (yea4Δ cells) display reduced chitin content relative to WT cells (52). Therefore, although residual, not yet identified UDP-GlcNAc transport activity is expressed in yea4Δ cells, this mutant provides a useful model to examine the extent to which an endogenous UDP-GlcNAc translocator contributes to the cellular release of its cognate substrate.
Our results clearly indicate that yeasts release UDP-GlcNAc in a Yea4-dependent manner. For example, (i) yea4Δ cells displayed diminished UDP-GlcNAc release relative to the WT parental strain, and (ii) complementing yea4Δ cells with the WT yea4 gene corrected the deficient UDP-GlcNAc release phenotype of the mutant strain. As discussed above with 16HBE14o- cells, the lack of effect of UMP on UDP-GlcNAc release from WT or yea4Δ-complemented yeast (Fig. 6E) argues against the possibility that Yea4 was expressed at the plasma membrane. It is worth noting that UDP-GlcNAc release was not completely abolished in yea4Δ cells. Since chitin staining also was not completely eliminated in yea4Δ cells (Fig. 6A) (52), this residual UDP-GlcNAc release activity probably reflected entry of UDP-GlcNAc to the ER/Golgi via an additional not yet identified transporter, as previously proposed (52). Alternatively, efflux of cytosolic UDP-GlcNAc may have occurred via an unidentified plasma membrane channel.
Previously, we have reported that release of UDP-Glc from yeast was not affected by the yea4 gene deletion (54). Notably, UDP-Glc release was up-regulated in cells lacking the orphan nucleotide sugar transporter gene ymd8 (54). We speculated that the increase in UDP-Glc release reflected nonselective entry of UDP-Glc into the Golgi of ymd8Δ cells as a compensatory mechanism (54). This hypothesis was reinforced by the observation that ymd8Δ yeast carrying additional deletions (yea4 and/or the UDP-Gal transporter gene hut1) displayed decreased UDP-Glc release relative to ymd8Δ single mutants (54). However, since Yea4 or HUT1 do not transport UDP-Glc, interpretation of these results has remained speculative. Our present data illustrate for the first time that deletion of an endogenous UDP-sugar transporter markedly decreased the cellular release of its natural substrate. Release of UDP-GlcNAc from either WT or Yea4-corrected yea4Δ yeast was not affected by the presence of UMP in the extracellular medium. The most compelling interpretation of our results is that UDP-GlcNAc release from yeast reflects, at least in part, a selective entry of UDP-GlcNAc into the ER/Golgi via Yea4, which eventually results in exocytotic release of the nucleotide sugar during exportation of chitin and/or other glycans.
Nearly a decade has elapsed since Chambers et al. (3) characterized the human orphan G protein-coupled receptor KIAA0001 (subsequently named P2Y14) as a receptor that recognizes UDP-Glc, UDP-Gal, UDP-GlcA, and UDP-GlcNAc as its endogenous agonists. UDP-sugar-promoted P2Y14 receptor-mediated responses have been subsequently reported in several cell types, most notably in immune cells, suggesting a role for this receptor in inflammation. Our laboratory has illustrated the occurrence of UDP-Glc release from a number of tissues and cell types (14, 16) and has now shown that cells release UDP-GlcNAc, in addition to UDP-Glc. Steady-state concentrations of UDP-GlcNAc in the extracellular medium are similar to or higher than UDP-Glc. UDP-GlcNAc is released from resting 16HBE14o- cells at rates (65 fmol/min) that were approximately 3 times higher than the UDP-Glc release rate (22 fmol/min). Given the functional expression of the P2Y14 receptor in neutrophils, lymphocytes, and other inflammatory cells (5-7, 12), the observation of UDP-GlcNAc and UDP-Glc release from airway epithelial cells has potential pathophysiological implications (i.e. as local modulators of leukocyte function in inflamed lungs). Highly relevant to this scenario is our finding that UDP-GlcNAc and UDP-Glc levels in in vivo airway surface liquid (i.e. BALF) from chronically diseased (e.g. cystic fibrosis) lungs are in the range for promoting robust P2Y14 receptor activation.
In sum, the HFRC1- and Yea4-dependent release of UDP-sugars observed with resting 16HBE14o- cells and yeast, respectively, indicates that the secretory pathway contributes, at least in part, to the constitutive release of these species. Our data also suggest that UDP-GlcNAc-containing vesicles contribute to the release of UDP-sugars in hypotonically challenged epithelia. Previously, we illustrated that ATP and UDP-Glc release from specialized (i.e. mucin-secreting) goblet epithelial cells was associated with exocytosis of mucins, suggesting (but not proving) that nucleotides were released from secretory granules (15). The present study with 16HBE14o- cells, a model of bronchial epithelial cells of “ciliated” cell origin (59), provides compelling evidence for the contribution of Golgi-derived vesicles to nucleotide release from nonmucous (i.e. nonsecretory) epithelia. Taken together, our present and previous studies indicate that the secretory pathway is an important source of extracellular UDP-sugars. Because ATP, like UDP-sugars, is transported to and used as an energy source within the ER/Golgi (25), we speculate that ATP and its metabolites are potentially released from the secretory pathway in nonexcitatory cells.
Supplementary Material
Acknowledgments
We thank Catharina van Heusden and Joshua Tomberg for technical assistance, Dr. John Olsen for retrovirus production, and Dr. Robert Tarran and the University of North Carolina Michael Hooker microscopy facility for the use of the Leica SP5 confocal microscope system and Leica DMIRB microscope, respectively. We are also indebted to Dr. T. Kendal Harden and Dr. Richard C. Boucher for critical reading of and Lisa Brown for editorial assistance with the manuscript.
This work was supported, in whole or in part, by National Institutes of Health Grant P01-HL034322.
The on-line version of this article (available at http://www.jbc.org) contains supplemental Fig. S1.
Footnotes
The abbreviations used are: ER, endoplasmic reticulum; HPLC, high performance liquid chromatography; GlcNAc-1P, N-acetylglucosamine-1P; BFA, brefeldin A; BALF, bronchoalveolar lavage fluid; WT, wild type; FITC, fluorescein isothiocyanate.
References
- 1.Burnstock, G., and Williams, M. (2000) J. Pharmacol. Exp. Ther. 295 862-869 [PubMed] [Google Scholar]
- 2.Burnstock, G. (2006) Br. J. Pharmacol. 147 Suppl. 1, S172-S181 [DOI] [PMC free article] [PubMed] [Google Scholar]
- 3.Chambers, J. K., Macdonald, L. E., Sarau, H. M., Ames, R. S., Freeman, K., Foley, J. J., Zhu, Y., McLaughlin, M. M., Murdock, P., McMillan, L., Trill, J., Swift, A., Aiyar, N., Taylor, P., Vawter, L., Naheed, S., Szekeres, P., Hervieu, G., Scott, C., Watson, J. M., Murphy, A. J., Duzic, E., Klein, C., Bergsma, D. J., Wilson, S., and Livi, G. P. (2000) J. Biol. Chem. 275 10767-10771 [DOI] [PubMed] [Google Scholar]
- 4.Abbracchio, M. P., Boeynaems, J. M., Barnard, E. A., Boyer, J. L., Kennedy, C., Miras-Portugal, M. T., King, B. F., Gachet, C., Jacobson, K. A., Weisman, G. A., and Burnstock, G. (2003) Trends Pharmacol. Sci. 24 52-55 [DOI] [PMC free article] [PubMed] [Google Scholar]
- 5.Moore, D. J., Murdock, P. R., Watson, J. M., Faull, R. L., Waldvogel, H. J., Szekeres, P. G., Wilson, S., Freeman, K. B., and Emson, P. C. (2003) Brain Res. Mol. Brain Res. 118 10-23 [DOI] [PubMed] [Google Scholar]
- 6.Scrivens, M., and Dickenson, J. M. (2006) Eur. J. Pharmacol. 543 166-173 [DOI] [PubMed] [Google Scholar]
- 7.Scrivens, M., and Dickenson, J. M. (2005) Br. J. Pharmacol. 146 435-444 [DOI] [PMC free article] [PubMed] [Google Scholar]
- 8.Fumagalli, M., Brambilla, R., D'Ambrosi, N., Volonte, C., Matteoli, M., Verderio, C., and Abbracchio, M. P. (2003) Glia 43 218-230 [DOI] [PubMed] [Google Scholar]
- 9.Bianco, F., Fumagalli, M., Pravettoni, E., D'Ambrosi, N., Volonte, C., Matteoli, M., Abbracchio, M. P., and Verderio, C. (2005) Brain Res. Brain Res. Rev. 48 144-156 [DOI] [PubMed] [Google Scholar]
- 10.Muller, T., Bayer, H., Myrtek, D., Ferrari, D., Sorichter, S., Ziegenhagen, M. W., Zissel, G., Virchow, J. C., Jr., Luttmann, W., Norgauer, J., Di Virgilio, F., and Idzko, M. (2005) Am. J. Respir. Cell Mol. Biol. 33 601-609 [DOI] [PubMed] [Google Scholar]
- 11.Lee, B. C., Cheng, T., Adams, G. B., Attar, E. C., Miura, N., Lee, S. B., Saito, Y., Olszak, I., Dombkowski, D., Olson, D. P., Hancock, J., Choi, P. S., Haber, D. A., Luster, A. D., and Scadden, D. T. (2003) Genes Dev. 17 1592-1604 [DOI] [PMC free article] [PubMed] [Google Scholar]
- 12.Skelton, L., Cooper, M., Murphy, M., and Platt, A. (2003) J. Immunol. 171 1941-1949 [DOI] [PubMed] [Google Scholar]
- 13.Shin, A., Toy, T., Rothenfusser, S., Robson, N., Vorac, J., Dauer, M., Stuplich, M., Endres, S., Cebon, J., Maraskovsky, E., and Schnurr, M. (2008) Blood 111 3062-3069 [DOI] [PubMed] [Google Scholar]
- 14.Lazarowski, E. R., Shea, D. A., Boucher, R. C., and Harden, T. K. (2003) Mol. Pharmacol. 63 1190-1197 [DOI] [PubMed] [Google Scholar]
- 15.Kreda, S. M., Okada, S. F., van Heusden, C. A., O'Neal, W., Gabriel, S., Abdullah, L., Davis, C. W., Boucher, R. C., and Lazarowski, E. R. (2007) J. Physiol. 584 245-259 [DOI] [PMC free article] [PubMed] [Google Scholar]
- 16.Kreda, S. M., Seminario-Vidal, L., Heusden, C., and Lazarowski, E. R. (2008) Br. J. Pharmacol. 153 1528-1537 [DOI] [PMC free article] [PubMed] [Google Scholar]
- 17.Sabirov, R., and Okada, Y. (2005) Purinerg. Signal. 1 311-328 [DOI] [PMC free article] [PubMed] [Google Scholar]
- 18.Lazarowski, E. R., Boucher, R. C., and Harden, T. K. (2003) Mol. Pharmacol. 64 785-795 [DOI] [PubMed] [Google Scholar]
- 19.Boudreault, F., and Grygorczyk, R. (2004) J. Physiol. (Lond.) 561 499-513 [DOI] [PMC free article] [PubMed] [Google Scholar]
- 20.Bodin, P., and Burnstock, G. (2001) J. Cardiovasc. Pharmacol. 38 900-908 [DOI] [PubMed] [Google Scholar]
- 21.Gatof, D., Kilic, G., and Fitz, J. G. (2004) Am. J. Physiol. 286 G538-G546 [DOI] [PubMed] [Google Scholar]
- 22.Maroto, R., and Hamill, O. P. (2001) J. Biol. Chem. 276 23867-23872 [DOI] [PubMed] [Google Scholar]
- 23.van der Wijk, T., Tomassen, S. F., Houtsmuller, A. B., de Jonge, H. R., and Tilly, B. C. (2003) J. Biol. Chem. 278 40020-40025 [DOI] [PubMed] [Google Scholar]
- 24.Ishida, N., and Kawakita, M. (2004) Pflugers Arch. 447 768-775 [DOI] [PubMed] [Google Scholar]
- 25.Hirschberg, C. B., Robbins, P. W., and Abeijon, C. (1998) Annu. Rev. Biochem. 67 49-69 [DOI] [PubMed] [Google Scholar]
- 26.Guillen, E., and Hirschberg, C. B. (1995) Biochemistry 34 5472-5476 [DOI] [PubMed] [Google Scholar]
- 27.Perez, M., and Hirschberg, C. B. (1986) J. Biol. Chem. 261 6822-6830 [PubMed] [Google Scholar]
- 28.Clairmont, C. A., De Maio, A., and Hirschberg, C. B. (1992) J. Biol. Chem. 267 3983-3990 [PubMed] [Google Scholar]
- 29.Suda, T., Kamiyama, S., Suzuki, M., Kikuchi, N., Nakayama, K., Narimatsu, H., Jigami, Y., Aoki, T., and Nishihara, S. (2004) J. Biol. Chem. 279 26469-26474 [DOI] [PubMed] [Google Scholar]
- 30.Ishida, N., Kuba, T., Aoki, K., Miyatake, S., Kawakita, M., and Sanai, Y. (2005) Genomics 85 106-116 [DOI] [PubMed] [Google Scholar]
- 31.Okada, S. F., Nicholas, R. A., Kreda, S. M., Lazarowski, E. R., and Boucher, R. C. (2006) J. Biol. Chem. 281 22992-23002 [DOI] [PMC free article] [PubMed] [Google Scholar]
- 32.Lazarowski, E. R., Tarran, R., Grubb, B. R., van Heusden, C. A., Okada, S., and Boucher, R. C. (2004) J. Biol. Chem. 279 36855-36864 [DOI] [PMC free article] [PubMed] [Google Scholar]
- 33.Esther, C. R., Alexis, N. E., Clas, M. L., Lazarowski, E. R., Donaldson, S. H., Pedrosa Ribeiro, C. M., Moore, C. G., Davis, S. D., and Boucher, R. C. (2008) Eur. Respir. J. 31 949-956 [DOI] [PMC free article] [PubMed] [Google Scholar]
- 34.Turnock, D. C., and Ferguson, M. A. (2007) Eukaryot. Cell 6 1450-1463 [DOI] [PMC free article] [PubMed] [Google Scholar]
- 35.Johnson, L. G., Mewshaw, J. P., Ni, H., Friedmann, T., Boucher, R. C., and Olsen, J. C. (1998) J. Virol. 72 8861-8872 [DOI] [PMC free article] [PubMed] [Google Scholar]
- 36.Kreda, S. M., Pickles, R. J., Lazarowski, E. R., and Boucher, R. C. (2000) Nat. Biotechnol. 18 635-640 [DOI] [PubMed] [Google Scholar]
- 37.Pfaffl, M. W. (2001) Nucleic Acids Res. 29 2002-2007 [DOI] [PMC free article] [PubMed] [Google Scholar]
- 38.Gietz, D., St. Jean, A., Woods, R. A., and Schiestl, R. H. (1992) Nucleic Acids Res. 20 1425. [DOI] [PMC free article] [PubMed] [Google Scholar]
- 39.Lazarowski, E. R., Boucher, R. C., and Harden, T. K. (2000) J. Biol. Chem. 275 31061-31068 [DOI] [PubMed] [Google Scholar]
- 40.Wang-Gillam, A., Pastuszak, I., and Elbein, A. D. (1998) J. Biol. Chem. 273 27055-27057 [DOI] [PubMed] [Google Scholar]
- 41.Peneff, C., Ferrari, P., Charrier, V., Taburet, Y., Monnier, C., Zamboni, V., Winter, J., Harnois, M., Fassy, F., and Bourne, Y. (2001) EMBO J. 20 6191-6202 [DOI] [PMC free article] [PubMed] [Google Scholar]
- 42.Mengin-Lecreulx, D., and van Heijenoort, J. (1994) J. Bacteriol. 176 5788-5795 [DOI] [PMC free article] [PubMed] [Google Scholar]
- 43.Lazarowski, E. R., and Harden, T. K. (1999) Br. J. Pharmacol. 127 1272-1278 [DOI] [PMC free article] [PubMed] [Google Scholar]
- 44.Joseph, S. M., Pifer, M. A., Przybylski, R. J., and Dubyak, G. R. (2004) Br. J. Pharmacol. 142 1002-1014 [DOI] [PMC free article] [PubMed] [Google Scholar]
- 45.Jokela, T. A., Jauhiainen, M., Auriola, S., Kauhanen, M., Tiihonen, R., Tammi, M. I., and Tammi, R. H. (2008) J. Biol. Chem. 283 7666-7673 [DOI] [PubMed] [Google Scholar]
- 46.Rabina, J., Maki, M., Savilahti, E. M., Jarvinen, N., Penttila, L., and Renkonen, R. (2001) Glycoconj. J. 18 799-805 [DOI] [PubMed] [Google Scholar]
- 47.Dinter, A., and Berger, E. G. (1998) Histochem. Cell Biol. 109 571-590 [DOI] [PubMed] [Google Scholar]
- 48.Shinotsuka, C., Yoshida, Y., Kawamoto, K., Takatsu, H., and Nakayama, K. (2002) J. Biol. Chem. 277 9468-9473 [DOI] [PubMed] [Google Scholar]
- 49.Yi, S. M., Harson, R. E., Zabner, J., and Welsh, M. J. (2001) Gene Ther. 8 1826-1832 [DOI] [PubMed] [Google Scholar]
- 50.Groulx, N., Boudreault, F., Orlov, S. N., and Grygorczyk, R. (2006) J. Membr. Biol. 214 43-56 [DOI] [PubMed] [Google Scholar]
- 51.Guyot, A., and Hanrahan, J. W. (2002) J. Physiol. (Lond.) 545 199-206 [DOI] [PMC free article] [PubMed] [Google Scholar]
- 52.Roy, S. K., Chiba, Y., Takeuchi, M., and Jigami, Y. (2000) J. Biol. Chem. 275 13580-13587 [DOI] [PubMed] [Google Scholar]
- 53.Zhong, X., Malhotra, R., and Guidotti, G. (2003) J. Biol. Chem. 278 33436-33444 [DOI] [PubMed] [Google Scholar]
- 54.Esther, C. R., Jr., Dohlman, H. G., Ault, A. D., Clas, M. L., Lazarowski, E. R., and Boucher, R. C. (2008) Biochemistry 47 9269-9278 [DOI] [PMC free article] [PubMed] [Google Scholar]
- 55.Boudreault, F., and Grygorczyk, R. (2004) J. Microsc. 215 302-312 [DOI] [PubMed] [Google Scholar]
- 56.Tatur, S., Kreda, S., Lazarowski, E., and Grygorczyk, R. (2008) Purinerg. Signal. 4 139-146 [DOI] [PMC free article] [PubMed] [Google Scholar]
- 57.Berninsone, P. M., and Hirschberg, C. B. (2000) Curr. Opin. Struct. Biol. 10 542-547 [DOI] [PubMed] [Google Scholar]
- 58.Selva, E. M., Hong, K., Baeg, G. H., Beverley, S. M., Turco, S. J., Perrimon, N., and Hacker, U. (2001) Nat. Cell Biol. 3 809-815 [DOI] [PubMed] [Google Scholar]
- 59.Cozens, A. L., Yezzi, M. J., Kunzelmann, K., Ohrui, T., Chin, L., Eng, K., Finkbeiner, W. E., Widdicombe, J. H., and Gruenert, D. C. (1994) Am. J. Respir. Cell Mol. Biol. 10 38-47 [DOI] [PubMed] [Google Scholar]
Associated Data
This section collects any data citations, data availability statements, or supplementary materials included in this article.