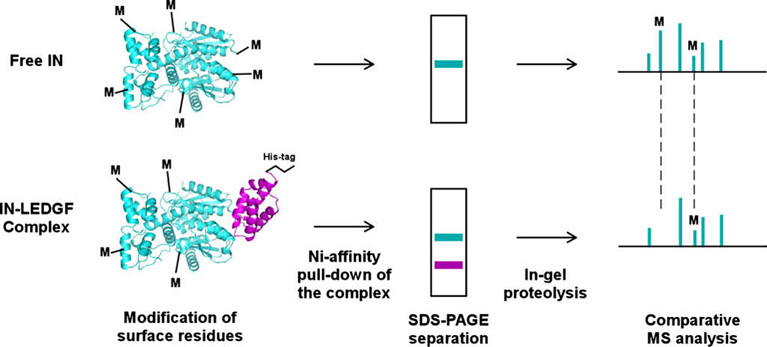
Fig. 1.

Schematic of the MS-based protein footprinting method. The structures of the IN CCD and its complex with the LEDGF IBD are used for illustration, while the experiments were performed with full-length IN and LEDGF. In parallel experiments free IN and the complex are subjected to treatments by small chemical modifiers (M) and analyzed as described in the text.
