Abstract
Acrolein is a cell metabolic product and a main component of cigarette smoke. Its reaction with DNA produces two guanine lesions γ-OH-PdG, a major adduct that is nonmutagenic in mammalian cells, and the positional isomer α-OH-PdG. We describe here the solution structure of a short DNA duplex containing a single α-OH-PdG lesion, as determined by solution NMR spectroscopy and restrained molecular dynamics simulations. The spectroscopic data show a mostly regular right-handed helix, locally perturbed at its center by the presence of the lesion. All undamaged residues of the duplex are in anti orientation, forming standard Watson–Crick base-pair alignments. Duplication of proton signals near the damaged site differentiates two enantiomeric duplexes, thus establishing the exocyclic nature of the lesion. At the lesion site, α-OH-PdG rotates to a syn conformation, pairing to its counter cytosine residue that is protonated at pH 5.9. Three-dimensional models produced by restrained molecular dynamics simulations show different hydrogen-bonding patterns between the lesion and its cytosine partner and identify further stabilization of α-OH-PdG in a syn conformation by intra-residue hydrogen bonds. We compare the α-OH-PdG•dC duplex structure with that of duplexes containing the analogous lesion propano-dG and discuss the implications of our findings for the mutagenic bypass of acrolein lesions.
INTRODUCTION
Acrolein or propenal, the simplest α,β-unsaturated aldehyde, is a prevalent environmental pollutant (1). The chemical industry uses thousand of tons of acrolein every year as starting material for the preparation of polymers and simple organic substances. The incomplete combustion of organic materials, including wood, food, fuels and tobacco are additional sources of acrolein in the environment. Depending on the type and brand, cigarette smoke contains between 18 and 98 μg of acrolein per cigarette, quantities that far exceed those of polycyclic aromatic hydrocarbons or nitrosamines (2) and, not surprisingly, lung tissues of smokers have higher levels of acrolein-derived DNA lesions than that of the polycyclic aromatic hydrocarbon adducts (3). In addition to environmental sources of propenal, the metabolic oxidation of polyamines (4) and lipid peroxidation process (5–7) endogenously generate significant amounts of acrolein within cells. Furthermore, acrolein is a product of cyclophosphamide metabolism and lymphocytes of patients undergoing chemotherapy with this agent contain significant amounts of acrolein-derived DNA adducts (8,9).
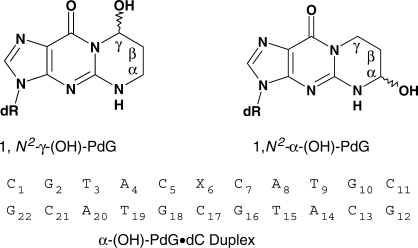
As with other α,β-unsaturated aldehydes, acrolein reacts with nucleophilic centers in DNA and proteins via a Michael addition without requiring metabolic activation (10–12). The reaction of acrolein with double-stranded DNA generates two isomeric deoxyguanosine adducts. The main product, γ-OH-PdG, originates from Michael addition to the peripheral amino group of dG whereas the minor product, α-OH-PdG (Figure 1), occurs by initial attack at the N1 position (11). Both adducts compromise the Watson–Crick (WC) edge of dG and, thus, should have important genotoxic effects. Early mutagenic studies in prokaryotic and eukaryotic cells showed that acrolein induces base substitution mutations, primarily G•C → T•A transversions and G•C → A•T transitions (13–16). However, since acrolein adducts are unstable under the conditions required for solid-phase DNA synthesis, these early studies employed cells directly exposed to acrolein or transformed with acrolein-treated plasmids, precluding the independent assessment of each dG adduct toward toxicity.
Figure 1.
Chemical structure of acrolein adducts and sequence composition of the α-OH-PdG•dC duplex.
Recent advances in the synthesis of damaged DNA have made possible the preparation of duplexes having site-specific lesions, γ-OH-PdG or α-OH-PdG (17–20), which have permitted the independent evaluation of toxic properties of each adduct (21–24). Unexpectedly, DNA replication across γ-OH-PdG lesions is quite efficient and proceeds mostly (>99%) without causing mutational events, in either bacterial or mammalian cells (21–23). In contrast, α-OH-PdG extensively blocks DNA replication in human cells and, when bypassed by TLS polymerases, it mostly codes for dC incorporation together with a few G → T and G → A base substitution mutations (24). Simultaneously with these studies, we used NMR spectroscopy to characterize the structure of oligomeric DNA containing a single γ-OH-PdG lesion at its center. We observed that although γ-OH-PdG exists in the cyclic 1,N2-(OH)-propano form in the simple nucleoside, it is present as the noncyclic N2-(3-propanal) in DNA, a state that minimally perturbs the helical structure of the DNA and allows WC alignments throughout the duplex, including at the site of the lesion (25). The linear form of γ-OH-PdG not only explained the onset of error-free replication across the lesion but also the presence of interstrand cross-links during the mutagenesis studies (24,26).
Here, we report the solution structure of an undecanucleotide duplex containing α-OH-PdG, as determined by NMR spectroscopy and restrained molecular dynamics. Hereinafter this double-strand construct is referred to as the α-OH-PdG•dC duplex. Our results indicate that, contrary to the γ-OH-PdG case, α-OH-PdG exists in the closed form, which perturbs the local duplex structure at the damaged site and hinders WC hydrogen bonding across the lesion-containing base pair. Figure 1 shows the chemical structure of acrolein-derived dG lesions and the duplex sequence employed in our study.
EXPERIMENTAL PROCEDURES
Synthesis and purification of oligodeoxynucleotide samples
The oligomer containing the lesion was prepared using standard solid-phase synthesis methods, following a postsynthetic procedure for the incorporation of α-OH-PdG (20). Briefly, the 5′-O-dimethoxytrityl-3′-O-(β-cyanoethyl)-phosphoramidite derivative of 1-(3,4-diacetylbutyl)-N2-(dimethylaminomethylene)-dG was chemically synthesized and used to incorporate 1-(3,4-diacetoxybutyl)-dG at the center of an undecanucleotide. Samples dimethoxytritylated at the 5′-terminus were purified by HPLC using a reverse-phase Luna 5 μm Phenyl-Hexyl (250 × 10 mm) column (Phenomenex, Torrance, CA, USA), with a mobile phase consisting of a 16–36% acetonitrile gradient, over 35 min, in 0.1 M triethylammonium acetate buffer, pH 6.8. After removal of the 5′-O-DMT group by reaction with 80% acetic acid for 30 minutes, the oligomer was subjected to a second HPLC purification using the same column with a 0–20% acetonitrile gradient over 40 min. Treatment of the pure1-(3,4-dihydroxybutyl)-dG containing oligomer, for 5 min at room temperature, with a 100 mM sodium periodate solution (0.5 M sodium acetate buffer, pH 6.0) oxidatively cleaved the dihydroxy chain producing the α-OH-PdG lesion. After oxidation, a final HPLC purification of the material yielded a single peak that corresponded to the desired product. ESI-MS analysis revealed an m/z = 3373.9 ± 1.3 (theoretical mass 3373.2), verifying the identity of the lesion-containing strand. The complementary unmodified oligomer was prepared and purified following similar procedures.
Duplex formation and sample preparation
A 1:1 strand ratio was obtained by monitoring the intensity of isolated NMR proton signals during the gradual addition of the unmodified oligomer to that containing the lesion. NMR samples consisted of 180 OD260 of the duplex dissolved in 0.6 ml of 25 mM phosphate buffer, pH 5.9, containing 50 mM NaCl and 1 mM EDTA in either 99.96% D2O (D2O buffer) or 90% H2O-10% D2O (v/v) (H2O buffer), corresponding to around 2.5 mM duplex concentration.
NMR experiments
One- and two-dimensional NMR spectra were collected on a Varian Inova spectrometer operating at 11.75 T field strength. Proton chemical shifts were referenced relative to sodium 3-(trimethylsilyl)propionate-2,2,3,3-d4 at 0 p.p.m. Phase-sensitive (27) NOESY (50, 150, 200 and 300 ms mixing time), COSY, DQF-COSY and TOCSY (70 and 120 ms contact time) spectra in D2O buffer were recorded at 25°C. The residual water signal was suppressed by presaturation during the repetition delay of 1.5 s. Phase-sensitive proton NOESY spectra (120 and 220 ms mixing time) in H2O buffer were collected at 5°C, using a ‘jump and return’ pulse sequence as the reading pulse (28). NMR data were processed and analyzed using Felix (Accelrys Inc., San Diego, CA, USA) running on Silicon Graphics workstations. Two-dimensional data sets consisted of 2048 and 300 complex points in the t2 and t1 dimensions, respectively. Shifted sine-bell window functions were used to smooth the time domain data prior to the Fourier transformation. No baseline correction was applied to the frequency spectra.
Refinement of the duplex structure
Restrained MD (rMD) simulations were run on Silicon Graphics computers using X-PLOR 3.1 (29) and an all-atom force field derived from CHARMM (30) with the dielectric constant set to 4 (31). Partial charges on the β-CH2 and γ-CH2 groups of α-OH-PdG were assigned by analogy to deoxyribose 2′-CH2, while those on the α-CHOH group by comparison with deoxyribose C1′-O4′. Partial atomic charges on phosphate groups were not screened, resulting in residues with a net –1 charge. Experimentally derived inter-proton distances were computed with X-PLOR using a full relaxation matrix approach. Briefly, canonical undecamer B-form duplexes having the R or S isomer of α-OH-PdG in the syn conformation were subjected to 1000 steps of energy minimization using a single potential energy function that was proportional to the difference between back-calculated and experimental NOE peak intensities (32). A grid search showed that the best isotropic correlation time (τc) for fitting the experimental NOE volumes to the initial B-form duplex structures was 2.33 ns and this value was subsequently used for back-calculation of NOE peak intensities during computation of interproton distances. At the end of the minimization, interproton distances were extracted from the last set of atom coordinates. Experimental NOE peak intensities were measured with Felix using NOESY spectra in D2O at different (50, 150, 200 and 300 ms) mixing times. Since some NOE peaks related to the central part of the duplex were resolved and stereo specifically assigned to the S or R isomer of α-OH-PdG (see ‘Results’ section), we computed interproton distances specific for each enantiomer. When proton signals of each isomer overlap, a situation found for the first 3 bp at the ends of the duplex, half of the NOE peak intensity was ascribed to each isomer. This 50% split followed the comparison of the C5(H5-H6) and C7(H5-H6) NOE cross-peak intensities that were resolved for each isomer. For the R isomer, 448 distance restraints were enforced during rMD using square-well potential energy functions with boundaries of ±0.6 Å for nonoverlapping cross-peaks present at all mixing times. Distance boundaries of ±0.9 Å were used for distances from NOE peaks observed only in the 300 ms mixing time NOESY or for nonequivalent overlapping peaks. For the S isomer, 460 distance restraints were implemented using similar boundary criteria. Following the NMR data, WC hydrogen bonds were enforced on all undamaged base pairs of the duplex using equilibrium distances taken from crystallographic studies and boundaries of ±0.1 Å. Backbone dihedral angles of the last four residues were restrained using a square-well potential energy function with a range encompassing A- and B-form DNA conformations (Table 2S). Backbone dihedral angles in the (C5-X6-C7)•(G16-C17-G18) segment were not restrained.
Initial duplex structures having the R or S isomer of α-OH-PdG in the syn orientation paired to a protonated cytosine residue were built in InsightII. Prior to the initiation of the molecular dynamics simulations, the initial models were energy minimized to relieve unfavorable interatomic contacts. rMD protocols followed previously reported procedures (33). Briefly, the temperature of the system was increased from its initial value (100, 105, 110, 115 or 120 K) to 500 K during the first 100 ps of rMD, followed by 100 to 120 ps at high temperature. After completion of the high-temperature step, the system was cooled down to 300 K in 100 ps and equilibrated at this temperature for an additional 150 ps of rMD. Interproton distances were enforced with a penalty constant that gradually increased during the heating step of rMD from 10 to 300 kcal/(mol A2) and remained at this value until the end of the simulation. Twenty-five independent α-OH-PdG•dC duplex structures were computed for each adduct isomer by starting rMD at slightly different initial temperatures (100, 105, 110, 115 and 120 K) and using five different time lengths of the high-temperature step (100, 105, 110, 115 and 120 ps). Atomic coordinates at the end of the simulations were energy-minimized generating an ensemble of distance-refined structures that converged to root mean square deviations (RMSDs) <1.1 and <1.3 Å for the S and R isomers, respectively. Structural assemblies were averaged and energy-minimized yielding the isomeric α-OH-PdG•dC duplex models presented here. Identical rMD protocols were used for the refinement of 50 additional structures of the duplex, 25 for each isomer, without protonation of the lesion site at C17. Structures were visualized with Chimera (34) and InsightII (Accelrys Inc., San Diego, CA, USA) and analyzed with Curves (35).
Duplex ‘melting’ experiments
UV thermal denaturation curves were obtained using a CARY100 Bio UV-VIS spectrophotometer equipped with a multicell block temperature regulation unit and a circulation bath for enhanced temperature control (Varian, Inc.). Calibration of the temperature controller performed using a buffer solution and an external thermometer showed that temperature readings were stable and accurate to within 1°C. Initial temperatures were allowed to equilibrate for at least 10 min at 4°C or 80°C, depending upon the experiment, and the rate of temperature variation was set to 0.3°C per minute. Melting temperatures were determined on a sample containing 1 OD260 units of duplex dissolved in 1 ml of 25 mM sodium phosphate buffer containing 100 mM NaCl and 0.5 mM EDTA, for a final sample concentration of 8.3 μM. Duplex melting temperatures were extracted from the first derivative curve using manufacturer's software. The pH dependence of duplex denaturation was investigated in the 4.7–7.3 pH range, with six independent values obtained at each pH and their average taken as the melting temperature.
RESULTS
Nonexchangeable proton spectra
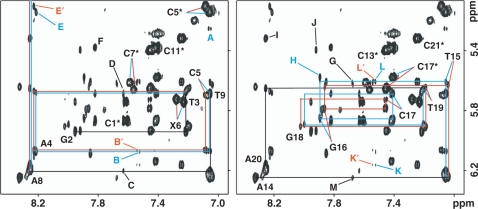
The one-dimensional spectrum of the α-OH-PdG•dC duplex dissolved in D2O phosphate buffer, pH 5.9, at 25°C displays sharp and fairly well-resolved proton signals, indicating that the sample is amenable to NMR structure determination (Figure 1S, Supplementary Data). Assignment of the nonexchangeable proton spectrum follows the analysis of NOESY, COSY and TOCSY spectra using established procedures (36,37). Figures 2 and 2S show expanded regions of a 300 ms mixing time NOESY spectrum depicting interactions between the base (6.96–8.45 p.p.m.) and sugar-H1′ (4.87–6.36 p.p.m.) protons of the duplex. Characteristic of a right-handed helix, each purine-H8 or pyrimidine-H6 proton on the undamaged strand shows NOE peaks to the H1 proton of the same and 5-flanking residues (Figure 2, right panel, and Figure 2S, bottom panel, Supplementary Data). On the lesion-containing strand, the presence of α-OH-PdG breaks these sequential interactions, which are still present on the C1–C5 and C7–C11 stretches of duplex sequence (Figure 2, left panel, and Figure 2S, top panel, Supplementary Data). The intensity of the α-OH-PdG(H8-H1′) NOE interactions is unusually strong (Figure 2, left panel, peaks X6) a fact that establishes a short distance between these protons of the duplex and suggests a syn conformation around the glycosidic angle of the damaged residue. A syn α-OH-PdG readily explains the interruption of sequential NOE interactions at the duplex lesion site. Further evidence of right-handedness on the α-OH-PdG•dC duplex is the interaction between purine-H8 and the 3′-attached cytosine-H5 protons (Figure 2, peaks E–J), and between the sugar-H1′ and the adenine-H2 protons of the duplex (Figure 2, peaks B–D and K–M).
Figure 2.
Duplicate contour plots of the fingerprint region of a 500 MHz NOESY (300 ms mixing time) spectrum recorded at 25°C with the sample dissolved in 10 mM phosphate buffer, pH 5.9, containing 50 mM NaCl and 1 mM EDTA. The figure shows sequential interactions between the purine-H8 or pyrimidine-H6 (6.96–8.45 p.p.m.) and the sugar H1′ (5.07–6.36 p.p.m) protons of the duplex on the lesion containing (left) and unmodified strands (right). Labels indicate intraresidue base-H1′ NOEs and X6 is α-OH-PdG. Blue and red colors differentiate cross-peaks originated from the S and R enantiomers, respectively. Other labels are assigned as follows: A, (S)X6(Hα)-C5(H6); B, A4(H1′)-A20(H2); B′, A4(H1′)-A20(H2); C, A8(H1′)-A8(H2); D, T9(H1′)-A8(H2); E, A4(H8)-C5(H5); E′, A4(H8)-C5(H5); F, G10(H8)-C11(H5); G, G12(H8)-C13(H5); H, G16(H8)-C17(H5); I, A20(H8)-C21(H5); J, G12(H8)-C13(H5); K, A20(H1′)-A20(H2); K′, A20(H1′)-A20(H2); L, C21(H1′)-A20(H2); L′, C21(H1′)-A20(H2); M, A14(H1′)-A14(H2).
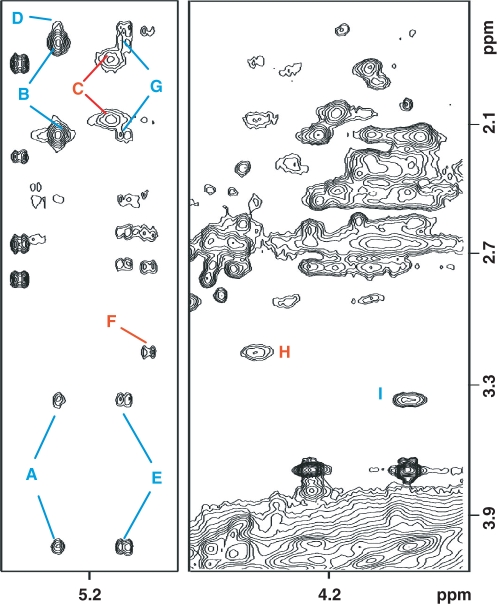
Figure 2 also reveals a peculiar feature of the NOESY spectrum of the α-OH-PdG•dC duplex. From T3 to A8, on the lesion-containing strand, and T15 to T19, on the undamaged strand, the base to H1′ NOEs are split into two peaks of approximately equal intensity (Figure 2). Cross-peak splitting is not limited to the ‘fingerprint’ region of the spectrum but is seen also in other regions of the 100% D2O NOESY spectra (Figure 3) as well as in NOE peaks observed between the exchangeable protons of the duplex (Figures 4 and 3S, Supplementary Data). This duplication of NOE peaks on the center of the duplex originates from the presence of the chiral Cα−atom of α-OH-PdG (Figure 1). Enantiomer specific assignments on the damaged strand are straightforward following the observation of an α-OH-PdG(Hα)-C5(H6) NOE peak (Figure 2, peak A) that, with the adduct in syn, is only possible for the case of the (S)-α-OH-PdG isomer that orients its Hα proton toward the 5′-flanking residue. In contrast, isomer specific assignments on the undamaged strand were only possible after analysis of a NOESY spectrum recorded with the duplex dissolved in 10% D2O buffer, pH 5.9 at 5°C. Under these conditions, we observe well-resolved inter-strand NOEs between the C17 and C5 amino protons (Figure 3S, Supplementary Data, peaks B–C, F–G) which, in turn, can be ascribed to the specific enantiomers by their interaction with the vicinal C(H5) protons (Figure 3S, Supplementary Data, peaks D and H for C17 and K for C5).
Figure 3.
Expanded contour plots of regions of a 500 MHz NOESY (300 ms mixing time) spectrum recorded at 25°C with the sample dissolved in phosphate buffer pH 5.9 (10 mM phosphate, 50 mM NaCl and 1 mM EDTA), depicting interactions of the exocyclic α-OH-PdG protons. Blue and red labels differentiate NOE peaks originated from the S and R enantiomers, respectively. Labels are assigned as follows: A, (S)X6(Hα)-(S)X6(Hγ/γ′); B, (S)X6(Hα)-(S)X6(Hβ/β′); C, (R)X6(Hα)-(R)X6(Hβ/β′); D, (S)X6(Hα)-C5(H2′); E, C5(H5)- (S)X6(Hγ/γ′); F, C5(H5)- (R)X6(Hγ); G, C5(H5)- (S)X6(Hβ/β′); H, (R)X6(Hγ)-(R)X6(Hγ′); I, (S)X6(Hγ)-(S)X6(Hγ′). The β and γ protons of α-OH-PdG were not stereo specifically assigned.
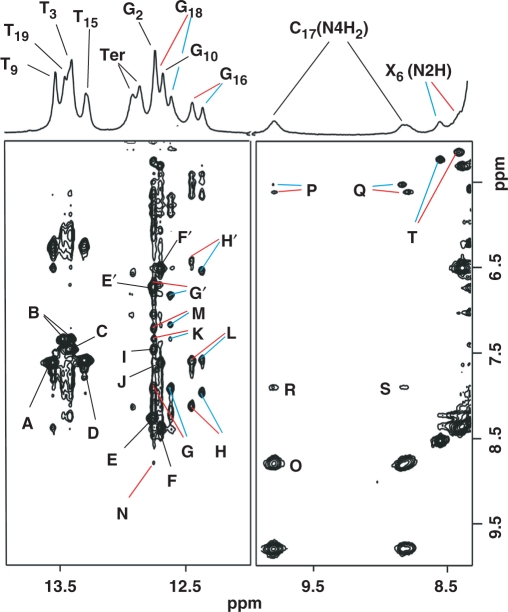
Figure 4.
Top: expanded region (8.3–13.9 p.p.m.) of a 1D-proton spectrum recorded at 5°C with the sample dissolved in 10% D2O phosphate buffer pH 5.9 (10 mM phosphate, 50 mM NaCl and 1 mM EDTA). The WC Imino proton signals are labeled in the figure with TER indicationg those belonging to terminal base pairs. Bottom: expanded regions of a NOESY (220 ms mixing time) spectrum recorded under identical conditions, displaying NOE interactions of the exchangeable protons of the α-OH-PdG•dC duplex. Blue and red lines differentiate NOE peaks originated from the S and R enantiomers, respectively. Labeled peaks are assigned as follows: A, T9(N3H)-A14(H2); B, T19(N3H)-A4(H2); C, T3(N3H)-A20(H2); D, T15(N3H)-A8(H2); E, G2(N1H)-C21(N4H)hb; E′, G2(N1H)-C21(N4H)nhb; F, G10(N1H)-C13(N4H)hb; F′, G10(N1H)-C13(N4H)nhb; G, G18(N1H)-C5(N4H)hb; G′, G18(N1H)-C5(N4H)nhb; H, G16(N1H)-C7(N4H)hb; H′, G16(N1H)-C7(N4H)nhb; I, G2(N1H)-A20(H2); J, G10(N1H)-A14(H2); K, G18(N1H)-A4(H2); L, G16(N1H)-A8(H2); M, G18(N1H)-X6(H8); N, G18(N1H)-C17(N4H)hb; O, C17(N4H)hb-C17(N4H)nhb; P, C17(N4H)hb-C17(H5); Q, C17(N4H)nb-C17(H5); R, C17(N4H)hb-C5(N4H)hb; S, C17(N4H)nhb-C5(N4H)hb; T, X6(N2H)-X6(Hα). Hb and nhb differentiate the hydrogen bonded and nonhydrogen-bonded cytosine amino protons.
Assignment of the exocyclic protons of α-OH-PdG results from analysis of a different region of the same 300 ms mixing time NOESY spectrum (Figure 3). The signal at 5.27 p.p.m. that shows an NOE peak with C5(H6) (Figure 2, peak A) displays strong and weak interactions to the β (vicinal) and γ protons respectively, within the OH-propyl ring of the S isomer (Figure 3, peaks B and A, respectively). In the R enantiomer, the Hα proton shows a pair of strong but broad NOE cross-peaks with the vicinal β protons (Figure 3, peaks C), providing the assignment of these protons of the adduct and revealing differences in local dynamics between both isomers. At the same time, the γ protons exhibit a strong but broad NOE peak, completing the assignments of (R) α-OH-PdG (Figure 3, peak H). Examination of a TOCSY spectrum recorded under identical conditions subsequently confirmed these assignments (Figure 4S, Supplementary Data). In addition to the intra-residue NOEs, Figure 3 displays several cross-peaks between the protons of α-OH-PdG and the 5′-flanking C5 residue (Figure 3, peaks D–G), which helped during the refinement of the solution structure. Nonexchangeable proton chemical shifts of the α-OH-PdG•dC duplex are listed in Table 1S (Supplementary Data).
Table 1.
Statistics of the refinement and structural parameters of α-OH-PdG•dC+ duplexesa
| R-isomer | S-isomer | |
|---|---|---|
| Distance and geometry violations | ||
| RMSD NOE-violations (Å) | 0.022 | 0.023 |
| Number of distance violations >0.1 Å | 6 | 6 |
| RMSD bond lengths (Å) | 0.009 | 0.01 |
| RMSD bond angles (°) | 3.1 | 3.0 |
| Van der Waals energy (Kcal/mol) | −326 | −331 |
| Lesion site hydrogen bonding | ||
| α-OH-PdG(N2H-O2P) distance (Å)/N2-H2-O2P angle (°) | 1.90/162 | 1.97/175 |
| α-OH-PdG(Hα-O2P) distance (Å)/Oα-Hα-O2P angle (°) | 2.07/163 | 4.83/84 |
| α-OH-PdG(O6)-C17+(N4H) distance (Å)/O6-N4H-N4 angle (°) | 2.90/107 | 1.93/127 |
| α-OH-PdG(N7)-C17+(N3H) distance (Å)/N7-N3H-N3 angle (°) | 2.36/132 | 2.72/147 |
| α-OH-PdG(N7)-C17+(N4H) distance (Å)/N7-N4H-N4 angle (°) | 2.18/142 | 3.70/131 |
aAveraged values computed from the 25 refined structures. Chi torsion angles of α-OH-PdG in the refined R and S isomer models were 65° and 83°, respectively
Exchangeable proton spectra
The 500-MHz one-dimensional proton spectrum, recorded at 5°C in 10% D2O buffer solution, pH 5.9, shows eleven partially resolved signals in the 13.90–12.00 p.pm. range that account for all the imino protons of the duplex (Figure 4, top). Assignment of the imino protons follows the analysis of a NOESY (220 ms mixing time) spectrum recorded under the same conditions. Thymine imino protons exhibit strong NOE peaks from their interaction with H2 protons of the adenine counter base (Figure 4, peaks A–D) just as guanine imino protons interact with the hydrogen-bonded and exposed protons of their cytosine partners (Figure 4, peaks E/E′-H/H′). Taken together, these observations establish regular WC base pair alignments for undamaged base pairs in the α-OH-PdG•dC duplex. As in the case of the NOESY spectra collected in 100% D2O buffer, the chiral center of α-OH-PdG causes splitting of proton signals at or near the lesion site. There are several sequential NOE cross-peaks between the adenine H2 and guanine H1 protons (Figure 4, peaks I–L) and between the imino protons of adjacent base pairs (Figure 5S, Supplementary Data), indicating proper base pair stacking throughout the α-OH-PdG•dC duplex. In addition to these interactions that are regularly seen in the water NOESY spectrum of unmodified duplexes, α-OH-PdG(H8) shows NOE peaks with G18(H1) of the 5′-flanking G•C base pair (Figure 4, peak M), further confirming the syn conformation adopted by the damaged residue and suggesting proper base pair stacking at the lesion site of the duplex. The amino protons of the lesion partner C17 are readily identified by a strong geminal NOE peak (Figure 4, peak O) and the weaker interactions with C17(H5) within the pyrimidine ring (Figure 4, peaks P and Q). In addition, they show NOE peaks to the hydrogen-bonded C5(N4H) proton and G18(H1) (Figure 4, peaks R, S and N), further supporting base pair stacking at the lesion site of the duplex.
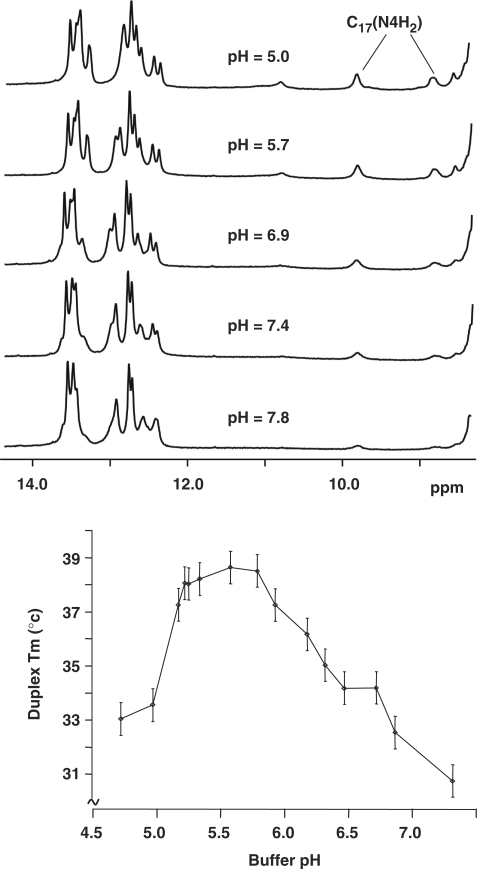
Figure 5.
Top, pH dependence of the exchangeable proton spectrum recorded at 5°C with the α-OH-PdG•dC duplex dissolved in phosphate buffer pH 5.9 (10 mM phosphate, 50 mM NaCl and 1 mM EDTA). Bottom, pH dependence of the melting temperature of the α-OH-PdG•dC duplex.
At 9.78 and 8.79 p.p.m., the chemical shift of C17 amino protons are notably downfield from the 8.0–8.5 (hydrogen bonded) and 6.0–6.5 p.p.m. (exposed) range normally observed for cytosine residues. These downfield values are entirely consistent with protonation of the cytosine counter base. As shown in Figure 5, increasing the buffer pH gradually reduces the intensity of the C17 amino proton signals while acidifying the sample below 5.7 seems to have little effect (Figure 5, top panel). However, no signal was detected in the 15–20 p.p.m. range that could be assigned to the C17+(H3) proton. The pH dependence of the duplex melting temperature shows the highest Tm value in the 5.2–5.9 pH range (Figure 5, bottom panel), suggesting that C17 protonation increases the thermal stability of the damaged duplex, most likely by inducing the formation of a hydrogen bond across the α-OH-PdG(syn)•dC+ base pair. Taken together, these observations indicate that C17+(H3) is involved in hydrogen bonding but cannot be detected in the NMR spectra, probably due to its fast solvent exchange. Exchangeable proton chemical shifts of the α-OH-PdG•dC duplex are also listed in Table 1S (Supplementary Data).
α-OH-PdG•dC duplex structures
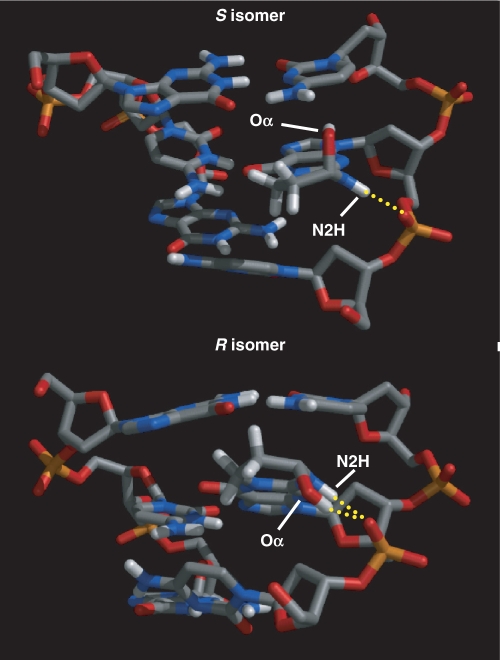
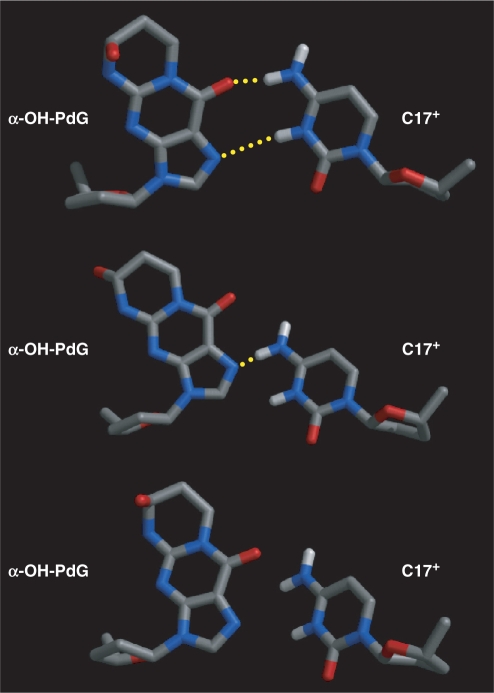
Figures 6 and 6S (Supplementary Data) show different views of the R and S α-OH-PdG•dC duplexes obtained after 450 ps of rMD. The refined structures are in excellent agreement with the experimental NMR constraints, having no interproton distance violations >0.3 Å and six violations >0.1 Å that cause only minor distortions of the atom covalent geometry (Table 1). The structures are very similar, having all-atom RMSD values of 0.95 Å for the whole duplex, 0.97 Å at the duplex lesion site (central three base pairs) and 0.80 Å for the undamaged six base pairs after excluding the lesion site and terminal bases. Both duplexes adopt regular right-handed helical structures mildly distorted at their centers by the presence of α-OH-PdG. The glycosidic torsion angle (χ) of all undamaged residues reveals an anti orientation while sugar conformations appear in the C1′-exo/C2′-endo range and standard WC alignments are preserved in nondamaged base pairs of the duplex. At the lesion site, the χ torsion angle of α-OH-PdG is syn, placing the exocyclic 1,N2-hydroxylpropyl ring in the major groove of the duplex with its Hoogsteen edge facing the protonated C17+ counter base. Figure 7 displays closer views of the structure at the lesion site revealing a network of hydrogen bonds that stabilizes the syn conformation of the adduct χ torsion angle. There is a well-formed hydrogen bond between α-OH-PdG(N2H) and a backbone phosphate oxygen that is present in the refined structure of both isomers. An additional hydrogen bond between α-OH-PdG(OH) and the same phosphate forms only with the R isomer of the adduct, which directs its OH group toward the 5′-end of the nucleotide (Figure 7). In addition to these intraresidue hydrogen bonds, the Hoogsteen edge of α-OH-PdG can form different hydrogen bonds with its partner base C17. These interactions, however, are somehow unstable during rMD, forming and breaking during the course of the simulation and, in some cases, being absent from the final refined model. On the other hand, hydrogen bonding occurs more often with the S isomer and, expectedly, on simulations performed with a protonated C17+ residue. Figure 8 displays different refined structures having two, one or no hydrogen bonds across the lesion-containing base pair. Two well-formed hydrogen bonds connecting α-OH-PdG(O6)-C17+(N4H) and α-OH-PdG(N7)-C17+(H3) occur in about one half of the MD simulations performed with a C17+ residue (Figure 8, top). In the presence of a nonprotonated C17 residue, structures having similar alignment with just one hydrogen bond between α-OH-PdG(O6)-C17(N4H) occur only once with the S isomer. On the other hand, a quarter of the C17+ refinements and one half of the nonprotonated C17 simulations yield models with a single α-OH-PdG(N7)-C17(N4H) hydrogen bond. Formation of this hydrogen bond correlates with a small displacement of C17 toward the minor groove of the duplex and partial loss of co-planarity in the α-OH-PdG•dC base pair (Figure 8, middle). Structures lacking hydrogen bonds also occur and show a complete loss of co-planarity across the base pair of the lesion (Figure 8, bottom). Interestingly, models with a single hydrogen bond between α-OH-PdG(O6)-C17+(H3) were never observed in the refined models. Statistics of the refinement and relevant structural parameters of the α-OH-PdG•dC duplexes are listed in Table 1.
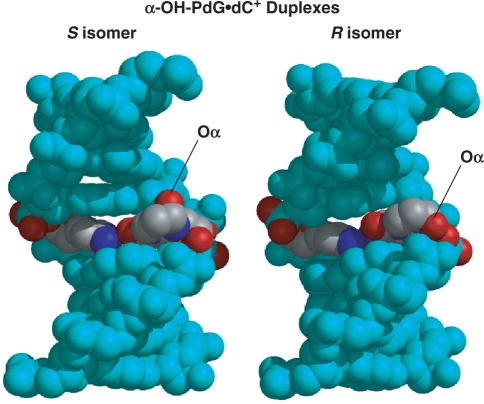
Figure 6.
Three-dimensional structures of the isomeric α-OH-PdG•dC duplexes. The figure shows space-filled models seen with the major groove prominent, the damaged base pairs colored by atom type, and the Oα atoms labeled in the figure.
Figure 7.
Close-up view of the central three base pair fragment depicting hydrogen-bonding interactions that stabilize the syn conformation of α-OH-PdG.
Figure 8.
Characteristic hydrogen-bonding patterns observed for the α-OH-PdG•dC base pair in the refined structures. In all three alignments, the major groove of the duplex is toward the top of the base pair.
DISCUSSION
NMR spectra of the α-OH-PdG•dC duplex
The sequential interactions detected on the NOESY spectrum recorded at 25°C (Figure 2 and 2S, Supplementary Data) along with the interstrand NOE peaks observed across undamaged base pairs of the duplex (Figure 4) demonstrate that the α-OH-PdG•dC duplex adopts a regular right-handed helical conformation stabilized by the formation of WC base pairs. Further support for a regular B-form DNA helix is the observation of NOE peaks between C(H5) and the base proton of its 5′-flanking residue and between A(H2) and neighboring sugar-H1′ protons (Figure 2). Similarly, NOE connectivities between sequential imino protons (Figure 5S, Supplementary Data), and between imino and amino and A(H2) protons of sequential base pairs (Figure 4) indicate that the α-OH-PdG•dC duplex preserves normal base pairing throughout. The presence of the acrolein lesion manifests itself by the split nature of the NMR signals from residues located at and near the damaged site (Figures 2–4), indicating that α-OH-PdG conserves the exocyclic ring form, after pairing to C17, with resonances from the R and S duplexes resolved under the experimental conditions. This observation is in sharp contrast to the case of the isomeric γ-OH-PdG adduct, which undergoes a chemical rearrangement to the open N2-3-oxo-propyl form after pairing to dC, losing by this process its chiral center (25). Chemical shift differences between corresponding protons of the enantiomeric duplexes are very small (Table 1S, Supplementary Data) indicating that both duplexes adopt a similar conformation in solution. This characteristic is very different from that of bulky polycyclic hydrocarbon lesions, where the chirality of the adduct linkage carbon profoundly affects the NMR spectra and solution structure of the damaged duplex (38) or the related crotonaldehyde-N2-dG lesion, which preferentially forms interstrand cross-links in the case of the R isomer (39).
The NOESY spectra in 100% D2O buffer reveal very strong NOE cross-peaks between the H8 and H1′ protons of α-OH-PdG (Figure 2, peak X6), indicating that the distance between them is short and suggesting a syn conformation around the χ torsion angle of α-OH-PdG. The NOE cross-peaks between α-OH-PdG(Hα)-C5(H6) (Figure 2, peak A), α-OH-PdG(Hγ/γ′)-C5(H5) (Figure 3, peaks E and F) and α-OH-PdG(H8)-G18(N1H) (Figure 4, peak M) protons, which are far apart (>5 Å) in canonical B-form DNA, independently confirm the syn conformation of the damaged residue. The χ rotation from anti to syn not only relieves any steric clashing that would exist across the α-OH-PdG-containing base pair, but also allows hydrogen bond interactions with the Hoogsteen edge of the lesion. Analysis of the exchangeable proton spectra shows that C17 amino protons have chemical shift differences of about 1 p.p.m. (Figure 4 and Table 1S) indicating that one of them is hydrogen bonded, a fact later supported by the refined three-dimensional structure. Incidentally, the chemical shift of C17 amino protons is clearly downfield from the value observed for other cytosine residues of the duplex. NMR studies reported similar chemical shift values for the amino protons of C+ residues on G•CC+ triplets at pH 5.5 (40,41) and on the εdG•dC+ base pair at pH 5.2 (42), suggesting protonation of the α-OH-PdG counter base at pH 5.9 with the possible formation of an additional hydrogen bond across the damaged base pair. The observation that the thermal stability of the duplex is highest in the 5.2–5.9 pH range provides independent support for the existence of such a hydrogen bond. We failed, however, to detect the NMR signal of the C17+ imino proton suggesting that it must be in rapid exchange with solvent.
Structure of α-OH-PdG•dC duplexes
The NMR-derived duplex structures show that the presence of α-OH-PdG causes only small perturbations of the regular right-handed helix (Figure 6). After adopting a syn conformation for the glycosidic torsion angle, the exocyclic ring of α-OH-PdG locates in the duplex major groove, where there is enough room to accommodate the OHα group without causing further perturbations of the structure (Figures 6 and 6S). As a result, the chirality of α-OH-PdG lesion is structurally inconsequential. This is in sharp contrast to the case of benzo[a]pyrene-dG lesions where chirality induces vastly diverse conformations, as different as minor-groove-aligned or duplex-intercalated structures (38), or that of the related crotonaldehyde adducts, where one isomer preferentially forms interstrand cross-links (39).
A well-formed hydrogen bond between α-OH-PdG(N2H) and a backbone phosphate oxygen stabilizes the syn conformation of the χ torsion angle of the damaged residue in both isomers (Figure 7). Although direct spectroscopic evidence for this hydrogen bond is lacking, the chemical shift of α-OH-PdG(N2H) at 8.53 and 8.42 p.p.m. (Figure 4, Table 1S, Supplementary Data) supports the involvement of this proton in hydrogen bonding, giving credence to the refined structures. The R α-OH-PdG isomer can further stabilize the syn conformation of the lesion by formation of an additional hydrogen bond between α-OH-PdG(OHα and the same phosphate oxygen (Figure 7). This enantiomer-specific characteristic may explain the small differences in dynamics between the isomers, manifested by slight broadening of the exocyclic protons of the R α-OH-PdG isomer in the NOESY spectra (Figure 3). However, the exact nature of these dynamic processes is unknown at the present time and its structural consequences, if any, seem minimal. The χ syn conformation positions the Hoogsteen edge of α-OH-PdG for hydrogen bonding with its counter base C17, but these residues have to move closer to engage in hydrogen bonding. On the refined structures, therefore, the average C1′-C1′ distance at the lesion-containing base pair is about 10% shorter than that of canonical pairs and different patterns of hydrogen bonds are present at the lesion site of the duplexes (Figure 8). On average, the duplexes form two hydrogen bonds involving the amino and imino protons of C17+ as donors and the adduct O6 and N7 on the S isomer or only the N7 atom on the R isomer, as acceptors (Table 1). However, these interactions are not very stable and refined structures with one or no hydrogen bonds are present at the end of the simulation. Interestingly in both cases, C17+ starts losing co-planarity with α-OH-PdG, moving towards the minor groove of the duplex and partially explaining the fast solvent exchange of the C17+(N3H) proton.
Previous studies have determined the structure of duplex DNA containing 1,N2-propano-dG (PdG) an acrolein lesion analog that lacks the OH substituent. When A•T pairs flanked the PdG adduct, the lesion adopts a syn conformation and pairs to a C+ residue without disrupting WC alignments of neighboring base pairs, adopting a structure that is very similar to the one described here. However, the former duplex needed stronger acid conditions, pH 5.2, for the formation of a PdG•C+ base pair (43), which underlines the role of the α-OH group in stabilizing the syn conformation of the lesion. In contrast, not only the PdG of the lesion-containing base pair but also the guanosine residue of the 3′-flanking base pair adopt a syn orientation and form protonated Hoogsteen base pairs at pH 5.8 when the adduct is located in a (C X C) sequence (44). The duplex structures presented here show α-OH-PdG and its 3′-flanking dG residue relatively close in space but with enough room for the latter to adopt a syn conformation without causing steric clashes. In addition, these residues lack any specific interaction that could explain retaining the 3′-flanking dG in the anti orientation. Although the cause for this difference is currently unknown, it is evident that PdG does not model α-OH-PdG in the (C X C) context.
Biological implications of α-OH-PdG structures
In contrast to its positional isomer γ-OH-PdG that is not mutagenic in human cells, α-OH-PdG extensively blocks DNA replication and, when bypassed by trans-lesion synthesis, mostly codes for dC incorporation, along with G → T and G → A base substitution mutations (24). In vitro primer extension studies using Y-family DNA polymerases showed that Polη and Polκ might catalyze mutagenic replication across α-OH-PdG, while Rev1 and Polτ would mediate accurate lesion replication, with the latter polymerase incorporating dA and T at lower frequency (45). The X-ray structure of a Rev1/PdG-DNA/dCTP complex has the modified residue evicted into a small hydrophobic cavity while the incoming dCTP is in the enzyme active site forming two hydrogen bonds with an arginine residue, thus explaining the property of Rev1 for incorporation of dCTP exclusively (46). Importantly, there was enough room in the hydrophobic cavity to accommodate the OH group of OH-PdG, suggesting that a similar structural intermediate would occur with the acrolein lesion. Polι, on the other hand, can catalyze incorporation of any dNTP during trans-lesion synthesis, presumably by hydrogen bonding the incoming nucleotide with the Hoogsteen face of a syn template residue (47). The structure reported here identified lesion specific bonds that would keep α-OH-PdG in the syn conformation at the replication fork of Polι, helping the formation of the non-mutagenic α-OH-PdG(syn)•dC replication intermediate. In principle, incoming dTTP or dATP may form similar α-OH-PdG(syn)•dA and α-OH-PdG(syn)•T base pair alignments, explaining the error-prone bypass of α-OH-PdG by Polι. An investigation into the structure of such mutagenic intermediates in duplex DNA is currently underway.
SUPPLEMENTARY DATA
Supplementary Data are available at NAR Online.
FUNDING
National Institutes of Health (CA47995 and CA77094). Funding for open access charge: National Institutes of Health (CA47995).
Conflict of interest statement. None declared.
Supplementary Material
REFERENCES
- 1.Izard C, Libermann C. Acrolein. Mutat. Res. 1978;47:115–138. doi: 10.1016/0165-1110(78)90016-7. [DOI] [PubMed] [Google Scholar]
- 2.Roemer E, Stabbert R, Rustemeier K, Veltel DJ, Meisgen TJ, Reininghaus W, Carchman RA, Gaworski CL, Podraza KF. Chemical composition, cytotoxicity and mutagenicity of smoke from US commercial and reference cigarettes smoked under two sets of machine smoking conditions. Toxicology, 2004;195:31–52. doi: 10.1016/j.tox.2003.08.006. [DOI] [PubMed] [Google Scholar]
- 3.Zhang S, Villalta PW, Wang M, Hecht SS. Detection and quantitation of acrolein-derived 1,N2-propanodeoxyguanosine adducts in human lung by liquid chromatography-electrospray ionization-tandem mass spectrometry. Chem Res. Toxicol. 2007;20:565–571. doi: 10.1021/tx700023z. [DOI] [PMC free article] [PubMed] [Google Scholar]
- 4.Lee Y, Sayre LM. Reaffirmation that metabolism of polyamines by bovine plasma amine oxidase occurs strictly at the primary amino termini. J. Biol. Chem. 1998;273:19490–19494. doi: 10.1074/jbc.273.31.19490. [DOI] [PubMed] [Google Scholar]
- 5.Esterbauer H, Schaur RJ, Zoller H. Chemistry and biochemistry of 4-hydroxynonenal, malonaldehyde and related aldehydes. Free Rad. Biol. Med. 1991;11:81–128. doi: 10.1016/0891-5849(91)90192-6. [DOI] [PubMed] [Google Scholar]
- 6.Wu H-Y, Lin Y-L. Determination of aldehydic lipid peroxidation products with dabsylhydrazine by high-performance liquid chromatography. Anal. Chem. 1995;76:1603–1612. [Google Scholar]
- 7.Chung FL, Nath RG, Nagao M, Nishikawa A, Zhou GD, Randerath K. Endogenous formation and significance of 1,N2-propanodeoxyguanosine adducts. Mutat. Res. 1999;242:71–81. doi: 10.1016/s0027-5107(99)00009-3. [DOI] [PubMed] [Google Scholar]
- 8.Alarcon RA. Studies on the in vivo formation of acrolein: 3-hydroxy-propylmercapturic acid as an index of cyclophosphamide (NSC-26271) activation. Cancer Treat. Rep. 1976;60:327–335. [PubMed] [Google Scholar]
- 9.McDiarmid MA, Iype PT, Kolodner K, Jacobson-Kram D, Strickland PT. Evidence for acrolein-modified DNA in peripheral blood leukocytes of cancer patients treated with cyclophosphamide. Mutat. Res. 1991;248:93–99. doi: 10.1016/0027-5107(91)90091-2. [DOI] [PubMed] [Google Scholar]
- 10.Galliani G, Pantarotto C. The reaction of guanosine and 2′-deoxyguanosine with acrolein. Tetrahedron Lett. 1983;24:4491–4492. [Google Scholar]
- 11.Chung FL, Young R, Hecht SS. Formation of cyclic 1,N2-propanodeoxyguanosine adducts in DNA upon reaction with acrolein or crotonaldehyde. Cancer Res. 1984;44:990–995. [PubMed] [Google Scholar]
- 12.Uchida K, Kanematsu M, Sakai K, Matsuda T, Hattori N, Mizuno Y, Suzuki D, Miyata T, Noguchi N, Niki E, et al. Protein-bound acrolein: potential markers for oxidative stress. Proc. Natl Acad. Sci. USA. 1998;95:4882–4887. doi: 10.1073/pnas.95.9.4882. [DOI] [PMC free article] [PubMed] [Google Scholar]
- 13.Marnett LJ, Hurd HK, Hollstein MC, Levin DE, Esterbauer H, Ames BN. Naturally occurring carbonyl compounds are mutagens in Salmonella tester strain TA104. Mutat. Res. 1985;148:25–34. doi: 10.1016/0027-5107(85)90204-0. [DOI] [PubMed] [Google Scholar]
- 14.Curren RD, Yang LL, Conklin PM, Grafstrom RC, Harris CC. Mutagenesis of xeroderma pigmentosum fibroblast by acrolein. Mutat. Res. 1988;209:17–22. doi: 10.1016/0165-7992(88)90104-2. [DOI] [PubMed] [Google Scholar]
- 15.Smith RA, Cohen SM, Lawson TA. Acrolein mutagenicity in the V79 assay. Carcinogenesis. 1990;11:497–498. doi: 10.1093/carcin/11.3.497. [DOI] [PubMed] [Google Scholar]
- 16.Kawanishi M, Matsuda T, Nakayama A, Takebe H, Matsui S, Yagi T. Molecular analysis of mutations induced by acrolein in human fibroblast cells using supF shuttle vector plasmids. Mutat. Res. 1998;417:63–75. doi: 10.1016/s1383-5718(98)00093-x. [DOI] [PubMed] [Google Scholar]
- 17.Khullar S, Varaprasad CV, Johnson F. Postsynthetic generation of a major acrolein adduct of 2′-deoxyguanosine in oligomeric DNA. J. Med. Chem. 1999;42:947–950. doi: 10.1021/jm980605u. [DOI] [PubMed] [Google Scholar]
- 18.Nechev LV, Harris CM, Harris TM. Synthesis of nucleosides and oligonucleotides containing adducts of acrolein and vinyl chloride. Chem. Res. Toxicol. 2000;13:421–429. doi: 10.1021/tx990167+. [DOI] [PubMed] [Google Scholar]
- 19.Nechev LV, Kozekov ID, Brock AK, Rizzo CJ, Harris TM. DNA adducts of acrolein: site-specific synthesis of an oligodeoxynucleotide containing 6-Hydroxy-5,6,7,8-tetrahydropyrimido[1,2-a]purin-10(3H)-one, an acrolein adduct of guanine. Chem. Res. Toxicol. 2002;15:607–613. doi: 10.1021/tx010181y. [DOI] [PubMed] [Google Scholar]
- 20.Huang Y, Torres MC, Iden CR, Johnson F. Synthesis of the minor acrolein adducts of 2(′)-deoxyguanosine and their generation in oligomeric DNA. Bioorg Chem. 2003;31:136–148. doi: 10.1016/s0045-2068(02)00525-4. [DOI] [PubMed] [Google Scholar]
- 21.Yang I-Y, Hossain M, Miller H, Khullar S, Johnson F, Grollman A, Moriya M. Responses to the major acrolein-derived deoxyguanosine adduct in Escherichia coli. J. Biol. Chem. 2001;276:9071–9076. doi: 10.1074/jbc.M008918200. [DOI] [PubMed] [Google Scholar]
- 22.Vander Veen LA, Hashim MF, Nechev LV, Harris TM, Harris CM, Marnett LJ. Evaluation of the mutagenic potential of the principal DNA adduct of acrolein. J. Biol. Chem. 2001;276:9066–9070. doi: 10.1074/jbc.M008900200. [DOI] [PubMed] [Google Scholar]
- 23.Yang I-Y, Johnson F, Grollman AP, Moriya M. Genotoxic mechanism for the major acrolein-derived deoxyguanosine adduct in human cells. Chem. Res. Toxicol. 2002;15:160–164. doi: 10.1021/tx010123c. [DOI] [PubMed] [Google Scholar]
- 24.Yang I-Y, Chan G, Miller H, Huang Y, Torres MC, Johnson F, Moriya M. Mutagenesis by acrolein-derived propanodeoxyguanosine adducts in human cells. Biochemistry. 2002;41:13826–13832. doi: 10.1021/bi0264723. [DOI] [PubMed] [Google Scholar]
- 25.de los Santos C, Zaliznyak T, Johnson F. NMR Characterization of a DNA duplex containing the major acrolein-derived deoxyguanosine adduct γ-OH-1,N2-propano-2′-deoxyguanosine. J. Biol. Chem. 2001;276:9077–9082. doi: 10.1074/jbc.M009028200. [DOI] [PubMed] [Google Scholar]
- 26.Stone MP, Cho YJ, Huang H, Kim HY, Kozekov ID, Kozekova A, Wang H, Minko IG, Lloyd RS, Harris TM, et al. Interstrand DNA cross-links induced by alpha,beta-unsaturated aldehydes derived from lipid peroxidation and environmental sources. Acc. Chem. Res. 2008;41:793–804. doi: 10.1021/ar700246x. [DOI] [PMC free article] [PubMed] [Google Scholar]
- 27.States DJ, Habekorn RA, Ruben DJ. A two-dimensional nuclear overhauser experiment with pure absorption phase in four quadrants. J. Mag. Res. 1982;48:286–292. [Google Scholar]
- 28.Plateau P, Gueron M. Exchangeable proton NMR without base-line distortion using new strong-pulse sequences. J. Am. Chem. Soc. 1982;104:7310–7311. [Google Scholar]
- 29.Brünger A. XPLOR Version 3.1 A System for X-Ray Crystallography and NMR. New Haven, CT: Yale University Press; 1993. [Google Scholar]
- 30.Brooks BR, Buccoleri RE, Olafson BD, States DJ, Swaminathan S, Karplus M. CHARMM: a program for macromolecular energy, minimization, and dynamics calculations. J. Comput. Chem. 1983;4:187–217. [Google Scholar]
- 31.Friedman RA, Honig B. The electrostatic contribution to DNA base-stacking interactions. Biopolymers. 1992;32:145–159. doi: 10.1002/bip.360320205. [DOI] [PubMed] [Google Scholar]
- 32.Yip P, Case DA. A new method for refinement of macromolecular structures based on nuclear overhauser effect spectra. J. Magn. Reson. 1989;83:643–648. [Google Scholar]
- 33.Zaliznyak T, Bonala R, Johnson F, de los Santos C. Structure and stability of DNA containing the 3-(deoxyguanosin-N(2)-yl)-2-acetylaminofluorene (dG-N2-AAF) lesion: a bulky adduct that persists in cellular DNA. Chem. Res. Toxicol. 2006;19:745–752. doi: 10.1021/tx060002i. [DOI] [PubMed] [Google Scholar]
- 34.Pettersen EF, Goddard TD, Huang CC, Couch GS, Greenblatt DM, Meng EC, Ferrin TE. “UCSF chimera – a visualization system for exploratory research and analysis”. J. Comput. Chem. 2004;25:1605–1612. doi: 10.1002/jcc.20084. [DOI] [PubMed] [Google Scholar]
- 35.Lavery R, Sklenar H. The definition of generalized helicoidal parameters and of axis curvature for irregular nucleic acids. J. Biomol. Struct. Dyn. 1988;6:655–667. doi: 10.1080/07391102.1988.10506483. [DOI] [PubMed] [Google Scholar]
- 36.van de Ven FJM, Hilbers CW. Nucleic acids and nuclear magnetic resonance. Eur. J. Biochem. 1988;178:1–38. doi: 10.1111/j.1432-1033.1988.tb14425.x. [DOI] [PubMed] [Google Scholar]
- 37.de los Santos C. Probing DNA atructure by NMR spectroscopy. In. In: Kool E, editor. Comprehensive Natural Products Chemistry. Vol. 7. Oxford: Elsevier Science Ltd; 1999. pp. 55–80. [Google Scholar]
- 38.Geacintov NE, Cosman M, Hingerty BE, Amin S, Broyde S, Patel DJ. NMR solution structures of stereoisometric covalent polycyclic aromatic carcinogen-DNA adduct: principles, patterns, and diversity. Chem. Res. Toxicol. 1997;10:111–146. doi: 10.1021/tx9601418. [DOI] [PubMed] [Google Scholar]
- 39.Kozekov ID, Nechev LV, Moseley MS, Harris CM, Rizzo CJ, Stone MP, Harris TM. DNA interchain cross-links formed by acrolein and crotonaldehyde. J. Am. Chem. Soc. 2003;125:50–61. doi: 10.1021/ja020778f. [DOI] [PubMed] [Google Scholar]
- 40.de los Santos C, Rosen M, Patel D. NMR studies of DNA (R+)n.(Y-)n.(Y+)n triple helices in solution: imino and amino proton markers of T.A.T and C.G.C+ base-triple formation. Biochemistry. 1989;28:7282–7289. doi: 10.1021/bi00444a021. [DOI] [PubMed] [Google Scholar]
- 41.Sklenár V, Feigon J. Formation of a stable triplex from a single DNA strand. Nature. 1990;345:836–838. doi: 10.1038/345836a0. [DOI] [PubMed] [Google Scholar]
- 42.Shanmugam G, Kozekov ID, Guengerich FP, Rizzo CJ, Stone MP. Structure of the 1,N2-ethenodeoxyguanosine adduct opposite cytosine in duplex DNA: Hoogsteen base pairing at pH 5.2. Chem. Res. Toxicol. 2008;21:1795–1805. doi: 10.1021/tx8001466. [DOI] [PMC free article] [PubMed] [Google Scholar]
- 43.Weisenseel JP, Reddy GR, Marnett LJ, Stone MP. Structure of and oligodeoxynucleotide containing a 1,N(2)-propanodeoxyguanosine adduct positioned in a palindrome derived from the Salmonella typhimurium hisD3052 gene: Hoogsteen pairing at pH 5.2. Chem. Res. Toxicol. 2002;15:127–139. doi: 10.1021/tx0101090. [DOI] [PubMed] [Google Scholar]
- 44.Singh US, Moe JG, Reddy GR, Weisenseel JP, Marnett LJ, Stone MP. 1H NMR of an oligodeoxynucleotide containing a propanodeoxyguanosine adduct positioned in a (CG)3 frameshift hotspot of Salmonella typhimurium hisD3052: Hoogsteen base-pairing at pH 5.8. Chem. Res. Toxicol. 1993;6:825–836. doi: 10.1021/tx00036a012. [DOI] [PubMed] [Google Scholar]
- 45.Sanchez AM, Minko IG, Kurtz AJ, Kanuri M, Moriya M, Lloyd RS. Comparative evaluation of the bioreactivity and mutagenic spectra of acrolein-derived alpha-HOPdG and gamma-HOPdG regioisomeric deoxyguanosine adducts. Chem. Res. Toxicol. 2003;16:1019–1028. doi: 10.1021/tx034066u. [DOI] [PubMed] [Google Scholar]
- 46.Deepak T, Nair DT, Johnson RE, Prakash L, Prakash S, Aggarwal AK. Protein-template-directed synthesis across an acrolein-derived DNA adduct by yeast Rev1 DNA polymerase. Structure. 2008;16:239–245. doi: 10.1016/j.str.2007.12.009. [DOI] [PubMed] [Google Scholar]
- 47.Nair DT, Johnson RE, Prakash S, Prakash L, Aggarwal AK. Replication by human DNA polymerase-ι occurs by Hoogsteen base-pairing. Nature. 2004;430:377–380. doi: 10.1038/nature02692. [DOI] [PubMed] [Google Scholar]
Associated Data
This section collects any data citations, data availability statements, or supplementary materials included in this article.


