


Abstract
COTRASIF is a web-based tool for the genome-wide search of evolutionary conserved regulatory regions (transcription factor-binding sites, TFBS) in eukaryotic gene promoters. Predictions are made using either a position-weight matrix search method, or a hidden Markov model search method, depending on the availability of the matrix and actual sequences of the target TFBS. COTRASIF is a fully integrated solution incorporating both a gene promoter database (based on the regular Ensembl genome annotation releases) and both JASPAR and TRANSFAC databases of TFBS matrices. To decrease the false-positives rate an integrated evolutionary conservation filter is available, which allows the selection of only those of the predicted TFBS that are present in the promoters of the related species’ orthologous genes. COTRASIF is very easy to use, implements a regularly updated database of promoters and is a powerful solution for genome-wide TFBS searching. COTRASIF is freely available at http://biomed.org.ua/COTRASIF/.
INTRODUCTION
The regulation of gene expression at the transcriptional level is one of the focal research areas of the modern life sciences. The development of high-throughput assays has allowed the generation of voluminous ‘snapshots’ of the cellular state. Converting those snapshots (data) into a full-length movie (knowledge) is not a straightforward transformation. The combination of several appropriate tools is known to yield better results. Adding to the arsenal of available tools, COTRASIF is a genome-wide two-method finder of regulatory elements, with an evolutionary conservation filter.
The control of gene expression relies upon the effects of the transcription factors (TF) bound to specific regulatory elements. Each cell type during specific developmental stages or under the influence of extracellular signal expresses a characteristic set of active TFs. These TFs are able to bind to their specific TF-binding sites (TFBS) in the promoters of the genes, thus activating or repressing the corresponding gene. Experimental identification of TFBS within single-gene promoters is common, but with no prior information this process is both effort- and time-consuming. Computational prediction of TFBS identifies potential targets for further experimental verification and provides self-sufficient data on the gene regulation patterns associated with each specific TF.
The most common way of representing conserved sequences (such as TFBS) is to use consensus strings (built using IUPAC—International Union of Pure and Applied Chemistry—nomenclature). A major drawback of using IUPAC consensus strings is that they contain only a small portion of the information available from the set of initial sequences. Instead, matrix representation is gaining well-earned popularity. The two most common matrices (used to represent TFBS) are (i) position frequency matrix (PFM; also known as position count matrix or position-specific scoring matrix) and (ii) position weight matrix (PWM; also known as nucleotide weight matrix) (1–4). A PFM is a matrix where each position of the identified binding site consists of the frequency of each possible nucleotide. PFMs were first used to characterize DNA-binding site specificity during 1982–1986 (5,6). Later, quantitative discrimination of sites with calculated site similarity scores was introduced, using position weight matrices and information content evaluation of each matrix position (3,7–9). A weight matrix pattern definition is superior to a simple IUPAC consensus sequence, as it represents the complete nucleotide occurrence probabilities for each position. It also allows the quantification of the similarity between the weight matrix and a potential TFBS detected in the target sequence. PWM-derived score of the candidate sequence provides an approximation of the binding energy of the transcription factor to the binding site (3,4). But even the matrix representation is prone to information loss; the method is perfect for recording single nucleotide frequencies, but higher order groupings (like pairs or triplets of nucleotides) are not accounted for. Using hidden Markov models (HMMs) helps to preserve this kind of information as well. Combining Markov state change probabilities matrix and position-weight matrix for a single set of sequences yields a method of storing full TFBS characteristics.
Taking into account the length of matrices used for TFBS prediction (usually less than 15 nucleotides), searching for IUPAC-denoted binding sites yields numerous false-positive results that occur by chance. When applying PWM-based search methods, matrix-TFBS similarity score threshold can be used to increase specificity (obtain less false-positives) at the cost of sensitivity (obtain less true-positives). Thus, the search for TFBSs alone is not sufficient, as either sensitivity or specificity has to be sacrificed. Additional processing of results can help to avoid the loss of sensitivity and reduce the number of false-positive binding site predictions. Various methods of additional processing have been suggested in the literature, for example: looking for paired TFBS, TFBS motifs, using gene orthology information (10), microarray-derived gene co-expression data, applying learning algorithms trained on known transcription factor target genes.
We have developed a new web-based tool (named COTRASIF) that enables genome-wide searches with user-specified TFBS; the results may be filtered based on evolutionary conservation (11), thus decreasing the number of false-positive results. COTRASIF allows using either PFM or a set of sequences as input. When a set of sequences is provided a hybrid HMM-PWM search method is used instead of the PWM-only search method.
Online applications, such as MatInspector (12), MATCH (13) and ConSite (14) were built to predict TFBS embedded in promoter sequences. These tools are built to check a database of existing TFBS matrices against a small number of promoter sequences, suiting the needs of the molecular biologist studying a specific set of genes. On the contrary, COTRASIF is a genome-wide scanner for a single factor's binding sites, and thus is more suitable for the identification of genes potentially responding to the factor in question. Another important difference is that COTRASIF contains its own, regularly updated database of eukaryotic promoters (automatically imported from Ensembl genome annotations), which simplifies usage significantly and guarantees that the internal promoters database will not become out-of-date. Adding to the convenience of use, the JASPAR CORE and TRANSFAC 7.0 Public databases of TFBS matrices are integrated into COTRASIF, allowing easy selection of known matrices.
There is an extensive online help available for the tool. Non-commercial use of COTRASIF is free.
COMPARABLE TOOLS
We performed a feature-based comparison of COTRASIF with other tools. As source lists we used Expression->Gene Regulation and DNA->Sequence Feature Detection categories from http://bioinformatics.ca/links_directory/ (which includes the tools published in NAR Web Server Issues since 2003), and Database Summary ‘Transcriptional regulatory sites and transcription factors’ category at http://www3.oup.co.uk/nar/database/subcat/1/4 (which includes links to the databases published in NAR Database Issue). Only the tools and databases which were accessible at the time of comparison, which are capable of full-genome search and are free to use were considered. A total of eight tools qualified and were compared.
We found that MAPPER (15) is the most similar to COTRASIF in terms of available functionality and methods used. MAPPER requires user registration, but is free for academic use, and currently has six genome-wide promoter collections for searching. However, not only the higher number of available in COTRASIF genome-wide promoter collections makes it different from MAPPER. COTRASIF was designed as an easy-to-use self-updating genome-wide search tool, while MAPPER originated as a database of precomputed putative TFBS locations (16). Also, COTRASIF offers a more flexible approach to TFBS conservation filtering, and provides both PWM and HMM-based TFBS search methods.
Full tools comparison table is available in online Supplementary Data.
ALGORITHMS AND IMPLEMENTATION
Architecture
COTRASIF is built around an internal MySQL 5 relational database, where it stores gene metadata, gene promoters, Ensembl-to-EntrezGene ID mappings (where available) and gene orthology data for all the genomes added to the system. The Ensembl genome annotation system (17) is used as the source for gene promoters and for the gene orthology data.
As Ensembl is release-based, with each release improving the quality of genome annotations, a special semi-automatic data import pipeline was created to fetch the latest Ensembl release. The pipeline was built using BioMart's MartService (18). A set of PHP and Python program files work directly with COTRASIF's internal database, allowing import initiation and control via a dedicated importer pipeline web-interface.
General scheme of COTRASIF is shown in Figure 1. At the time of writing, there are 20 genome-wide promoter sets in COTRASIF, totaling 165 011 promoters.
Figure 1.

COTRASIF organization and data flow scheme.
Definitions
A gene promoter is defined as a sequence starting 2000 bp upstream from the transcription start site (TSS), and extending until the first exon (that is, including 5′ UTR sequence, if one is annotated for the gene).
One must understand that the reliability of COTRASIF promoters directly depends on the quality of annotation of the 5′ gene ends in the Ensembl database. To avoid accumulating erroneous promoter annotations, we only import upstream regions of transcripts with status KNOWN (as defined in Ensembl; see below for other import criteria). To account for the possible alternative promoters of the alternative transcripts we import all the transcript promoters of each gene, avoiding only identical and 5′-overlapping promoters. COTRASIF database of promoters is not manually curated. For the details on Ensembl automatic gene annotation pipeline please see (17) and online documentation at www.ensembl.org.
The average promoter length in COTRASIF is 2132 bp, with only 50 promoters shorter than 2000 bp, and less than 2% of all promoters longer than 2866 bp. The following conditions must be met for the transcript sequence segment to be imported and saved in the database of promoters:
Chromosome must not be mitochondrial or of the ‘temporary’ type (which are used during sequencing and annotation). Non-qualifying chromosome types include UNKN/Un (unknown), MT (mitochondrial), NT_ (contig), _random etc (as defined in Ensembl). These exceptions are manually set when adding new species configuration record to COTRASIF, based on the list of options offered by MartView. As annotation quality increases, the number of genes in ‘temporary’ chromosomes will decrease towards nil with time. Until that happens, a number of genes will not make it into the COTRASIF database, if they belong to one of the above-mentioned chromosome types.
Gene biotype must be ‘protein coding’ (applies to all species). Sequences, coding pseudogenes, miRNAs, tRNAs, rRNAs and other protein-non-coding RNAs, are not currently imported by the COTRASIF pipeline.
Transcript status must be KNOWN (as opposed to NOVEL). In Ensembl, KNOWN status means that there is an experimental species-specific evidence in support of the transcript (17). It's important to note that in Ensembl all the predictions are based on experimental evidence (including NOVEL status), but NOVEL transcripts do not have species-specific evidence—only the one inferred by similarity.
As shown in Figure 1, COTRASIF uses a set of two search algorithms (here named ‘PWM finder’ and ‘HMM-PWM finder’) and an orthology filter to produce results.
PWM finder tool
The PWM TFBS finder tool is to be used when the factor of interest has an already-defined PFM of the corresponding TFBS—e.g. the one from JASPAR (1) or TRANSFAC (19). In PWM finder, the user-supplied PFM is first converted into the PWM (20–22):
| 1 |
where w(n, i) is a calculated PWM element value for nucleotide n in matrix column i, fn,i is a raw count of nucleotide n in matrix column i of the PFM, N is a number of sequences used to create the PFM, 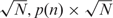 are pseudocounts, which correct for the small sample size N, p(n) is the background frequency of nucleotide n.
Conversion into PWM allows each matrix cell's value to hold both frequency data and information content data (23), which simplifies further similarity score calculations. COTRASIF allows both integer frequencies (counts) and fractional frequencies (with matrix column sums equal to 1), but weight-matrix input is not possible.
Introduction of pseudocounts into the PWM calculation formula slightly adjusts the scores so that the candidate sequence is not immediately discarded even if at the current position there is a nucleotide with zero frequency in the original PFM (22).
In formula (1), most commonly p(n) (nucleotide background frequency) is taken equal to 0.25. Another approach is to take p(n) based on AT/GC content for the whole studied genome. Previously we could not detect a statistically significant difference between using p(n) = 0.25 and calculating p(n) from the promoter sequence (20), so in COTRASIF p(n) is fixed at 0.25.
When using the PWM finder tool, the user can select the desired minimal matrix-to-sequence similarity score. Based both on literature and our own results, we found that the following recommended thresholds for the similarity score can be used:
0.93 and above ‘tight’—will result in a small number of highly specific TFBS suggestions. This threshold is recommended for finding the most probable candidate targets of TF; not all known TFBS will be found;
0.82–0.93 ‘medium’—expect thousands of predicted TFBS, additional filtering/post-processing will be necessary (e.g. COTRASIF's orthology filter). This range is the equivalent of ‘second exon-based cut-off’ (24), i.e. this score range is tailored to minimize the number of detected false-positives; not all known TFBS will be found;
0.75–0.82 ‘wide’—filtering/post-processing is required (ideally, several post-processing filters should be applied); most—if not all—known TFBS will be found;
below 0.75 ‘not recommended’.
As COTRASIF does not yet calculate optimal matrix-specific TFBS similarity score thresholds in the PWM search method, it is recommended that users utilize external tools to identify best similarity scores for their purposes (e.g. minimizing false-positive, false-negative or both prediction errors) (13). The HMM-PWM finder tool, described below, does provide automatic threshold calculation and adjustment.
HMM-PWM finder tool
A Hidden Markov Model (HMM) is a set of Markov chains, which together form a graph. In the Markov chain, sequential independent events are linked with probability-weighted transitions. As multiple paths exist through an HMM, it can be used as a classifier, given preliminary model training on the known set of data.
While the PWM-based TFBS search method assumes independently occurring nucleotides (thus ignoring pairs and higher-order groupings of favorably-neighboring nucleotides), the application of HMMs allows capturing more statistics from the known binding sites, by taking into account the co-occurrence frequencies of the neighboring nucleotides. For the application of HMM to the TFBS search, each event is defined as one of {ACGT}. Transitions are possible only between neighbor nucleotides. Each event has one incoming transition and four outgoing transitions.
The HMM training requires that actual aligned sequences of the known TFBS are given to the tool as input. At least three sequences are required. Ideally, the number of sequences should be >16 (this is dictated by the transition matrix size, which is 4 × 4).
If the number of experimentally determined TFBS sequences is low, one can additionally supply the tool with the PFM, corresponding to the target factor. Such a PFM must be built from more sequences than the number of sequences provided by the user to the search tool—otherwise there will be no additional benefit in adding such a PFM. Given both sequences and the PFM, the HMM-PWM search method will take that PFM into account when calculating the similarity score between the candidate sequence and the HMM model.
When no optional PFM is provided to the HMM-PWM search method, PFM is built internally from the user-submitted sequences (hence the method name). The reasoning behind this is to deviate from the pure transitions-based representation of the TFBS, and instead incorporate both components: position-weight and neighbor co-occurrence.
The HMM-PWM TFBS search is performed in three steps:
building the HMM from the user-submitted known TFBS sequences;
identifying optimal similarity score threshold;
comparing the model built in Step 1 to each candidate sequence (using a sliding window), then saving to file models that produce scores higher than the threshold defined in Step 2.
In step 1, matrices of co-occurrence frequencies are calculated (Figure 2). These matrices are calculated for all pairs of neighboring nucleotides, using all user-submitted known TFBS sequences. As each such matrix is 4 × 4 in size, and the total number of nucleotide pairs is (k − 1) (where k is the length of the known TFBS), the resulting full-length co-occurrence matrix is 3D, of size 4 × 4 × (k − 1).
Figure 2.

An example of calculating a single co-occurrence matrix for positions 8 and 9, using the aligned known sequences of the ISRE (interferon-stimulated response element). In the co-occurrence matrix, numbers at the row-column intersections represent the observed frequency of the given nucleotides co-occurrence, e.g. the AT nucleotide pair is observed two times, and all of CA, CC, CG and CT are observed 0 times. (A) Eight aligned sequences; (B) the resulting co-occurrence matrix for the highlighted pair of positions 8 and 9.
For the resulting matrix, we define transition function tf, which incorporates both co-occurrence and position-weight components (Formula 2):
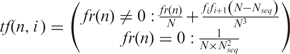 |
2 |
where tf is the transition function between neighbour nucleotides, i is the position of the transition origin nucleotide, i +1 is the position of the transition destination nucleotide, n is the actual nucleotide present at position i (one of {ACGT}), fr(n) is the co-occurrence frequency of the two nucleotides n and ni+1 (taken from the 4 × 4 × (k−1) co-occurrence matrix), N is the number of sequences used for the construction of the optionally supplied PFM of the target TFBS (N equals Nseq when no optional PFM is submitted by the user), Nseq is the number of user-submitted known TFBS sequences,  is the minimal compensator, fi is the raw count of current nucleotide n in column i of the PFM, fi+ 1 is the raw count of current nucleotide n in column i +1 of the PFM.
The transition function tf is defined differently for two cases: (i) when co-occurrence frequency is equal to zero, and (ii) when it is not equal to zero. This serves the purpose similar to that of pseudo-counts, employed in PWM-based methods to account for the small sample size. When the co-occurrence frequency is zero [lower part of formula (2)], then the transition function without the pseudo-count would be also zero for a given pair of nucleotides; this would make the algorithm discard such a candidate sequence immediately. However, if we introduce some minimal tf value for zero-frequency nucleotide pairs, then the candidate sequence will not be immediately discarded, and will still be scored by non-zero frequencies in other positions.
As with the PWM-based TFBS search, comparison of the HMM-PWM model of the TFBS with the candidate sequence yields a model-sequence similarity score, and threshold needs to be estimated. For the HMM-PWM method, we decided to implement an internal automatic threshold optimization. Our threshold optimizer attempts to decrease both false-positive and false-negative prediction errors.
In step 2, the initial threshold is taken as equal to the lowest similarity score, which is obtained by comparing user-submitted known TFBS sequences one-by-one to the model, built from those sequences. Next, 107 random nucleotide sequences of length k are generated. Random sequences, yielding similarity score higher than the current threshold, are then used to build the ‘testing’ co-occurrence matrix, which is compared to the original 4 × 4 × (k − 1) co-occurrence matrix. If both matrices have no statistically significant difference (at significance level of 0.02), then the current (normalized) threshold is decreased by 0.01; the process is then repeated starting from the generation of 107 k-long random nucleotide sequences. Otherwise, if p < 0.02 for the null hypothesis of two matrices being equivalent, threshold optimization stops and returns current threshold value.
P-value for the comparison of the original and ‘testing’ co-occurrence matrices was calculated using formula (3):
| 3 |
where i is the serial number of nucleotide pair within both ‘testing’ and original co-occurrence matrices, k is the length of the random sequence (equal to the length of the known TFBS sequences), r and c are the row and column numbers in single-pair co-occurrence matrix (Figure 2B), Nseq is the number of user-submitted known TFBS sequences, f is the value of the observed frequency, found at row r and column c of the ith pair of nucleotides in the ‘testing’ co-occurrence matrix, tf is the transition function value (expected probability) in the original co-occurrence matrix for pair i, row r and column c.
In step 3, the sliding model-to-sequence comparison window is applied to calculate matrix-sequence similarity scores for each candidate sequence, and select sequences with scores higher than the threshold. To calculate raw HMM similarity score, formula (4) is used:
| 4 |
where HMMraw is HMM similarity score before normalization, tf is the transition function, defined in formula (2), i is the position of the current nucleotide within a scanning window, n is the actual nucleotide found at position i, (one of {ACGT}), k is the scanning window size (equal to the TFBS length).
HMMraw is then normalized using formula (5):
| 5 |
where HMMscore is the normalized HMM similarity score, which is written to the results file, HMMraw is the similarity score before normalization, HMMmin is the minimal possible HMM similarity score, HMMmax is the maximal possible HMM similarity score.
Conservation filter
COTRASIF currently offers a single post-processing option, namely conservation (orthology) filter. It works by comparing two results (obtained by using either PWM finder or HMM-PWM finder tools) from different but related species with the orthology data for that pair of species. The identified TFBS is considered to have biological meaning (passes the filter) if: (i) the TFBS is found in the promoter of the gene of the species of interest, (ii) is also present in the promoter of the orthologous gene of the reference species and (iii) both peptide identity and type of orthology satisfy the minimal requirements (listed below). The assumption behind the procedure is that if the binding site has no biological meaning, then it is unlikely to be preserved through evolutionary time.
The conservation filter does not perform promoter sequence alignments—it relies solely on the presence of detected TFBS in the promoters of orthologous genes; throughout the text we use ‘conservation filter’ exactly in this meaning.
Orthology mappings are imported from Ensembl by COTRASIF's import pipeline with each new release of Ensembl (Figure 1). Ensembl provides peptide identity percentage for each pair of protein-coding genes, plus the orthology type flag: it can be one of ‘ortholog_one2one’ (reciprocal best hit genes), ‘ortholog_one2many’, ‘ortholog_many2many’ and ‘apparent_ortholog_one2one’ (when no other similarities found, or annotation system error occurred). At the time of writing the minimal peptide identity percentages for each orthology type are hard-coded into COTRASIF; in future releases we plan to make this customizable by end user. Currently, the following criteria determine whether the orthology relationship between genes is sufficient to use it for TFBS selection:
for ‘ortholog_one2one’ entries, peptide identity of over 60% is required;
for ‘ortholog_one2many’ and ‘ortholog_many2many’, 75% identity is required;
for ‘apparent_ortholog_one2one’, 65% peptide identity is required.
To use the orthology filter, one has to submit and wait for the completion of at least two tasks for different genomes, using the same email address (which is currently the only means of user identification). When there are at least two finished tasks in the system, it is possible to select the tasks for comparison using gene orthology data.
It is important to note that input to the orthology filter is not restricted in any way and allows any combination of task results to be selected. On the one hand, this approach allows high flexibility for every research employing COTRASIF. On the other hand, this puts the burden of choosing suitable genomes on the COTRASIF user, but thanks to the simplicity of the orthology filter and the availability of phylogenetic trees for all COTRASIF species, this should not be a problem.
In addition to the position-unrestrained TFBS co-occurrence in the promoters of orthologous genes, it is planned to implement in the nearest future position-restrained filtering, with position being measured from the TSS of each gene in the orthologs pair.
Sample application
To illustrate possible uses, and to verify the results produced by COTRASIF tool, we performed an investigation of a gene set specific for the primary cellular response to Type I interferons (tissue specificity was not accounted for). For Type I interferons the primary signal transduction pathway is well-studied—namely, the Jak-STAT pathway, which results in the activation of ISGF3 transcription factor (interferon-stimulated gene factor 3), which in turn binds specifically to interferon-stimulated response element (ISRE) (25). Thus, searching for ISRE will yield putative genes of the primary response to Type I interferon treatment.
We ran the search using the hybrid HMM-PWM finder tool. The TFBS matrix and sequences used for search are present as pre-input examples on COTRASIF HMM-PWM task submission page and are also available in the Supplementary Data and online at http://biomed.org.ua/COTRASIF/supplement.html. The search was conducted in the Rattus norvegicus promoters extracted from Ensembl release 52.
We found 743 putative ISREs in 707 probable IFN Type I rat primary response genes and 1292 putative ISREs in 1163 mouse genes. The application of the conservation filter (using rat as target genome and mouse as reference genome) yielded 162 rat genes with putative conserved ISRE. Full lists of genes are available in online Supplementary Data.
First, we performed GO enrichment analysis of 707 rat genes versus the 17 725 protein-coding rat genes represented in COTRASIF promoters database, using FatiGO (26). At adjusted p-value < 0.05, five GO categories were found to be enriched (Table 1).
Table 1.
GO over-represented terms analysis results for 707 rat genes with putative ISREs found using COTRASIF's HMM-PWM search method (list #1) versus all rat protein-coding genes (list #2)
| Index | Term | List #1 versus #2 | P-value | Adjusted P-value |
|---|---|---|---|---|
| GO molecular function at level 6 | ||||
| 10 | Serine-type endopeptidase activity (GO:0004252) | 75.27%, 24.73% | 6.2 × 10⁻⁵ | 0.0382 |
| GO molecular function at level 7 | ||||
| 11 | Tissue kallikrein activity (GO:0004293) | 93.62%, 6.38% | 1.4 × 10⁻³ | 0.0402 |
| GO cellular component at level 7 | ||||
| 18 | MHC protein complex (GO:0042611) | 83.59%, 16.41% | 3.76 × 10⁻⁴ | 0.0177 |
| GO cellular component at level 8 | ||||
| 19 | MHC class I protein complex (GO:0042612) | 86.64%, 13.36% | 8.52 × 10⁻⁵ | 0.00554 |
| GO molecular function at level 5 | ||||
| 9 | Serine-type peptidase activity (GO:0008236) | 74.91%, 25.09% | 5.05 × 10⁻⁵ | 0.0211 |
We also performed GO over-represented terms analysis of 162 rat genes obtained after applying conservation filter. The only enriched category was the GO biological process term ‘immune response’ (GO:0006955), with p-value 1.23 × 10⁻⁴ and adjusted p-value 8.52 × 10⁻³. Enriched category contained nine genes:
Mbl1, mannose-binding protein A precursor (MBP-A); no known correlations of Mbl1 expression and interferon treatment.
LOC687510, ENSRNOG00000029191; this rat gene is not annotated, but is a 1-to-1 ortholog to Mus musculus GBP6 gene; murine GBP6 was recently shown to be IFN-inducible (27).
Mx1 and Mx2, interferon-induced GTP-binding proteins.
Cxcl4, platelet factor 4 precursor (PF-4, C-X-C motif chemokine 4); no known expression correlation with interferon treatment.
Igsf4a, immunoglobulin superfamily, member 4A (NECL-2); no correlation with interferon found.
Oasl2, 2′-5′ oligoadenylate synthetase-like 2 is a well-known target of IFN.
GBP4_predicted, ENSRNOG00000028768; similar to the LOC687510, murine GBP3 ortholog is IFN-inducible (27,30).
Of nine genes, four are well-known IFN type I targets, two genes have mouse orthologs which are known to be IFN type I and type II regulated (27,31), and for three genes there is no accumulated evidence of IFN type I regulation.
Future development
The following major new features are planned for implementation:
Addition of full-genome-sequence search (as opposed to full-genome-promoters search). This will be an addition to the existing functionality, not a replacement.
Analysis of relative TFBS enrichment of each promoter, to ease the identification of the most promising candidates for experimental verification.
Implementation of the automatic threshold calculation for the PWM method, similar to the HMM method. This will be an optional feature (manual cut-off specification will be preserved).
Addition of the user-adjustable TFBS position constraints to the conservation filter. TFBS position will be defined as the distance from the TSS in the promoter of each of the orthologous genes. Position constraint will be an option—unconstrained filtering will be also possible.
CONCLUSION
We have developed an easy to use, web-based tool for genome-wide surveys of eukaryotic promoters for the presence of TFBSs. We made two different search tools available: PWM-based, for searches utilizing position-frequency matrices (PFM) from TRANSFAC or JASPAR databases, and HMM-based for searches based on known TFBS sequences.
In addition to the two search methods, COTRASIF also offers a conservation filter, which allows putative TFBSs to be tested for cross-species conservation in the promoters of the orthologous genes. This step acts as an important biological function filter, decreasing the number of false-positives without sacrificing search sensitivity.
The interface is simple and accessible not only to bioinformaticians, in part thanks to the seamless integration of the JASPAR and TRANSFAC databases. All the genomes and JASPAR matrices are automatically updated using a built-in data pipeline, which ensures that COTRASIF will stay up-to-date and relevant. However, result reproducibility is not guaranteed between Ensembl releases due to possible changes in gene annotations.
SUPPLEMENTARY DATA
Supplementary Data are available at NAR Online.
FUNDING
STCU grant #4381. The open access publication charge was partially waived by Oxford University Press.
Conflict of interest statement. None declared.
Supplementary Material
REFERENCES
- 1.Sandelin A, Alkema W, Engstrom P, Wasserman WW, Lenhard B. JASPAR: an open-access database for eukaryotic transcription factor binding profiles. Nucleic Acids Res. 2004;32:D91–D94. doi: 10.1093/nar/gkh012. [DOI] [PMC free article] [PubMed] [Google Scholar]
- 2.Lenhard B, Wasserman WW. TFBS: Computational framework for transcription factor binding site analysis. Comput. Appl. Biosci. 2002;18:1135–1136. doi: 10.1093/bioinformatics/18.8.1135. [DOI] [PubMed] [Google Scholar]
- 3.Schones DE, Sumazin P, Zhang MQ. Similarity of position frequency matrices for transcription factor binding sites. Comput. Appl. Biosci. 2005;21:307–313. doi: 10.1093/bioinformatics/bth480. [DOI] [PubMed] [Google Scholar]
- 4.Stormo GD. DNA binding sites: representation and discovery. Comput. Appl. Biosci. 2000;16:16–23. doi: 10.1093/bioinformatics/16.1.16. [DOI] [PubMed] [Google Scholar]
- 5.Staden R. Computer methods to locate signals in nucleic acid sequences. Nucleic Acids Res. 1984;12:505–519. doi: 10.1093/nar/12.1part2.505. [DOI] [PMC free article] [PubMed] [Google Scholar]
- 6.Stormo GD, Schneider TD, Gold L, Ehrenfeucht A. Use of the ‘Perceptron’ algorithm to distinguish translational initiation sites in E. coli. Nucleic Acids Res. 1982;10:2997–3011. doi: 10.1093/nar/10.9.2997. [DOI] [PMC free article] [PubMed] [Google Scholar]
- 7.Hertz GZ, Stormo GD. Identifying DNA and protein patterns with statistically significant alignments of multiple sequences. Comput. Appl. Biosci. 1999;15:563–577. doi: 10.1093/bioinformatics/15.7.563. [DOI] [PubMed] [Google Scholar]
- 8.Hertz GZ, Hartzell GW, III, Stormo GD. Identification of consensus patterns in unaligned DNA sequences known to be functionally related. Comput. Appl. Biosci. 1990;6:81–92. doi: 10.1093/bioinformatics/6.2.81. [DOI] [PubMed] [Google Scholar]
- 9.Stormo GD, Hartzell GW. identifying protein-binding sites from unaligned DNA fragments. Proc. Natl Acad. Sci. USA. 1989;86:1183–1187. doi: 10.1073/pnas.86.4.1183. [DOI] [PMC free article] [PubMed] [Google Scholar]
- 10.Wasserman WW, Palumbo M, Thompson W, Fickett JW, Lawrence CE. Human-mouse genome comparisons to locate regulatory sites. Nat. Genet. 2000;26:225–228. doi: 10.1038/79965. [DOI] [PubMed] [Google Scholar]
- 11.Lenhard B, Sandelin A, Mendoza L, Engstrom P, Jareborg N, Wasserman W. Identification of conserved regulatory elements by comparative genome analysis. J. Biol. 2003;2:13. doi: 10.1186/1475-4924-2-13. [DOI] [PMC free article] [PubMed] [Google Scholar]
- 12.Cartharius K, Frech K, Grote K, Klocke B, Haltmeier M, Klingenhoff A, Frisch M, Bayerlein M, Werner T. MatInspector and beyond: promoter analysis based on transcription factor binding sites. Comput. Appl. Biosci. 2005;21:2933–2942. doi: 10.1093/bioinformatics/bti473. [DOI] [PubMed] [Google Scholar]
- 13.Kel AE, Gossling E, Reuter I, Cheremushkin E, Kel-Margoulis OV, Wingender E. MATCH: a tool for searching transcription factor binding sites in DNA sequences. Nucleic Acids Res. 2003;31:3576–3579. doi: 10.1093/nar/gkg585. [DOI] [PMC free article] [PubMed] [Google Scholar]
- 14.Sandelin A, Wasserman WW, Lenhard B. ConSite: web-based prediction of regulatory elements using cross-species comparison. Nucleic Acids Res. 2004;32:W249–W252. doi: 10.1093/nar/gkh372. [DOI] [PMC free article] [PubMed] [Google Scholar]
- 15.Marinescu V, Kohane I, Riva A. MAPPER: a search engine for the computational identification of putative transcription factor binding sites in multiple genomes. BMC Bioinform. 2005;6:79. doi: 10.1186/1471-2105-6-79. [DOI] [PMC free article] [PubMed] [Google Scholar]
- 16.Marinescu VD, Kohane IS, Riva A. The MAPPER database: a multi-genome catalog of putative transcription factor binding sites. Nucleic Acids Res. 2005;33:D91–D97. doi: 10.1093/nar/gki103. [DOI] [PMC free article] [PubMed] [Google Scholar]
- 17.Curwen V, Eyras E, Andrews TD, Clarke L, Mongin E, Searle SMJ, Clamp M. The Ensembl Automatic Gene Annotation System. Genome Res. 2004;14:942–950. doi: 10.1101/gr.1858004. [DOI] [PMC free article] [PubMed] [Google Scholar]
- 18.Kasprzyk A, Keefe D, Smedley D, London D, Spooner W, Melsopp C, Hammond M, Rocca-Serra P, Cox T, Birney E. EnsMart: A Generic System for Fast and Flexible Access to Biological Data. Genome Res. 2004;14:160–169. doi: 10.1101/gr.1645104. [DOI] [PMC free article] [PubMed] [Google Scholar]
- 19.Matys V, Kel-Margoulis OV, Fricke E, Liebich I, Land S, Barre-Dirrie A, Reuter I, Chekmenev D, Krull M, Hornischer K, et al. TRANSFAC and its module TRANSCompel: transcriptional gene regulation in eukaryotes. Nucleic Acids Res. 2006;34:D108–D110. doi: 10.1093/nar/gkj143. [DOI] [PMC free article] [PubMed] [Google Scholar]
- 20.Tokovenko BT, El'skaya AV, Obolenskaya MYu. In silico approach to study and functionally analyze interferon regulated genes. Biopolym. Cell. 2007;23:368–375. [Google Scholar]
- 21.Jin VX, Leu YW, Liyanarachchi S, Sun H, Fan M, Nephew KP, Huang THM, Davuluri RV. Identifying estrogen receptor {alpha} target genes using integrated computational genomics and chromatin immunoprecipitation microarray. Nucleic Acids Res. 2004;32:6627–6635. doi: 10.1093/nar/gkh1005. [DOI] [PMC free article] [PubMed] [Google Scholar]
- 22.Wasserman WW, Sandelin A. Applied bioinformatics for the identification of regulatory elements. Nat. Rev. Genet. 2004;5:276–287. doi: 10.1038/nrg1315. [DOI] [PubMed] [Google Scholar]
- 23.Quandt K, Frech K, Karas H, Wingender E, Werner T. MatInd and MatInspector: new fast and versatile tools for detection of consensus matches in nucleotide sequence data. Nucleic Acids Res. 1995;23:4878–4884. doi: 10.1093/nar/23.23.4878. [DOI] [PMC free article] [PubMed] [Google Scholar]
- 24.Long F, Liu H, Hahn C, Sumazin P, Zhang MQ, Zilberstein A. Genome-wide prediction and analysis of function-specific transcription factor binding sites. In Silico Biol. 2004;4:395–410. [PubMed] [Google Scholar]
- 25.Horvath CM. The Jak-STAT Pathway Stimulated by interferon alpha or interferon beta. Sci. STKE. 2004;2004:tr10. doi: 10.1126/stke.2602004tr10. [DOI] [PubMed] [Google Scholar]
- 26.Al-Shahrour F, Minguez P, Tarraga J, Montaner D, Alloza E, Vaquerizas JM, Conde L, Blaschke C, Vera J, Dopazo J. BABELOMICS: a systems biology perspective in the functional annotation of genome-scale experiments. Nucleic Acids Res. 2006;34:W472–W476. doi: 10.1093/nar/gkl172. [DOI] [PMC free article] [PubMed] [Google Scholar]
- 27.Degrandi D, Konermann C, Beuter-Gunia C, Kresse A, Wurthner J, Kurig S, Beer S, Pfeffer K. Extensive Characterization of IFN-Induced GTPases mGBP1 to mGBP10 Involved in Host Defense. J. Immunol. 2007;179:7729–7740. doi: 10.4049/jimmunol.179.11.7729. [DOI] [PubMed] [Google Scholar]
- 28.Zhang B, Zhang J, Tian Z. Comparison in the effects of IL-2, IL-12, IL-15 and IFNalpha on gene regulation of granzymes of human NK cell line NK-92. Int. Immunopharmacol. 2008;8:989–996. doi: 10.1016/j.intimp.2008.03.001. [DOI] [PubMed] [Google Scholar]
- 29.Li S, Xia X, Zhang X, Suen J. Regression of tumors by IFN-alpha electroporation gene therapy and analysis of the responsible genes by cDNA array. Gene Ther. 2002;9:390–397. doi: 10.1038/sj.gt.3301645. [DOI] [PubMed] [Google Scholar]
- 30.Wang J, Campbell IL, Zhang H. Systemic interferon-alpha regulates interferon-stimulated genes in the central nervous system. Mol. Psychiatry. 2007;13:293–301. doi: 10.1038/sj.mp.4002013. [DOI] [PubMed] [Google Scholar]
- 31.Olszewski MA, Gray J, Vestal DJ. In silico genomic analysis of the human and Murine guanylate-binding protein (GBP) Gene Clusters. J. Interferon Cytokine Res. 2006;26:328–352. doi: 10.1089/jir.2006.26.328. [DOI] [PubMed] [Google Scholar]
Associated Data
This section collects any data citations, data availability statements, or supplementary materials included in this article.