


Abstract
Quantifying interactions in DNA microarrays is of central importance for a better understanding of their functioning. Hybridization thermodynamics for nucleic acid strands in aqueous solution can be described by the so-called nearest neighbor model, which estimates the hybridization free energy of a given sequence as a sum of dinucleotide terms. Compared with its solution counterparts, hybridization in DNA microarrays may be hindered due to the presence of a solid surface and of a high density of DNA strands. We present here a study aimed at the determination of hybridization free energies in DNA microarrays. Experiments are performed on custom Agilent slides. The solution contains a single oligonucleotide. The microarray contains spots with a perfect matching (PM) complementary sequence and other spots with one or two mismatches (MM) : in total 1006 different probe spots, each replicated 15 times per microarray. The free energy parameters are directly fitted from microarray data. The experiments demonstrate a clear correlation between hybridization free energies in the microarray and in solution. The experiments are fully consistent with the Langmuir model at low intensities, but show a clear deviation at intermediate (non-saturating) intensities. These results provide new interesting insights for the quantification of molecular interactions in DNA microarrays.
INTRODUCTION
DNA microarrays are widely used in the current research in molecular biology (1). Such devices have several important applications (2) as for instance in gene expression profiling, in the detection of single nucleotide polymorphisms, in the analysis of copy number variations and of target sequences for transcription factors. Several different platforms, either commercial or home made, are currently available. They differ by the details of fabrications (via spotting or in situ growth), the length of the sequences (oligonucleotides or long PCR fragments) and the chemistry of fixation. What all DNA microarrays have in common is the basic underlying reaction of hybridization between a nucleic acid strand in solution and a complementary strand linked covalently at a solid surface. Hybridization is characterized by a (sequence-dependent) free energy difference ΔG which measures the binding affinity for the two strands to form a duplex.
In the past decades, a large number of papers were dedicated to the investigation of static and dynamic properties of the hybridization between nucleic acid strands that are both floating in an aqueous solution [see (3) and references therein]. Nearest neighbor models provide resonable approximation of ΔG for strands hybridizing in solution (4,5). In these models ΔG is calculated as a sum of ‘stacking’ parameters associated to dinucleotides (3). The nearest neighbor model is known to be rather accurate at least for hybridization between complementary strands. The case of single internal mismatches (6) as well as the dependence of ΔG on other parameters as the monovalent salt concentration (7) were also considered.
There has been some discussion in the literature about the relationship between hybridization in solution and hybridization in DNA microarrays. In early studies of gel pad microarrays (8), a linear relationship between microarray hybridization free energies (Δ Gμarray) and the corresponding free energies in solution (ΔGsol) was found. Recently (9) a similar relationship was observed on self-spotted codelink activated slides. Other studies on Affymetrix Genechips (10,11) report very weak correlation between ΔGμarray and ΔGsol. In some papers (12,13), however, the same Affymetrix data could be fitted resonably well with a linearly rescaled ΔGsol. Also some recent measurements of thermodynamic parameters using a temperature-dependent surface plasmon resonance (14) seem to suggest a decreased ΔGμarray compared to ΔGsol. Clearly, as also some recent literature points out (6,15,16), more systematic physico-chemical studies are required for a better understanding of hybridization in DNA microarrays. A precise quantification of ΔG is important. Through a better understanding of molecular interactions between hybridizing strands, it would be possible to turn microarrays into more precise tools for large-scale genomic analysis. For instance, one could estimate gene expression levels or detect mutations through an analysis based on thermodynamics instead of using empirical statistical methods.
This article is dedicated to the investigation of the applicability of the nearest neighbor model to describe hybridization reactions in DNA microarrays, with a focus on sequences that contain isolated mismatches. Experimental results involving the hybridization of one sequence in solution with a large set of different sequences on a microarray will be presented. The stacking free-energy parameters will be determined from the analysis of the behavior of the experimental fluorescent intensities measured from different spots of the microarray. We will be interested in the correlation between free energies resulting from these parameters and the equivalent quantities calculated from experimental stacking free-energy parameters of nucleic acid melting in aqueous solution. The analysis of the experimental data clearly reveals a good degree of correlation. However, a much better agreement with thermodynamic models is found if the thermodynamic parameters are directly fitted from the experimental microarray data. In addition to this tight agreement with theory, a regime is found where the data are cleary deviating from the Langmuir behavior.
This article is organized as follows. Materials and methods Section discusses the experimental setup, the thermodynamic model of hybridization and the fitting procedure. In Results and discussion section, the experimental results are presented and a comparison between free energies fitted from the microarray data and their solution counterparts is done. The final part of the article is dedicated to a general discussion in which some open issues are highlighted.
MATERIALS AND METHODS
The design of the experiment
For the present study several hybridization experiments were performed, each with a single oligonucleotide sequence (referred to as the target in this paper) in solution at different concentrations. Four different targets were used in the experiments, and their sequences are given in Table 1. The sequences contain a 30-mer hybridizing stretch followed by a 20-mer poly(A) spacer and a Cy3 label at the 3′-end of the sequence. Each target oligo was bought in duplicate in order to check the quality of the target synthesis. In the rest of the article, we will refer to the two duplicated oligos as a and b.
Table 1.
The oligos used as target in the four different hybridization expriments
| Name | Sequence | Labeling |
|---|---|---|
| Target1 | 5′ GTTTTCGAAGATTGGGTGGCACTGTTGTAA 3′ | 20-mer poly A + Cy3 on 3′ |
| Target2 | 5′ CAGGGCCTCGTTATCAATGGAGTAGGTTTC 3′ | 20-mer poly A + Cy3 on 3′ |
| Target3 | 5′ CTTTGTCGAGCTGGTATTTGGAGAACACGT 3′ | 20-mer poly A + Cy3 on 3′ |
| Target4 | 5′ GCTTCTCCTTAATGTCACGCACGATTTCCC 3′ | 20-mer poly A + Cy3 on 3′ |
The oligos were bought from Eurogentec in duplicate obtained from independent synthesis cycles.
The sequences printed at the microarray surfaces and referred here as the probes were chosen to contain up to two mismatches, following the scheme shown in Table 2. Mismatches were inserted from nucleotides 6 to nucleotide 25 along the 30-mer sequences in order to avoid terminal regions. In the probes with two mismatches these were separated by at least 5 nt. Given the nucleotide of the target strand there are three different possible mismatching nucleotides and 20 available positions, hence in total 60 single mismatch sequences. A similar counting for double mismatches yields 945 different sequences (Table 2). The total number of probe sequences, including the perfect matching one, is 1006.
Table 2.
Design of probeset: probe sequences covalently linked at the microarray surface contained up to two mismatches following the scheme shown in this table
| No. of probes | Type of mismatch | Location of mismatch |
|---|---|---|
| 1 | Perfect match | — |
| 60 | Single mismatch (all three permutations) | site 6–25 |
| 945 | Double mismatch (all nine permutations) | site 6–25, separated by minimum five sites |
In total, there are 1006 different probe sequences, replicated 15 times in the custom 8 × 15 K custom Agilent slide.
For each experiment one target and one 8x15K custom Agilent slide was used. This slide consists of eight identical microarrays and each of these can contain up to more than 15 000 spots. The 1006 probe sequences were spotted in the custom array 15 times: in 12 repicates a 30-mer poly(A) was added on the 3′-side (surface side), in order to asses the effect of a sequence spacer. Three replicates contained no poly(A) spacer. The eight microarrays of one slide have to be hybridized during the same experiment, but a different target solution can be used. In the experiments, the target concentrations ranged from 50 to 10 000 pM according to the scheme given in Table 3. In Experiment 1 only target a was used, while in the Experiments 2, 3 and 4 both replicated targets (a and b) were used. Finally, in Experiments 1 and 2 a fragmentation of the target was performed before hybridization (see section on hybridization protocol for details).
Table 3.
The target condition per microarray: concentration, oligo synthesis a or b, fragmentation f if applied
| Microarray | Experiment/target 1 | Experiment/target 2 | Experiment/target 3 | Experiment/target 4 |
|---|---|---|---|---|
| 1 | 10 000 pM, a, f | 10 000 pM, a, f | 10 000 pM, a | 1000 pM, a |
| 2 | 7500 pM, a, f | 5000 pM, a, f | 5000 pM, a | 500 pM, a |
| 3 | 5000 pM, a, f | 1000 pM, a, f | 1000 pM, a | 100 pM, a |
| 4 | 2500 pM, a, f | 50 pM, a, f | 50 pM, a | 50 pM, a |
| 5 | 1000 pM, a, f | 10 000 pM, b, f | 10 000 pM, b | 1000 pM, b |
| 6 | 500 pM, a, f | 5000 pM, b, f | 5000 pM, b | 500 pM, b |
| 7 | 100 pM, a, f | 1000 pM, b, f | 1000 pM, b | 100 pM, b |
| 8 | 50 pM, a, f | 50 pM, b, f | 50 pM, b | 50 pM, b |
The four 30-mer target sequences were selected from fragments of human genes having a GC content ranging from 43% to 50%. A criterion for selecting the target sequences was the requirement that the probes constructed following the scheme in Table 2 would yield a roughly flat histogram of mismatch types, so that all mismatches are approximately equally present in the experiments.
Hybridization protocol and scanning
For the experiments, we used the commercially available Agilent platform and followed a standard protocol with Agilent products, as described subsequently. The target oligonucleotides were OliGold® from Eurogentec, Seraing, Belgium. Hybridization mixtures contained one target oligonucleotide with a 3′-Cy3 endlabeling diluted in nuclease-free water to the final concentration together with 5 μl 10× blocking agent and 25 μl 2× GEx hybridization buffer HI-RPM. Unfortunately, Agilent Techologies does not disclose the precise composition of the hybridization buffer in the content of salt and other chemicals. In Experiments 1 and 2 the addition of the hybridization buffer was proceeded by a fragmentation step, 1 μl fragmentation buffer was added followed by an incubation of 30 min at 60°C. This fragmentation buffer is customarily used in Agilent hybridization platforms and produces target sequences of reduced length in order to speed up the hybridization reaction. Too long sequences, as obtained from biological extracts, e.g. from reverse transcription of mRNA samples, have a reduced hybridization efficiency due to steric hindrance. By comparing experiments with and without fragmentation, we found that the fragmentation step has little effect on the results (more information can be found in the online Supplementary Material). The hybridization mixture was centrifuged at 13 000 r.p.m. for 1 min and each microarray of the 8×15K custom Agilent slides was loaded with 40 μl. The hybridization occurred in an Agilent oven at 65°C for 17 h with rotor setting 10 and the washing was performed according to the manufacturer's; instructions. The arrays were scanned on an Agilent scanner (G2565BA) at 5 μm resolution, high and low laser intensity and further processed using Agilent Feature Extraction Software (GE1 v5 95 Feb07) that performs automatic gridding, intensity measurement, background subtraction and quality checks.
Thermodynamic model
In the Langmuir model, the dynamics of hybridization is described by a rate equation for θ, the fraction of hybridized probes from a spot as follows
| 1 |
where c is the target concentration and k1 and k−1 are the attachment and detachment rates. The equilibrium value for θ can be obtained from the condition dθeq/dt = 0. Using the link between the rates and equilibrium constants, i.e. k1/k-1 = e−ΔG/RT, with ΔG the hybridization free energy, R the gas constant and T the temperature one finds
| 2 |
which is the so-called Langmuir isotherm. To link this isotherm to the measured quantities one assumes that the fraction of hybridized probes is linearly related to the measured fluorescent intensity measured from a spot, which yields
| 3 |
Here I is the background-subtracted intensity, where the background subtraction, as explained above is done by Agilent Feature Extraction software. In the rest of the article, we will no longer explicitly state that the intensities are background subtracted, and will simply refer to them as intensities. A is a constant which is an overall scale factor. Far from chemical saturation, i.e. when only a small fraction of surface sequences is hybridized (i.e. c e−ΔG /RT ≪ 1) one can neglect the denominator in Equation (2) to get:
| 4 |
In the nearest neighbor model, the hybridization free energy of perfect complementary strands is approximated as a sum of dinucleotide terms. For instance:
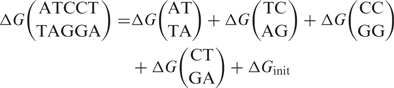 |
5 |
where ΔGinit is an initiation parameter. Since we will only consider differences of ΔG between a perfect matching hybridization and a hybridization with one or multiple mismatches [Equation (7)], this initiation parameter will not contribute and it is omitted in the rest of the article. For DNA/DNA hybrids, symmetries reduce the number of independent parameters to 10 (3). The nearest neighbor model can be extended to include single internal mismatches; as an example we consider the free energy of a stretch with an internal mismatch of CT type
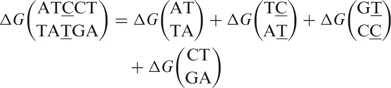 |
6 |
The mismatching nucleotides are underlined and for notational reasons the mismatch is always put in the second part of the dinucleotide (which requires the use of symmetry like here in dinucleotide term three). There are 12 types of mismatches and 4 types of flanking nucleotide pairs, hence in total there are 48 mismatch parameters of dinucleotide type.
There are several possible ways of extracting the 48 + 10 dinucleotide parameters from the experimental data. One can either fit the full Langmuir isotherm [Equation (2)], or for experiments at sufficiently low concentrations one could consider the limiting case of Equation (4). In addition, the parameters could be extracted either from an experiment at fixed concentration c, by comparing the intensities of different probe sequences, or from experiments at different concentrations by analyzing the intensities of identical probe sequences over a concentration range. As we will show later, the latter approach is not applicable as our data do not follow the Langmuir model at high intensities (and hence at high concentrations). We will therefore focus on the low concentration data and use Equation (4) for the analysis at fixed c.
Equation (4) contains the constant A which is an overall scale factor relating the hybridization probability to the actual measured fluorescence intensity. This quantity may fluctuate from experiment to experiment. For instance, the optical scanning influences A, as this is proportional to the laser intensity used. Also hybridizations in different slides might occur at slightly varying conditions and there can be small differences in the manifacturing of the slides. In the rest of this article we will focus on relative intensities and relative free energies, i.e. for each microarray we will use the perfect match of that microarray as a point of reference. We denote the logarithmic ratios of the intensities with the perfect match intensity as
| 7 |
for which the exact value of A is irrelevant and we only need to consider the relative free energy differences ΔΔG (which is for each probe a positive number). In ΔΔG of a duplex, only dinucleotide parameters which are flanking a mismatch remain, the other parameters cancel out in the subtraction. For example from Equations (5) and (6) one gets
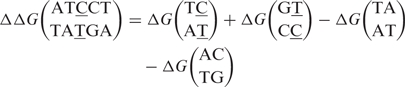 |
8 |
In this equation the lower strand refers to the target sequence in solution, which is fixed. The upper strand is that of the probe sequence attached to the solid surface. Hence, the ΔΔG of a duplex with one mismatch can be written as a sum of two mismatch dinucleotide parameters minus two matching dinucleotide parameters. As we assume that the nearest neighbor model is valid, the same reasoning can be applied to duplexes with two mismatches which results in a sum of four mismatch dinucleotide parameters minus four matching dinucleotide parameters. The model can now be written as
| 9 |
where α is the index running over the 58 possible dinucleotide parameters and X is a frequency matrix, whose elements Xiα are the number of times the dinucleotide parameter α enters in ΔΔG of probe sequence i. With a simple extension of matrices and vectors one can rewrite the problem as
| 10 |
where we have defined ωα = ΔGα/RT. Having written the problem in Equation (10) as a linear one, we can now apply the standard approach to find the optimal values of the parameters. The procedure consists in minimizing 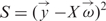 , which amounts to solving the following linear equation
| 11 |
where XT is the transpose of X.
Degeneracies of 
To obtain from Equation (11) one has to invert the 58 × 58 matrix XT X. In the case that XT X is not invertible one applies a singular value decomposition (18). In the present case the matrix is not invertible. Zero eigenvalues of the matrix XT X come from reparametrizations that leave the physically accessible parameters ΔΔG invariant. It is known, indeed, that the dinucleotide mismatch parameters are not uniquely determined (17,18), as these parameters are entering in the expression for the total ΔG in pairs [Equation (6)]. For instance, a reparametrization of the type:
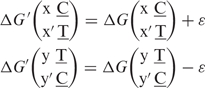 |
12 |
for every pair of complementary nucleotides x, x′ and y, y′ leaves the total ΔG invariant, as it can be verified directly from Equation (6). Similar reparametrizations are possible for mismatches of type AG, AC and TG. Next to these there are three invariances of ΔΔG that involve a reparametrization of both mismatch and matching dinucleotide parameters. Hence one has at least seven zero eigenvalues in XT X. A more detailed discussion of degeneracies of XT X can be found in the online Supplementary Material.
RESULTS AND DISCUSSION
Control of the quality of the experiments
As a control of the reproducibility of the result, we consider the intensities correlation between analogous spots in replicated experiments. The replicated hybridizations were carried out on two microarrays of the same slide, with two identical but separately synthesized and labeled target oligos, at the same manually prepared concentration in solution Table 3. Figure 1 is an example thereof. It shows correlation plots between two replicated hybridizations. Two plots are shown, one with the full 15K intensities (Figure 1a) and one in which the median of the intensities of the 15 replicated spots are taken (Figure 1b). In the former some data spreading is observed, which is greatly reduced when the median over 15 replicated spots is taken. Note that the experimental data do not align perfectly on the diagonal of the graph, this may be attributed to the manual preparation of the solutions or to differences in the oligos (synthesis or labeling). Data from different microarrays are aligned on a line of slope equal to one in the log–log plots of Figure 1, which implies a linear relationship between the intensities. In general, replicates show a strong correlation between median intensities, which is an indication of a good reproducibility of the results. We included in this median the probes with and without poly(A) spacer. No significant difference was found in the intensities from spots with poly(A) and without poly(A) spacer. From this point on, the median intensity of 15 replicates is always used and simply referred to as the intensity of a probe, and because of the good reproducibility we will only discuss the data produced by hybridizations with oligo synthesis a (Table 3).
Figure 1.

Correlation plots for intensities in two replicated experiments at 50 pM for oligo 3a (x-axis) and oligo 3b (y-axis); these are the Experiments 3–4 and 3–8 in Table 2. (a) The total intensities. (b) Only the median intensities taken for the 15 replicated spots. The dashed line has slope equal to one.
Data analysis with ΔGsol
Next, we consider the relation between the intensities and the corresponding ΔGsol for hybridizations in solution with one or two mismatches. In the case of two mismatches ΔGsol was calculated as the sum of nearest neighbor parameters for individual mismatches, assuming that the presence of two mismatches does not involve additional terms in the free energy, i.e. they do not interact. In the experiment the minimal distance between two mismatches is 5 nt, which is considered sufficient, in first approximation to support the non-interaction assumption. In the calculation of ΔG from the tabulated values of ΔH and ΔS the temperature was set to the experimental value T = 65°C.
Figure 2a shows plots of the intensities versus −ΔΔGsol as taken from the nearest neighbor model with the existing tabulated values for hybridization in solution [see (6) and references therein]. ΔΔGsol is obtained by subtracting from all free energies that of the PM sequence, which is taken as a reference. As a consequence, for the PM intensities ΔΔGsol = 0. Each plot in Figure 2 contains 1006 data points obtained from the median value of the 15 replicated spots on each array.
Figure 2.

(a) Plot of the intensities as functions of −ΔΔGsol, the difference of hybridization free energy with respect to the perfect match free energies, from nearest neighbor free energies obtained from melting experiments in solution. With this choice of parameters the perfect match is located at ΔΔG = 0. The different plots correspond to concentrations of 50, 500 and 5000 pM (from bottom to top). The lines drawn have slopes corresponding to 1/RT, with T = 65° C = 338 K the experimental temperature. (b) Behavior of three concentration data as predicted from the Langmuir model [Equation (2)].
As it is well-known from several studies of melting/hybridization in aqueous solution (7), the hybridization free energy ΔGsol depends on the buffer conditions, and in particular of the ionic strenght of the solution. Particularly studied was the effect of salt concentration (NaCl), which is usually assumed to be independent of sequence, but to be dependent on oligonucleotide length. Melting experiments in solution are consistent with the following dependence on Na ion concentration (7)
| 13 |
where ΔGsol (1 M [Na+]) is measured at 1 M NaCl, N is the number of phosphates in the sequence and a is a constant. To our knowledge, the salt effect on sequences with internal mismatches has not been investigated yet, as measurements were done at 1 M NaCl (6). However, salt has mostly an effect on interactions with the negatively charged phosphate molecules. It is hence plausible to expect the same type of correction as Equation (13) also for sequences carrying mismatches. If that is the case, the salt dependence cancels out from ΔΔGsol, which is the quantity we are interested in. In the rest of the article, we will set the value at 1 M NaCl in ΔGsol.
Figure 2a shows the data for Experiment 1 at three different concentrations, from bottom to top of 50, 500 and 5000 pM. When plotted as functions of −ΔΔGsol, the data points tend to cluster along single monotonic curves. This already suggests a fair degree of correlation between ΔGsol and ΔGμarray. The experiment at 5000 pM shows a pronounced saturation of the intensities, as expected from the Langmuir model [Equation (2)]. Sufficiently far from saturation one expects a linear relationship between the logarithm of the intensity and ΔG, as given by Equation (4). Figure 2 shows that the low concentration data at low intensities follow approximately a straight line with the slope 1/RT expected from equilibrium thermodynamics at T = 65 °C, which is the experimental temperature.
However, the global behavior of the three concentrations is at odds with the Langmuir model, which predicts that intensity versus free energy plots for different concentrations should saturate at a common intensity value A, as indicated in Figure 2b. Although one may expect some variations on A from experiment to experiment, the data of Figure 2a are hard to reconcile with the Langmuir model. We conclude that the hybridization data deviate from the full Langmuir model of Equation (2), but they are in rather good agreement with its limiting low intensities behavior [Equation (4)]. In order to obtain estimates of the free energies ΔΔGμarrays from microarray data, we will use then Equation (4) and restrict ourselves to the lower concentration data. The analysis of the higher concentration regime is presented in the online Supplementary Material.
Fitting the free energy parameters
To fit the 58 parameters of the nearest neighbor model we use the lowest concentration data, i.e. 50 pM. Hereto we applied the algebraic procedure explained in Materials and methods section, which fits the logarithm of the ratios I/IPM and which assumes that the data can be described by Equation (7). For low concentrations this assumption is expected to be correct for the lower intensities but not for the highest intensities, which deviate from the Langmuir isotherm as shown in Figure 2. This poses a problem for the fitting procedure since it was designed with the perfect match intensity IPM as a reference [Equation (7)]. One may think to circumvent this problem by restricting the fit to low intensities, for instance only to probes with two mismatches and rewrite Equation (7) using as reference not IPM, but for instance one of the intensities of a probe with two internal mismatches. This procedure turns out to be of little practical use for our purposes which is to estimate the free energy difference between perfect matching sequences and sequences with one or multiple mismatches and for which the PM reference value is necessary (a more detailed discussion is in the online Supplementary Material).
From the analysis of plots of intensity versus −ΔΔGsol (Figure 2), one finds that the PM intensity is systematically lower than that predicted by Equation (4), which is the straight line in Figure 2a. Hence, the relative intensities I/IPM of the probes that contain mismatches are systematically higher than those predicted by Equation (4). Consequently, a direct fit of the experimental data to Equation (7) underestimates the effect of a mismatch, which will result in free-energy penalties that are too small. The result of the fit is shown in Figure 3. One can notice that the ΔΔG range is indeed smaller than the one from hybridization in solution (Figure 2). Moreover, the underestimation of ΔΔG is more severe for probes with two mismatches than for those with only one, since ΔΔG is a sum of contributions per mismatch. This produces a discontinuity of the curve from double to single mismatches. The appearance of this discontinuity is another evidence of the fact that Equation (4) is not valid in the full range of intensities.
Figure 3.

Ratios of intensities and perfect match intensities versus −ΔΔGμarray, the relative hybridization free energy between two strands as obtained from a fit to Equation (7). Three distinct groups of points are indicated: PM for perfect match, 1 MM for probes with a single internal mismatch and 2 MM for probes with two mismatches. The dashed line in is drawn as a guide to the eye.
In order to solve this problem, one would need to fit the data with a more general model I(c,ΔG) that incorporates the observed deviations from Equation (4). As mentioned above, and as shown explicitely from the data analysis in the online Supplementary Material, the deviations cannot be described within the general Langmuir model [Equation (2)]. At present, it is not yet clear which alternative model to use for I(c,ΔG). Moreover, the choice of this model may considerably influence the fitted nearest neighbor parameters. A safer compromise is to start from the observation that Equation (4) is followed by the large majority of the low concentration data points in Figure 2. Hence a fit to the low concentration limit of the Langmuir model seems reasonable. Unfortunately, one of the points deviating from Equation (4) is the PM intensity, which is used as reference measure. In order to calibrate the fit correctly one should reweight the reference PM intensity. We therefore fit the data against Equation (7) using instead of the actual PM intensity as a reference, a rescaled value IPM* = α IPM, which is the value the PM intensity would have if the data would agree with Equation (4) in the whole intensity range. We estimate α from the crossing of the 50 pM fitting line in Figure 2a with the ΔΔG = 0 axis. This estimate is α = 30. The effects of a change in α on the fitting parameters will be discussed below.
Figure 4a–d show the result of the fit to Equation (7), using α = 30. In the main frames each experiment is fitted independently. In the insets, the free-energy parameters are obtained from a simultaneous fit of all 50 pM experiments. The latter data produce more accurate parameters, as they come from using four independent experiments (the four experiments at 50 pM, oligo synthesis a, in Table 3), hence the 58 parameters are obtained on sampling over 1006 × 4 data points. Both the free-energy range and the continuity of the curves in Figure 4 are now as expected. The data show very little spreading in comparison with the curves in Figure 2a. A quantification of the spreading for a monotonic curve can be assessed by the Spearman's; rank correlation coefficient, which for all four experiments is very close to 1 (the values are given in the caption of Figure 4). This is an indicator of the reliability of the nearest neighbor fitted parameters. The ratio of data points over tuning parameters is as large as 4024/58, which ought to yield a reliable fit. Moreover, although the data are fitted to a linear model, all four experiments show a clear deviation for the highest intensities. This is an indication against overfitting, which would result in a fully linear curve with erroneous fitting parameters. Therefore, we conclude that the deviations from the Langmuir isotherm observed in all four experiments is a robust feature of the system and that the resulting free-energy parameters are physically meaningful. We also verified that the free-energy parameters obtained from the fit are quite stable whether one fits the whole set of experimental data, or whether the fit is restricted to the lowest intensity scales (e.g. I/IPM* ≤ 5 × 10⁻³) where all data clearly follow Equation (4). This is because the large majority of experimental points in Figure 4 are located in the lowest intensity scales, anyhow. Hence, this additional data filtering has little effects on the parameters.
Figure 4.

Plot of I/IPM* where IPM* = α IPM (where we took α = 30 as explained in the text) as function of the nearest neighbor fitted −ΔΔGμmarray. The alignment of the intensities onto single monotonic curves is a proof of the good quality of the fits. In the main frame the four different experiments were fitted separately. The insets show the date from intensities of each experiments, but the fit was done globally on all experiments at 50 pM. As a measurement of the goodness of the fits the Spearman's; rank correlation coefficient was used. This coefficient is for the main frames plots (a–d): 0.9860, 0.9911, 0.9866 and 0.9867. For the four plots in the insets the correlation coefficients are: 0.9732, 0.9705, 0.9748 and 0.9699. The two straight lines in the first main frame correspond to slopes 1/RT where we took Texp = 65° C} = 338 K for the experimental temperature and Teff =850 K.
Table 4 shows the free-energy parameters ΔΔGμarray as obtained from the above fitting procedure. Because of the degeneracies mentioned above [see e.g. Equation (12) and (18)], the dinucleotide parameters are not uniquely determined. Triplet parameters are, however, unique, and these are given in the table. The ΔΔG for triplets are defined, for instance
| 14 |
where the upper strand is 5′-3′ oriented. The lower strand is the invariant target sequence, the upper strand is the probe sequence. Hence the ΔΔG parameters are measured subtracting the reference perfect match probe. Note that because of this subtraction one has
| 15 |
as the reference PM sequence is different in the two cases.
Table 4.
Free-energy differences ΔΔG(kcal/mol) unique parameters obtained from fitting microarray data to Equation (7)
| X\Y | A | C | G | T | A | C | G | T | A | C | G | T | A | C | G | T | ||||
|---|---|---|---|---|---|---|---|---|---|---|---|---|---|---|---|---|---|---|---|---|
| A | 2.2 | 2.0 | 2.4 | 2.2 | 3.0 | 2.8 | 3.0 | 3.0 | 2.5 | 1.8 | 2.5 | 2.2 | 2.4 | 2.2 | 2.4 | 2.5 | ||||
| C | XAY | 2.3 | 2.1 | 2.5 | 2.4 | XAY | 3.0 | 2.8 | 3.0 | 3.0 | XAY | 2.5 | 1.7 | 2.5 | 2.1 | XCY | 2.4 | 2.2 | 2.4 | 2.5 |
| G | X′AY′ | 1.9 | 1.8 | 2.2 | 2.0 | X′CY′ | 2.7 | 2.5 | 2.7 | 2.7 | X′GY′ | 2.4 | 1.6 | 2.4 | 2.0 | X′AY′ | 2.0 | 1.8 | 2.1 | 2.1 |
| T | 2.2 | 2.1 | 2.5 | 2.3 | 3.1 | 2.9 | 3.1 | 3.1 | 2.4 | 1.7 | 2.5 | 2.1 | 2.4 | 2.2 | 2.4 | 2.5 | ||||
| A | 3.9 | 3.4 | 3.4 | 4.0 | 2.5 | 2.4 | 2.4 | 2.8 | 1.5 | 1.3 | 1.7 | 1.7 | 2.4 | 1.8 | 2.3 | 1.9 | ||||
| C | XCY | 3.4 | 3.0 | 2.9 | 3.5 | XCY | 2.4 | 2.3 | 2.3 | 2.7 | XGY | 1.7 | 1.6 | 1.9 | 1.9 | XGY | 2.7 | 2.1 | 2.6 | 2.2 |
| G | X′CY′ | 3.1 | 2.7 | 2.7 | 3.2 | X′TY′ | 2.5 | 2.5 | 2.5 | 2.8 | X′AY′ | 1.1 | 0.9 | 1.3 | 1.3 | X′GY′ | 2.5 | 1.9 | 2.4 | 2.0 |
| T | 3.8 | 3.4 | 3.3 | 3.9 | 2.5 | 2.5 | 2.4 | 2.8 | 1.7 | 1.6 | 2.0 | 2.0 | 2.8 | 2.2 | 2.7 | 2.3 | ||||
| A | 2.0 | 1.8 | 1.9 | 1.9 | 3.5 | 3.6 | 3.1 | 3.2 | 2.2 | 2.2 | 2.0 | 2.4 | 2.3 | 2.4 | 2.0 | 2.2 | ||||
| C | XGY | 1.6 | 1.4 | 1.5 | 1.5 | XTY | 3.2 | 3.3 | 2.8 | 3.0 | XTY | 2.3 | 2.3 | 2.1 | 2.5 | XTY | 2.1 | 2.2 | 1.7 | 2.0 |
| G | X′TY′ | 1.8 | 1.7 | 1.8 | 1.7 | X′CY′ | 3.1 | 3.2 | 2.8 | 2.9 | X′GY′ | 2.4 | 2.4 | 2.2 | 2.6 | X′TY′ | 2.4 | 2.5 | 2.1 | 2.4 |
| T | 1.6 | 1.4 | 1.6 | 1.5 | 3.2 | 3.3 | 2.9 | 3.0 | 2.3 | 2.3 | 2.1 | 2.5 | 2.2 | 2.3 | 1.9 | 2.1 |
The data refer to triplets with central mismatching nucleotides and flanking matching nucleotides. The convention is that the numbers correspond for say, a mismatch AGTTTA to a free-energy difference ΔG(AGTTTA) − ΔG(AATTTA). The upper strand has orientation 5′-3′. The error bar on the parameter is 0.2.
Using standard linear regression tools, we estimated the error bar on the parameters of Table 4 to be equal to 0.2. In order to compare with existing published data (6) we present in Table 5 the ΔΔGsol for triplets following the same notation as in Table 4. As mentioned before the data in solution are at T = 65°C and 1 M [Na+]. Figure 5 shows a plot of the two free energies ΔΔGμarray versus ΔΔGsol. A clear quantitative correlation between the two is observed. The Pearson correlation coefficient is 0.839. In comparing the two sets, we note that the 16 mismatches of CC appear to be the most deviating in the two cases.
Table 5.
Data as in Table 4 using the nearest neighbor parameters obtained from melting experiments in solution [see (6) and references therein]
| X\Y | A | C | G | T | A | C | G | T | A | C | G | T | A | C | G | T | ||||
|---|---|---|---|---|---|---|---|---|---|---|---|---|---|---|---|---|---|---|---|---|
| A | 1.3 | 2.0 | 2.3 | 2.0 | 2.9 | 3.6 | 3.5 | 2.6 | 2.3 | 1.7 | 2.9 | 1.8 | 1.4 | 1.8 | 2.1 | 1.8 | ||||
| C | XAY | 1.6 | 2.3 | 2.6 | 2.2 | XAY | 3.5 | 4.2 | 4.1 | 3.2 | XAY | 2.7 | 2.0 | 3.2 | 2.1 | XCY | 2.2 | 2.6 | 3.0 | 2.6 |
| G | X'A;Y′ | 1.6 | 2.3 | 2.6 | 2.3 | X'C;Y′ | 3.1 | 3.8 | 3.7 | 2.9 | X'G;Y′ | 2.6 | 2.0 | 3.2 | 2.1 | X'A;Y′ | 2.1 | 2.5 | 2.9 | 2.6 |
| T | 1.1 | 1.8 | 2.1 | 1.8 | 3.0 | 3.7 | 3.6 | 2.7 | 2.5 | 1.8 | 3.0 | 1.9 | 1.9 | 2.3 | 2.6 | 2.3 | ||||
| A | 3.4 | 4.3 | 4.4 | 4.5 | 2.2 | 2.5 | 2.3 | 2.2 | 0.8 | 0.8 | 1.3 | 1.0 | 2.1 | 1.6 | 2.6 | 1.7 | ||||
| C | XCY | 3.6 | 4.5 | 4.5 | 4.7 | XCY | 2.7 | 3.0 | 2.8 | 2.7 | XGY | 1.6 | 1.6 | 2.1 | 1.7 | XGY | 2.8 | 2.2 | 3.2 | 2.4 |
| G | X′CY′ | 3.1 | 4.0 | 4.1 | 4.2 | X′TY′ | 2.3 | 2.6 | 2.4 | 2.4 | X′AY′ | 0.7 | 0.7 | 1.1 | 0.8 | X′GY′ | 2.1 | 1.5 | 2.6 | 1.7 |
| T | 2.6 | 3.5 | 3.6 | 3.7 | 2.1 | 2.4 | 2.2 | 2.2 | 1.4 | 1.3 | 1.8 | 1.5 | 2.3 | 1.7 | 2.8 | 1.9 | ||||
| A | 2.0 | 1.7 | 1.7 | 1.7 | 3.3 | 3.6 | 3.6 | 3.1 | 2.4 | 2.2 | 2.4 | 2.5 | 2.5 | 2.8 | 2.4 | 2.6 | ||||
| C | XGY | 1.6 | 1.3 | 1.3 | 1.3 | XTY | 3.6 | 4.0 | 4.0 | 3.4 | XTY | 2.5 | 2.2 | 2.4 | 2.6 | XTY | 2.3 | 2.6 | 2.2 | 2.4 |
| G | X′TY′ | 1.4 | 1.1 | 1.1 | 1.1 | X′CY′ | 3.6 | 3.9 | 3.9 | 3.4 | X′GY′ | 2.6 | 2.4 | 2.6 | 2.7 | X′TY′ | 2.4 | 2.8 | 2.4 | 2.6 |
| T | 1.4 | 1.1 | 1.1 | 1.1 | 3.2 | 3.6 | 3.6 | 3.0 | 2.5 | 2.2 | 2.4 | 2.6 | 1.8 | 2.2 | 1.7 | 2.0 |
The data are at T = 65°C and at 1 M [Na+]. The error bar on these numbers, as established from (6) by assuming independence of terms, is 0.15.
Figure 5.

Comparison of data in Tables 4 and 5: the free-energy differences between a perfect matching hybridization and hybridization with an internal mismatch as obtained from data from (6) (ΔΔGsol) and from a fit of the microarray data (ΔΔGμarray). The results show a good quantitative correlation between the two quantities: the Pearson correlation coefficient is 0.839. The dashed line is the diagonal as a guide to the eye.
As discussed above, the fit was done with a re-scaled PM intensity, using a factor α = 30. We have repeated the analysis for other values of α. Varying α causes a global shift of the data in Table 4 by an α-dependent constant. This shift does not affect the slope or correlation of the data in Figure 5. By using α = 50 we found a positive shift of 0.17, while setting α = 20 produces a shift of −0.14. These two values of α are our estimate of the largest range of variability for this parameter. In general, the procedure of re-weighting the PM intensity with α introduces a global error ±0.2 affecting all parameters in Table 4.
CONCLUDING REMARKS
During the past decades, a considerable amount of research was devoted to the quantification of interactions among hybridizing nucleic acid strands in aqueous solution. This lead to a parametrization, via the nearest neighbor model, of the contribution to the total free energy in terms of dinucleotide pairs for perfect matching DNA/DNA (7), RNA/RNA (19) and DNA/RNA (20) duplexes, but also for strands with an internal mismatch (6). This large amount of data is currently used in various applications as for instance for calculation of DNA melting temperatures or for RNA secondary structure predictions. As it has been widely recognized (6,5,16), a similar effort for quantifying interactions in DNA microarrays is very important. This effort will lead to a better understanding of molecular interactions in DNA microarrays and ultimately on their functioning.
A precise quantification of interactions brings some challenges. First of all many different microarray platforms exist, they differ by the length of probe sequences and the way these are covalently linked to the solid surface. It is not unlikely that interactions between hybridizing strands are of slightly different nature in these different platforms. Hence, one should be careful for instance to generalize the results of this work to, say, Affymetrix GeneChips. In addition, in order to measure accurately interaction parameters, one needs a careful experimental setup in which possible competing reactions, as hybridization between partially complementary strands in solution, are absent. In the case of the present work, this was achieved by choosing a single sequence in solution hybridizing with perfect matching probe sequences with one or two internal mismatches. It is difficult to directly fit the free-energy parameters from complex biological experiments where the hybridizing solution contain a large number of interacting sequences. This may explain why in some cases poor correlations between ΔGsol and ΔGμarray was reported (10,11). One of the advantages of the experimental setup chosen in this work is that one can obtain in principle all parameters in a single experiment, as all hybridization reactions with one or two mismatches occur in ‘parallel’ on a single array. However, a drawback is that in this setup one can determine only the free energy and not the contribution of enthalpy and entropy separately, which would allow to extend the parameters to other temperatures.
In the present work, we focused on the determination of ΔΔG which is the free energy difference between a perfect matching hybridization and an hybridization where the probe sequences have one or more internal mismatches. Quantifying the effect of internal mismatches is important for a better understanding of cross-hybridization effect, which is the unintended binding of non-perfectly complementary sequences to a given probe. Moreover, this understanding could have some practical consequences for optimal probe design. An advantage of the parameter ΔΔG is that it is insensitive to the free-energy initiation parameter [Equation (5)] and the scaling factor A [Equation (2) and (4)] and that it is expected to be less sensitive to buffer conditions as ionic salt etc. Due to degeneracies, it is not possible to determine the 10 perfect match dinucleotide parameters directly from our experimental data (see online Supplementary Material). The determination of the perfect match parameters needs sampling perfect match hybridizations from a large number of target sequences. This requires a different and more complex experimental design.
The present work on custom Agilent arrays shows that there is a strong correlation, also on the quantitative scale, between ΔΔGsol and ΔΔGμarray. This correlation is shown in Figure 5 with explicit free-energy values given in Table 4 and 5. A fit of the interaction parameters from microarray data shows a much better agreement of the data with the thermodynamic models (compare Figure 2 with Figure 3). However, in the absence of dedicated experiments for the determination of interaction free energies on a DNA microarray, the results of this work suggest that one could use the corresponding hybridization free energies in solution as approximations for them. Recent work (9,15) has addressed the issue of the correlation between ΔGsol and ΔGμarray. Weckx et al. (9) considered oligonucleotide microarrays on Codelink-activated slides carrying one, two or three mismatches. The data plotted as a function of ΔGsol showed a good agreement with the Langmuir model, implying a fair correlation between ΔGsol and ΔGμarray. However, the number of data points was insufficient to perform a direct fit of the thermodynamic parameters from the microarray data. Fish et al. (15) performed a series of experiments on oligo sequences in solutions hybridizing to perfect match and to sequence carrying one to multiple mismatches. Their analysis included tandem mismatches, i.e. mismatches on neighboring sequence sites (in our case the minimal distance between mismatches is 5 nt). An overall correlation between ΔGsol and microarray intensities was observed, implying a correlation between ΔGsol and ΔGμarray. In these experiments, ΔGsol was measured directly from experiments in solution and did not rely on the nearest neighbor model parameters. As a correlation between ΔGsol and ΔGμarray has by now been observed in several different microarray platforms, it is fair to expect that such a correlation is a general feature of microarrays. However, an accurate determination of nearest neighbor parameters in other platforms would be very useful for a better quantification of this correlation.
An interesting issue is the deviation from the low concentration limit of the Langmuir model [Equation (4)]. These deviations cannot be explained by the full model of Equation (2). There are several underlying approximations in the Langmuir model, as for instance hybridization is always considered two state. The model also assumes that hybridizing strands, apart from forming a duplex, do not further interact with other strands at the surface. Moreover, Equations (2) and (4) apply to a system in thermal equilibrium. More investigations are necessary for a better understanding on the deviation from the Langmuir model found in this study. These will involve further experiments in different external conditions, e.g. different temperatures or salt concentrations as well as theoretical analysis, which are left for some future work.
It is interesting to remark that the deviation from the Langmuir model ‘enhances’ the cross-hybridization problem because there is a smaller effect on intensity for a given free energy penalty (smaller slope in Figure 4). As an example, a mismatch with ΔΔG = 2.5 kcal/mol (a typical value from Table 4) corresponds to a I/IPM ratio of ≈0.02 in the regime governed by the Langmuir model, compared to ≈0.2 in the deviating regime. This implies that in the deviating regime a significant fraction of the amount of target binding to a PM probe binds to a probe carrying one internal mismatch.
Although the origin of these deviations are not known, it is remarkable that the data appear to follow approximately two straight lines separated by a sharp kink (Figure 4). Although extensions of the Langmuir model in the context of DNA microarrays have been discussed (21), we are unaware of isotherms which could have a shape as shown in Figure 4. The presence of a second straigth line in the log plot implies that in this range the data still follow the thermodynamic model of Equation (4) but with a different ‘effective’ temperature than the experimental one. A linear regression to the data yields Teff ≈ 850 K, which is higher than the experimental temperature. It is interesting to point out that recent analysis (12,13) of Affymetrix GeneChip data use Langmuir model with ΔGsol rescaled to higher effective temperatures. A better understanding of the regime governed by an effective temperature may provide new insights on this issue.
SUPPLEMENTARY DATA
Supplementary Data are available at NAR Online.
FUNDING
Research Foundation Flanders, Fonds voor Wetenschappelijk Onderzoek (FWO) [grant G.0311.08]; Flemish Institute for Technological Research (VITO nv). Funding for open access charge: Fonds voor Wetenschappelijk Onderzoek.
Conflict of interest statement. None declared.
Supplementary Material
ACKNOWLEDGEMENTS
We thank Kizi Coeck and Karen Hollanders for expert technical assistance.
REFERENCES
- 1.Brown PO, Botstein D. Exploring the new world of the genome with DNA microarrays. Nature. 1999;21:33. doi: 10.1038/4462. [DOI] [PubMed] [Google Scholar]
- 2.Stoughton RB. Applications of DNA microarrays in biology. Annu. Rev. Biochem. 2005;74:53–82. doi: 10.1146/annurev.biochem.74.082803.133212. [DOI] [PubMed] [Google Scholar]
- 3.Bloomfield VA, Crothers DM, Tinoco I., Jr . Nucleic Acids Structures, Properties and Functions. Mill Valley: University Science Books; 2000. [Google Scholar]
- 4.Borer PN, Dengler B, Tinoco I, Uhlenbeck OC. Stability of ribonucleic acid double-stranded helices. J. Mol. Biol. 1974;86:843–853. doi: 10.1016/0022-2836(74)90357-x. [DOI] [PubMed] [Google Scholar]
- 5.Freier SM, Kierzek R, Jaeger JA, Sugimoto N, Caruthers MH, Neilson T, Turner DH. Improved free-energy parameters for predictions of RNA duplex stability. Proc. Natl Acad. Sci. USA. 1986;83:9373–9377. doi: 10.1073/pnas.83.24.9373. [DOI] [PMC free article] [PubMed] [Google Scholar]
- 6.SantaLucia J, Jr. , Hicks D. The thermodynamics of DNA structural motifs. Annu. Rev. Biophys. Biomol. Struct. 2004;33:415. doi: 10.1146/annurev.biophys.32.110601.141800. [DOI] [PubMed] [Google Scholar]
- 7.SantaLucia J., Jr A unified view of polymer, dumbbell, and oligonucleotide DNA nearest-neighbor thermodynamics. Proc. Natl Acad. Sci. USA. 1998;95:1460. doi: 10.1073/pnas.95.4.1460. [DOI] [PMC free article] [PubMed] [Google Scholar]
- 8.Fotin AV, Drobyshev AL, Proudnikov DY, Perov AN, Mirzabekov AD. Parallel thermodynamic analysis of duplexes on oligodeoxyribonucleotide microchips. Nucleic Acids Res. 1998;26:1515–1521. doi: 10.1093/nar/26.6.1515. [DOI] [PMC free article] [PubMed] [Google Scholar]
- 9.Weckx S, Carlon E, De Vuyst L, Van Hummelen P. Thermodynamic behavior of short oligonucleotides in microarray hybridizations can be described using Gibbs free energy in a nearest-neighbor model. J. Phys. Chem. B. 2007;111:13583. doi: 10.1021/jp075197x. [DOI] [PubMed] [Google Scholar]
- 10.Naef F, Magnasco MO. Solving the riddle of the bright mismatches: labeling and effective binding in oligonucleotide arrays. Phys. Rev. E. 2003;68:011906. doi: 10.1103/PhysRevE.68.011906. [DOI] [PubMed] [Google Scholar]
- 11.Zhang L, Miles MF, Aldape KD. A model of molecular interactions on short oligonucleotide microarrays. Nature Biotech. 2003;21:818. doi: 10.1038/nbt836. [DOI] [PubMed] [Google Scholar]
- 12.Held GA, Grinstein G, Tu Y. Modeling of DNA microarray data by using physical properties of hybridization. Proc. Natl Acad. Sci. USA. 2003;100:7575. doi: 10.1073/pnas.0832500100. [DOI] [PMC free article] [PubMed] [Google Scholar]
- 13.Carlon E, Heim T. Thermodynamics of RNA/DNA hybridization in high-density oligonucleotide microarrays. Physica A. 2006;362:433. [Google Scholar]
- 14.Fiche JB, Buhot A, Calemczuk R, Livache T. Temperature effects on DNA chip experiments from surface plasmon resonance imaging: isotherms and melting curves. Biophys. J. 2007;92:935. doi: 10.1529/biophysj.106.097790. [DOI] [PMC free article] [PubMed] [Google Scholar]
- 15.Fish DJ, Horne MT, Brewood GP, Goodarzi JP, Alemayehu S, Bhandiwad A, Searles RP, Benight AS. DNA multiplex hybridization on microarrays and thermodynamic stability in solution: a direct comparison. Nucleic Acids Res. 2007;35:7197–7208. doi: 10.1093/nar/gkm865. [DOI] [PMC free article] [PubMed] [Google Scholar]
- 16.Pozhitkov AE, Tautz D, Noble PA. Oligonucleotide microarrays: widely applied–poorly understood. Brief Funct. Genomic. Proteomic. 2007;6:141–148. doi: 10.1093/bfgp/elm014. [DOI] [PubMed] [Google Scholar]
- 17.Peyret N, Seneviratne PA, Allawi HT, SantaLucia J., Jr Nearest-neighbor thermodynamics and NMR of DNA sequences with internal AA, CC, GG and TT mismatches. Biochemistry. 1999;38:3468. doi: 10.1021/bi9825091. [DOI] [PubMed] [Google Scholar]
- 18.Gray DM. Derivation of nearest-neighbor properties from data on nucleic acid oligomers. I. Simple sets of independent sequences and the influence of absent nearest neighbors. Biopolymers. 42:783–793. doi: 10.1002/(sici)1097-0282(199712)42:7<783::aid-bip4>3.0.co;2-p. [DOI] [PubMed] [Google Scholar]
- 19.Xia T, SantaLucia J, Burkard ME, Kierzek R, Schroeder SJ, Jiao X, Cox C, Turner DH. Thermodynamic parameters for an expanded nearest-neighbor model for formation of RNA duplexes with Watson-Crick base pairs. Biochemistry. 1998;37:14719–14735. doi: 10.1021/bi9809425. [DOI] [PubMed] [Google Scholar]
- 20.Sugimoto N, Nakano S, Katoh M, Matsumura A, Nakamuta H, Ohmichi T, Yoneyama M, Sasaki M. Thermodynamic parameters to predict stability of RNA/DNA hybrid duplexes. Biochemistry. 1995;34:11211. doi: 10.1021/bi00035a029. [DOI] [PubMed] [Google Scholar]
- 21.Vainrub A, Pettitt BM. Coulomb blockage of hybridization in two-dimensional DNA arrays. Phys. Rev. E. 2002;66:041905. doi: 10.1103/PhysRevE.66.041905. [DOI] [PubMed] [Google Scholar]
Associated Data
This section collects any data citations, data availability statements, or supplementary materials included in this article.