Abstract
Respiratory gating and tumor tracking for dynamic multileaf collimator delivery require accurate and real-time localization of the lung tumor position during treatment. Deriving tumor position from external surrogates such as abdominal surface motion may have large uncertainties due to the intra- and interfraction variations of the correlation between the external surrogates and internal tumor motion. Implanted fiducial markers can be used to track tumors fluoroscopically in real time with sufficient accuracy. However, it may not be a practical procedure when implanting fiducials bronchoscopically. In this work, a method is presented to track the lung tumor mass or relevant anatomic features projected in fluoroscopic images without implanted fiducial markers based on an optical flow algorithm. The algorithm generates the centroid position of the tracked target and ignores shape changes of the tumor mass shadow. The tracking starts with a segmented tumor projection in an initial image frame. Then, the optical flow between this and all incoming frames acquired during treatment delivery is computed as initial estimations of tumor centroid displacements. The tumor contour in the initial frame is transferred to the incoming frames based on the average of the motion vectors, and its positions in the incoming frames are determined by fine-tuning the contour positions using a template matching algorithm with a small search range. The tracking results were validated by comparing with clinician determined contours on each frame. The position difference in 95% of the frames was found to be less than 1.4 pixels (∼0.7 mm) in the best case and 2.8 pixels (∼1.4 mm) in the worst case for the five patients studied.
Keywords: optical flow, tumor tracking
INTRODUCTION
Respiratory motion in the thorax and abdomen makes precise radiation delivery difficult. Tumor motion of up to 3 cm during quiet breathing in the lung, liver, and kidney has been reported.1, 2, 3, 4, 5, 6, 7, 8, 9 Before introduction of 4DCT and gated treatment, a large margin is added to account for tumor motion, creating large planning target volumes (PTV), and increasing the volume of normal tissue irradiated.
Respiratory gating has the potential to improve treatment outcome by irradiating only during a portion of the respiratory cycle, thereby permitting reduction of the safety margin.5, 10, 11, 12, 13, 14, 15, 16, 17, 18, 19, 20, 21, 22 Another research effort has been made to shape the radiation beam to synchronously follow the tumor motion using a dynamic multileaf collimator (DMLC).12, 23, 24, 25, 26, 27, 28, 29, 30, 31, 32, 33, 34, 35, 36, 37, 38, 39 Implementation of this method also requires accurate real-time localization of the tumor position during the treatment.
Kubo and Hill13 proposed a method to estimate the tumor position through monitoring an external surface marker. This method assumes that the correlation between motion of the external surface marker and the internal tumor is stable throughout the treatment, which may not be true. Mageras et al.40 observed a 0.7 s respiratory phase delay between diaphragm motion and external markers for patients having impaired lung function. Vedam et al.19 found that the abdominal surface or diaphragm motion may or may not fully correlate to the lung tumor motion, and Ahn et al.41 reported that the correlation may depend on the location and the direction of the lung tumor movement. Thus, deriving the internal tumor motion from external markers for respiratory gating may not be reliable. Shirato et al.17 developed a method to fluoroscopically monitor internal implanted markers that are inserted near the lung tumor. This provides accurate tumor location during treatment delivery. However, it requires an invasive procedure to implant the markers bronchoscopically.
Previously, Berbeco et al.42 derived a respiratory signal from the averaged intensity variation of a rectangular region of interest (ROI) containing the lung tumor in fluoroscopic video. Motion enhancement was applied to all the video frames and a template was generated by averaging all the ROIs of the frames at the end of exhale (EOE). The correlation coefficient (CC) of the same ROI of an incoming frame and the template was calculated to determine if the beam should be enabled or not. Cui et al.43 further developed two methods to generate templates as the references and compared to the template chosen by Berbeco et al.42 The respiratory signals generated by all three methods were evaluated against the reference gating signal as manually determined by a radiation oncologist. The clustering method demonstrated the best performance in terms of accuracy and computational efficiency. These reports focus more on determining the phase of a moving tumor and generating the respiratory gating signal for beam on or off, instead of tracking the physical position of the lung tumor.
In this article, we present an algorithm that can track the geometric location of a lung tumor or relevant anatomic features in fluoroscopic video. The algorithm combines optical flow and template matching to track a tumor (or a feature) frame by frame and affords the determination of its position in each frame. We demonstrate the accuracy of this algorithm by comparing its results with those manually determined by a clinician.
MATERIALS AND METHODS
Optical flow analysis
Optical flow is a technique that uses a two-dimensional velocity vector field to quantify the apparent motion of independent objects moving in sequential video frames.44 A particular frame, the reference frame, is selected and a clearly identifiable object of interest, which in our case is the tumor or a feature near the tumor in the lung, is delineated. The optical flow is computed from changes in the pixel values (intensity) between the frames. Calculating the optical flow between the reference and any other frame provides the “optical velocity” of the object so that its position in the new frame can be derived.
We assume that the intensity of the object in the image does not change between frames, so that
| (1) |
where I(x,y,t) is the intensity of the object at pixel (x,y) at time t and I(x+dx,y+dy,t+dt) is the intensity of the same object now at pixel (x+dx, y+dy) in the new frame at time t+dt. If the intensity varies slightly and slowly, histogram matching of two images is recommended as a preprocessing step. Equation 1 can be expanded as a Taylor series when dx, dy, and dt are small,
| (2) |
where Ix, Iy, It denote the partial derivatives of I with respect to x, y, and t; O(∂2) are the high-order terms of the Taylor series. By ignoring the high-order terms in Eq. 2, and combining Eqs. 1, 2, we obtain
| (3) |
where u and v are the velocities in the x and y directions, respectively. Equation 3 is known as the gradient constraint equation with two unknown variables, u(x,y,t) and v(x,y,t). For a rigid object, u and v are spatially constant for all pixels within the object, but may vary with time.
A variety of algorithms has been developed to derive the motion velocities, u and v.44, 45, 46, 47, 48, 49, 50, 51, 52, 53, 54, 55, 56 A complete review and comparisons of these algorithms are available in the literature.57, 58 Overall, the algorithm developed by Lucas and Kanade was claimed by both groups to have the best performance, and was therefore chosen for our rigid motion tracking process. The algorithm divides the tracked image into small blocks, and the motion vectors for these blocks are calculated individually. For a small block containing only two pixels, we assume that the motion vectors for these 2 pixels are the same. Thus, Eq. 4 is obtained according to Eq. 3,
| (4) |
where u(x1,y1,t)=u(x2,y2,t)=u, and similarly for v. The motion vectors, u and v, can be found by solving Eq. 4.
In general, because of noise in the fluoroscopic imaging system, these equations will not be strictly satisfied. Normally, a larger block R is considered for motion vector calculation and a 5×5 pixel block is selected in our application. From Eq. 3, now we have 25 equations involving u(x1,y1,t),u(x2,y2,t),…u(x25,y25,t) and v(x1,y1,t),v(x2,y2,t),…v(x25,y25,t). If we denote the central pixel by (xc,yc) and set all velocities equal to u(xc,yc,t) and v(xc,yc,t), then we obtain a set of 25 equations similar to those in Eq. 4. Clearly, these are a set of overdetermined linear equations and are not satisfied for any particular values of u(xc,yc,t) and v(xc,yc,t). The assumption that motion vectors for the pixels in R vary smoothly is made and verified by visually checking the tumor movement in the fluoroscopic video. Thus, a least-square technique is applied to minimize the squared error and obtain the optical flow for this block. A Gaussian filter, g(x,y), is applied that is peaked at the central pixel and so gives more weight to pixels nearer to the center to reduce the temporal aliasing caused by the video camera system. The squared error can be expressed as an error function,
| (5) |
where ⊗ is the 2D convolution operator. After differentiating the error function with respect to (u,v) and setting it to zero, we obtain the optical flow,
| (6) |
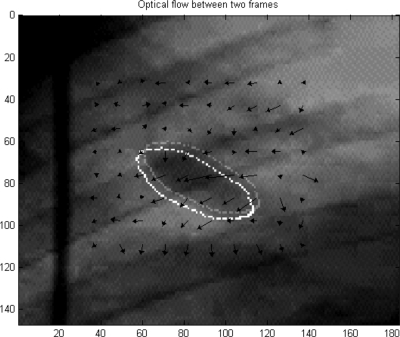
Figure 1 is the vector interpretation of optical flow between two frames for a small region in the fluoroscopic video. The arrows indicate the pixel motion direction between two frames and the arrow lengths correspond to the pixel “velocities.” The boundaries of the objects from these frames are overlaid, indicating the motions tracked by the algorithm.
Figure 1.
Vector interpretation of optical flow between two frames. The position of the object in the new frame (lower left) is obtained by displacing the original object position (upper right) by the average optical velocity within it.
Tumor motion tracking
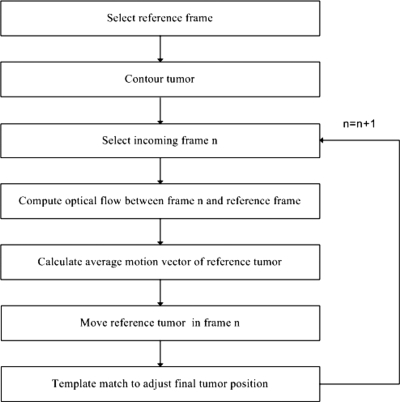
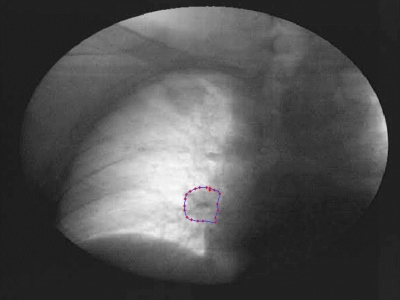
The flowchart of the tumor tracking algorithm is shown in Fig. 2. The tumor contour in the initial reference frame is either manually drawn by a clinician or automatically transferred from a digitally reconstructed radiograph (DRR).59 Approximately 20 pixels evenly distributed around the tumor contour are chosen and the boundary is determined by a cubic-spline interpolation of their geometric positions. The contour in the initial image frame for patient A is shown in Fig. 3. Once the tumor contour is determined, the pixels within the contour are labeled to identify the object to be tracked.
Figure 2.
Flowchart of the motion tracking algorithm.
Figure 3.
Tumor contour in the initial reference frame for patient A.
Suppose now we are trying to track the tumor position in frame n. To expedite the search process, a small rectangular area that fully includes the tumor and its range of motion is defined as the ROI. The optical flow for all pixels in the ROI of frame n is calculated with respect to the same ROI in the reference frame. The maximum tumor movements typically ranged from 20–40 pixels in the fluoroscopic videos for the patients studied. However, the optical flow calculation algorithm we selected, the Lucas and Kanade algorithm, achieves high accuracy only for objects with small displacements (1–2 pixels∕frame) and fails for larger displacements.51 Obviously, most tumor shifts in the fluoroscopic video are much larger than 1–2 pixels Thus, a multiresolution scheme was selected for the optical flow calculation.46, 60
The multiresolution scheme first generates a set of images with different levels of resolution. We refer L0 to L4 to different resolution levels where L0 is the lowest level of resolution and L4 is the original image. One pixel in the images at L0 is obtained by averaging a 16×16 pixel block in the original image at L4. Similarly, L1 is obtained by averaging each 8×8 pixel block in the image at L4 and so forth for L2 and L3. Suppose the pixel having the largest motion in the tumor moves 32 pixels in both x and y directions between the two images at L0. It is not appropriate to calculate optical flow directly since the shift is too large. However, in the images at L0, the shift becomes 2 pixels. The optical flow between these two images at L0 is first calculated and, for instance, this pixel in frame n at L0 should move 1.6 pixels (u and v) in x and y directions as calculated. We then start to process the images at L1, where 2×2 pixels in this level is equivalent to 1 pixel at L0. We first use the optical flow calculated from L0 as guidance to shift the pixels in the frame n at L1. For the pixel having the largest motion at L0, the corresponding 2×2 pixel block in frame n at L1 is shifted by 3.2 pixels (2u and 2v) in both x and y direction due to the resolution difference between L0 and L1. After all the pixels in frame n at L1 are shifted, the optical flow between the shifted frame n at L1 and the reference image at L1 is calculated. The calculation of optical flow continues for these two images at different levels until the level L0 is reached.
As we observed, the intensities of the pixels inside the labeled tumor area are not exactly the same for different frames. Thus, small differential motions may exist within the tumor even if it were to move entirely as a rigid body. Since the motion vectors vary in both magnitude and direction for pixels in the tumor, to improve the robustness of tracking, in this work we assume rigid tumor motion and thus obtain the tumor displacement by averaging over the pixels inside the tumor. This approach reduces the effect of uncertainties caused by the random noise during the tracking process. Once the averaged global motion vectors are calculated, we obtain the tumor position shift between two frames and estimate the tumor position based on its reference position according to Eq. 7 and Eq. 8,
| (7) |
| (8) |
where Xn and Yn are the estimated centroid coordinates of the tumor in frame n, Xref and Yref are the centroid coordinates of the tumor in the reference frame, ⟨uN⟩ and ⟨vN⟩ are the average pixel displacements in the x and y directions between the reference frame and frame N.
There are uncertainties in the calculation of the global motion vectors due to noise and underestimation of optical flow in the uniform area. Uncertainties can also be caused by ignoring higher order terms in Eq. 2 when calculating optical flow. The object position estimated with optical flow can be fine-tuned by using a template matching process. With template matching, an exhaustive search within a small region around the tumor position is performed. The correlation coefficient (CC) between the pixel values of the object in the reference frame and the pixel values of the object in the new frame (n) is computed. The object position is moved in the new frame over the entire search range. The final position is determined by the location where the CC reaches a maximum value. A search range of ±5 pixels was used to fine-tune the tumor position.61 This procedure was repeated for all frames.
Validation
Fluoroscopic videos from five patients were validated. Three of these fluoroscopic videos were from the anterior-posterior (AP) perspective and two from the lateral (LAT). The outlines of tracked objects (tumors or nearby anatomical features) were superimposed on the fluoroscopic videos. The centroid position of the tracked object was calculated. To validate the tracking results, the contour of the object from the reference frame was first superimposed on all of the other video frames. A radiation oncologist then manually moved the contour in each frame to the correct position in his judgment. The centroid of the contour as placed by the clinician was then compared to that computed by the tracking algorithm.
Respiratory signal
The CC between the object pixels in the reference frame and those in the tracked frame were computed to investigate if CC would provide a respiratory signal. After the object is tracked in all the frames, its geometry position is known. The tracked object in all other frames is then aligned with the reference object position and CC between the reference and tracked object is calculated. The values of the CC were compared with the cranial-caudal shift of the object as a function of frame (time).
RESULTS
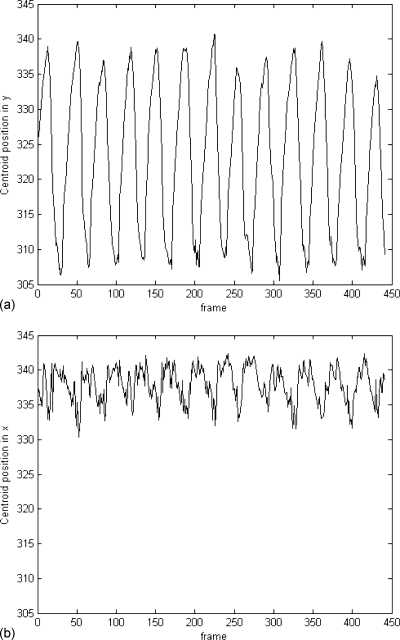
Fluoroscopic videos from five patients were analyzed. Three of these fluoroscopic videos were from the anterior-posterior (AP) perspective and two from the lateral (LAT). The outlines of tracked objects (tumors or nearby anatomical features) were superimposed on the fluoroscopic videos. The centroid position of the tracked object was calculated. For the AP videos, this yields the displacements in the lateral (x) and cranial-caudal (y) directions with respect to the reference position and for the LAT videos the displacements in the anterior-posterior (x) and cranial-caudal (y) directions. Some of the contoured objects are the features near the tumor sites. Tracking of these features may still be useful since tumors may not be visible in fluoroscopic images for some patients, yet their motion may be inferred by the nearby structures that they are in contact with. Over all the patients, the maximum displacements in the cranial-caudal direction vary from 17 to 36 pixels, whereas in the lateral or anterior-posterior directions they are much smaller and most of them are less than 10 pixels. The pixel size corresponds to approximately 0.5 mm at the isocenter. The object displacements for patient A are shown in Fig. 4. The predominant object motion was in the cranial-caudal direction and motion in the anterior-posterior or lateral direction was much noisier due to the high-frequency cardiac motion depending on fluoroscopic projection for all patients.
Figure 4.
Cranial-caudal (y) and lateral (x) displacements for patient A. Vertical scale is pixel and the pixel resolution is 0.5×0.5 mm.
For all patients, the contours followed the general motion of the objects without drifting away for the approximately 20–40 s (200–400 frames) and 10 respiratory cycles of a typical video. Objects that did not significantly deform were well tracked, consistent with our assumption of a rigid object. The boundaries of objects that deform were not well described by the tracked outlines. However, the predominant motions of the objects were well tracked and the contour of the object moves following the centroid movement of the object in the fluoroscopic video through visual inspection.
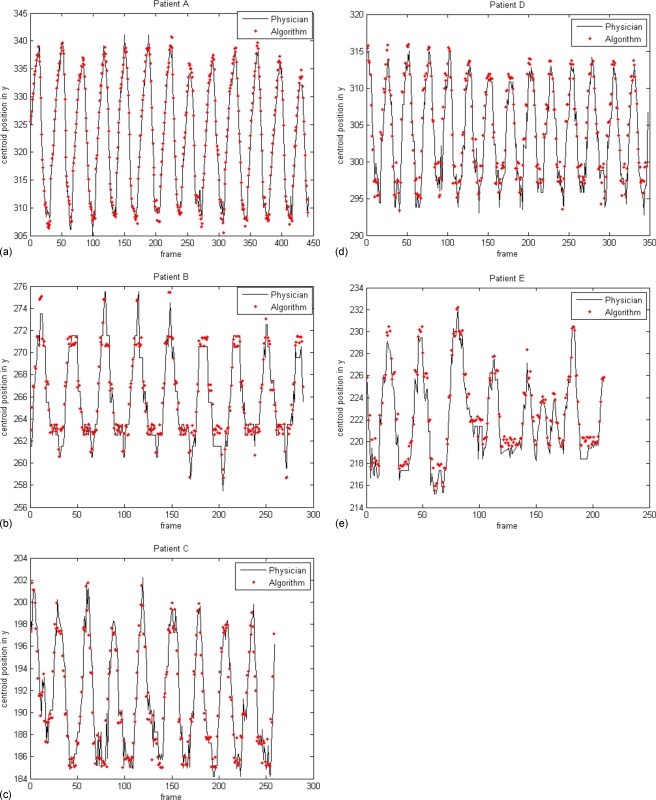
The centroid positions in the cranial-caudal direction calculated by the tracking algorithm and those determined by the clinician are overlaid in Fig. 5 for all five patients. The difference between centroid positions in 95% of the frames was found to be less than 1.4 pixels for the best case and 2.8 pixels for the worst case of the five patients studied as listed in Table 1, depending on the object sites and shapes. The maximum differences for all the frames vary from 2.0 to 6.6 pixels for all the patients. Also, the mean and standard deviation of the differences for different phases (EOI, EOE, and intermediate phases) are listed in Table 2.
Figure 5.
Displacement validation of the tracked objects in y direction (positions in pixels with 0.5×0.5 mm pixel resolution).
Table 1.
Error analysis for the tracking results using validated displacements.
| Patient A | Patient B | Patient C | Patient D | Patient E | |
|---|---|---|---|---|---|
| Mean difference(pixel) | 1.17 | 1.04 | 0.57 | 1.33 | 0.83 |
| Max difference(pixel) | 4.48 | 5.01 | 2.04 | 6.64 | 2.56 |
| Max difference for95% frames (pixel) | 2.74 | 2.83 | 1.36 | 2.68 | 1.90 |
| Moving range(pixel) | 35.16 | 16.77 | 16.70 | 22.52 | 16.69 |
Table 2.
Error analysis for different breathing phases. All units are pixel.
| Patient A | Patient B | Patient C | Patient D | Patient E | ||||||
|---|---|---|---|---|---|---|---|---|---|---|
| Mean | Std | Mean | Std | Mean | Std | Mean | Std | Mean | Std | |
| EOI (peak) | 1.30 | 0.87 | 1.19 | 1.07 | 0.53 | 0.46 | 0.87 | 0.50 | 0.91 | 0.62 |
| EOE (valley) | 1.05 | 0.88 | 0.81 | 0.68 | 0.58 | 0.37 | 1.60 | 0.99 | 0.73 | 0.49 |
| Intermediate phase | 1.14 | 0.73 | 1.26 | 0.95 | 0.59 | 0.38 | 1.40 | 0.77 | 0.86 | 0.56 |
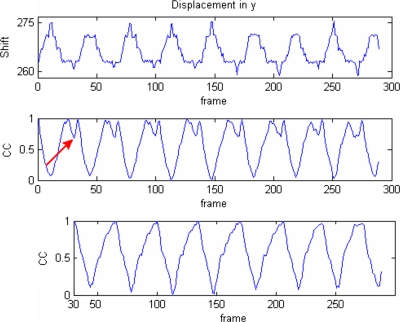
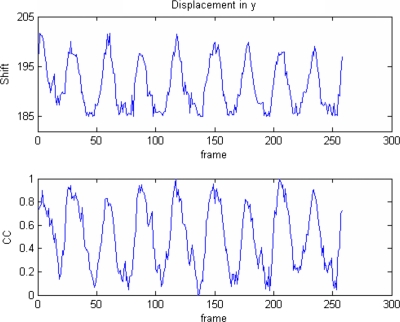
Berbeco et al.42 observed that the mean intensity of a region containing moving objects in fluoroscopic video varies during breathing. They also computed the CC between the reference template and the ROIs of all other frames to generate a gating signal. We used the intensity variation by calculating CC to improve the confidence of the object tracking results. For patient B, the plots of CC and displacements in the cranial-caudal are shown in the top and middle of Fig. 6, where the reference frame was chosen to be a few frames after the end of expiration. When inspiration starts, the object expands and the image intensity increases (becomes less dark). The CC between the object in the reference and other frames also decreases when the displacement increases until reaching the EOI, where the intensity of the object becomes the highest. When expiration starts, similarly the intensity of the object decreases (becomes darker) and CC increases since the object moves back to the reference position. When the object moves until a few frames before the end of expiration where the reference position is defined, CC reaches the maximum value (the first peak). The object looks the same a few frames before or after the end of expiration. The object continues moving and becomes darker than at the reference position so that the CC starts to decrease until it reaches the EOE (the valley between two peaks) and the object intensity reaches a minimum value. Similarly, after the starting of inspiration, the object moves towards the reference position (intensity increases) and CC increases until it reaches the reference position (the second peak). The CC decreases afterwards since the object moves away from the reference position and the intensity continues to increase. When we choose the reference right at the EOI, the double-peak effect disappears (bottom of Fig. 6). Thus, by choosing the reference frame at either the EOI or EOE, a respiratory signal with sinusoidal shape can be obtained. For patient B, the displacement and the respiratory signal have reversed phases since the reference is chosen at the EOI. Another example from patient C where the reference is chosen at the EOE is shown in Fig. 7, and both signals have the same phases.
Figure 6.
Comparison between displacement and CC with different reference frames from patient B (shift in pixels). The respiratory signal in the middle is generated using the reference frame selected a few frames after the EOI. The arrow shows the position of the new reference frame at the EOI and the bottom is the respiratory signal generated using the new reference frame in which the double peaks disappear.
Figure 7.
Comparison between displacement and CC from patient B. The reference frame is chosen at the EOE so that both displacement and CC have the same phase.
DISCUSSION
Errors in tracking arise from several factors, including optical flow calculation, irregular patient breathing, cardiac motion, and fluoroscopic video noise. The error caused by the optical flow calculation is partially compensated by the final template matching with a small search range. The Lucas and Kanade algorithm has the advantage of comparative robustness to noise and was used here since noise is quite common for fluoroscopic imaging. It also has a relatively low computation requirement. As mentioned in Sec. 2B, the Lucas and Kanade algorithm only considers the first-order derivatives of image intensity and ignores higher order terms in the Taylor series expansion [Eq. 2]. This method is suitable for an object with small displacement and has larger uncertainties when the displacement is large. This weakness was addressed by calculating optical flow using a multiresolution scheme.
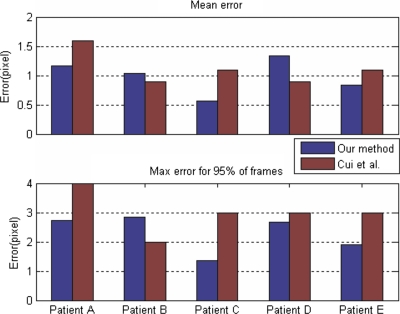
For regular breathing, the tracking algorithm generates smooth object displacements. For the error analysis we listed in Table 1, we find larger tumor movement leads to relative larger maximum tracking errors calculated from all the frames for all the patients except for patient B. For 95% of the frames, the maximum tracking errors for all the patients are similar. But the mean errors for larger tumor movement (patient A and D) are all larger than those from patient B, C, and E with smaller tumor movement. As we observed, larger tumor movement normally leads to more tumor shape variation or elastic deformation, which increases tracking uncertainties and causes relatively larger tracking errors. For the tracking errors corresponding to different breathing phases, we do not observe significant differences between phases, and the errors may be more dependent on patient breathing patterns and tracking sites. If irregular breathing occurs, the generated displacements have more uncertainty, especially near the end of inhale or exhale. Tumor or object motion may also be influenced by cardiac motion, the rib cage, lung function, and patient thickness too. In our case, cardiac motion caused uncertainties in lateral or anterior-posterior displacements for objects located near the heart. Our tracking results are also compared to those published from the same group62 since the same patient and golden standard data are used as shown in Fig. 8. Only the results from method 2 (eigenspace tracking) of Cui et al.62 are compared to ours since it has relatively smaller tracking errors. The overall performances for both eigenspace and optical flow-based methods are comparable. For mean tracking errors, our tracking errors for patient A, C, and E are smaller and the eigenspace tracking works better for patient B and D. As for the maximum error for 95% of the frames, our results are better than those from the eigenspace-based method except for patient B.
Figure 8.
Comparison of tracking errors between our method and Cui et al. (Ref. 62).
Our algorithm is efficient compared to exhaustive template searching. An object that has a range of N+1 pixels requires a minimum search range of ±N∕2 pixels if the reference image is in the center of the motion. Thus, a minimum of (N+1)2 template positions must be compared for each frame. For the set of patients examined in this study, a range of 36 pixels was found, and tracking with this method would therefore require 1369 different template positions. For our method, only 121 matched templates are needed after the optical flow calculation. Of course, the search range may be reduced significantly in the exhaustive template searching method if the reference template is updated frame by frame. However, in this scenario, the search error is cumulative so that the tracked object may drift away from the search range and fail to be tracked.
Reference frame selection does not affect the tracking results if the object shape remains the same for all frames. To generate a respiratory signal, the reference frame needs to be chosen carefully. The reference frame needs to be chosen very close to the EOI or EOE so that the double-peak effect will disappear. The selection of EOI or EOE can generate a respiratory signal with reversed phases. When using the rigid tracking algorithm on objects that deform, the reference frame should be a frame that is most representative of the object shape over the breathing cycle. We observed large elastic object deformation in only one of the five patients in our study, patient A. The centroid was tracked well, but the boundary was not. Special care needs to be taken for patients with a tumor in the lower lobe of the lung near the diaphragm and with large tumor movement. In both cases, elastic tumor deformation can occur and our rigid tracking algorithm may not work well. Our future efforts will focus on the tracking of deformable tumor contours.
CONCLUSION
For accurate dose delivery to a moving lung tumor, it is critical to track its internal motion in a noninvasive way. The tumor tracking method described here using fluoroscopic video could provide such tracking of the tumor centroid. This method has potential for gated delivery techniques where the beam is turned on and off based on the tumor location while maintaining the same radiation fluence.
ACKNOWLEDGMENTS
This work was partially supported by research grants from NIH (1 R21 CA110177-01A1) and Varian Medical Systems, Inc.
References
- Aruga T. et al. , “Target volume definition for upper abdominal irradiation using CT scans obtained during inhale and exhale phases,” Int. J. Radiat. Oncol., Biol., Phys. 10.1016/S0360-3016(00)00610-6 48, 465–469 (2000). [DOI] [PubMed] [Google Scholar]
- Davies S. C., Hill A. L., Holmes R. B., Halliwell M., and Jackson P. C., “Ultrasound quantitation of respiratory organ motion in the upper abdomen,” Br. J. Radiol. 67, 1096–1102 (1994). [DOI] [PubMed] [Google Scholar]
- Ekberg L., Holmberg O., Wittgren L., Bjelkengren G., and Landberg T., “What margins should be added to the clinical target volume in radiotherapy treatment planning for lung cancer?,” Radiother. Oncol. 10.1016/S0167-8140(98)00046-2 48, 71–77 (1998). [DOI] [PubMed] [Google Scholar]
- Hanley J. et al. , “Deep inspiration breath-hold technique for lung tumors: The potential value of target immobilization and reduced lung density in dose escalation,” Int. J. Radiat. Oncol., Biol., Phys. 10.1016/S0360-3016(99)00154-6 45, 603–611 (1999). [DOI] [PubMed] [Google Scholar]
- Ohara K., Okumura T., Akisada M., Inada T., Mori T., Yokota H., and Calaguas M. J., “Irradiation synchronized with respiration gate,” Int. J. Radiat. Oncol., Biol., Phys. 17, 853–857 (1989). [DOI] [PubMed] [Google Scholar]
- Ross C. S., Hussey D. H., Pennington E. C., Stanford W., and Doornbos J. F., “Analysis of movement of intrathoracic neoplasms using ultrafast computed tomography,” Int. J. Radiat. Oncol., Biol., Phys. 18, 671–677 (1990). [DOI] [PubMed] [Google Scholar]
- Shimizu S. et al. , “High-speed magnetic resonance imaging for four-dimensional treatment planning of conformal radiotherapy of moving body tumors,” Int. J. Radiat. Oncol., Biol., Phys. 10.1016/S0360-3016(00)00624-6 48, 471–474 (2000). [DOI] [PubMed] [Google Scholar]
- Shimizu S. et al. , “Three-dimensional movement of a liver tumor detected by high-speed magnetic resonance imaging,” Radiother. Oncol. 10.1016/S0167-8140(98)00140-6 50, 367–370 (1999). [DOI] [PubMed] [Google Scholar]
- Shirato H., Seppenwoolde Y., Kitamura K., Onimura R., and Shimizu S., “Intrafractional tumor motion: Lung and liver,” Semin. Radiat. Oncol. 14, 10–18 (2004). [DOI] [PubMed] [Google Scholar]
- Berbeco R. I., Jiang S. B., Sharp G. C., Chen G. T. Y., Mostafavi H., and Shirato H., “Integrated radiotherapy imaging system (IRIS): Design considerations of tumour tracking with linac gantry-mounted diagnostic x-ray systems with flat-panel detectors,” Phys. Med. Biol. 10.1088/0031-9155/49/2/005 49, 243–255 (2004). [DOI] [PubMed] [Google Scholar]
- Jiang S. B., “Radiotherapy of mobile tumors,” Geriatr. Nephrol. Urol. 16, 239–248 (2006). [DOI] [PubMed] [Google Scholar]
- Keall P., Kini V. R., Vedam S. S., and Mohan R., “Motion adaptive x-ray therapy: A feasibility study,” Phys. Med. Biol. 10.1088/0031-9155/46/1/301 46, 1–10 (2001). [DOI] [PubMed] [Google Scholar]
- Kubo H. D. and Hill B. C., “Respiration gated radiotherapy treatment: A technical study,” Phys. Med. Biol. 10.1088/0031-9155/41/1/007 41, 83–91 (1996). [DOI] [PubMed] [Google Scholar]
- Mageras G. S. and Yorke E., “Deep inspiration breath hold and respiratory gating strategies for reducing organ motion in radiation treatment,” Semin. Radiat. Oncol. 14, 65–75 (2004). [DOI] [PubMed] [Google Scholar]
- Minohara S., Kanai T., Endo M., Noda K., and Kanazawa M., “Respiratory gated irradiation system for heavy-ion radiotherapy,” Int. J. Radiat. Oncol., Biol., Phys. 10.1016/S0360-3016(00)00524-1 47, 1097–1103 (2000). [DOI] [PubMed] [Google Scholar]
- Schweikard A., Glosser G., Bodduluri M., Murphy M., and Adler J. R., “Robotic motion compensation for respiratory movement during radiosurgery,” Comput. Aided Surg. 5, 263–277 (2000). [DOI] [PubMed] [Google Scholar]
- Shirato H. et al. , “Physical aspects of a real-time tumor-tracking system for gated radiotherapy,” Int. J. Radiat. Oncol., Biol., Phys. 10.1016/S0360-3016(00)00748-3 48, 1187–1195 (2000). [DOI] [PubMed] [Google Scholar]
- Vedam S. S., Keall P., Kini V. R., and Mohan R., “Determining parameters for respiration-gated radiotherapy,” Med. Phys. 10.1118/1.1406524 28, 2139–2146 (2001). [DOI] [PubMed] [Google Scholar]
- Vedam S. S., Kini V. R., Keall P. J., Ramakrishnan V., Mostafavi H., and Mohan R., “Quantifying the predictability of diaphragm motion during respiration with a noninvasive external marker,” Med. Phys. 10.1118/1.1558675 30, 505–513 (2003). [DOI] [PubMed] [Google Scholar]
- Wong J. W., Sharpe M. B., Jaffray D. A., Kini V. R., Robertson J. M., Stromberg J. S., and Martinez A. A., “The use of active breathing control (ABC) to reduce margin for breathing motion,” Int. J. Radiat. Oncol., Biol., Phys. 10.1016/S0360-3016(99)00056-5 44, 911–919 (1999). [DOI] [PubMed] [Google Scholar]
- Xu Q. and Hamilton R. J., “A novel respiratory detection based on automated analysis of ultrasound diaphragm video,” Med. Phys. 10.1118/1.2178451 33, 916–921 (2006). [DOI] [PubMed] [Google Scholar]
- Zhang T., Keller H., O’Brien M. J., Mackie T. R., and Paliwal B., “Application of the spirometer in respiratory gated radiotherapy,” Med. Phys. 10.1118/1.1625439 30, 3165–3171 (2003). [DOI] [PubMed] [Google Scholar]
- Agazaryana N. and Solberg T. D., “Segmental and dynamic intensity-modulated radiotherapy delivery techniques for micro-multileaf collimator,” Med. Phys. 10.1118/1.1578791 30, 1758–1767 (2003). [DOI] [PubMed] [Google Scholar]
- D’Souza W. D., Naqvi S. A., and Yu C. X., “Real-time intra-fraction-motion tracking using the treatment couch: A feasibility study,” Phys. Med. Biol. 10.1088/0031-9155/50/17/007 50, 4021–4033 (2005). [DOI] [PubMed] [Google Scholar]
- Jiang S. B., Bortfeld T., Trofimov A., Rietzel E., Sharp G., Choi N., and Chen G. T. Y., “Synchronized moving aperture radiation therapy (SMART): Treatment planning using 4D CT data,” in Proc. 14th Conf. on the Use of Computers in Radiation Therapy, Seoul, South Korea, 2004, pp. 429–432.
- Kamath S., Sahni S., Palta J., and Ranka S., “Algorithms for optimal sequencing of dynamic multileaf collimators,” Phys. Med. Biol. 10.1088/0031-9155/49/1/003 49, 33–54 (2004). [DOI] [PubMed] [Google Scholar]
- Liu H. H., Verhaegen F., and Dong L., “A method of simulating dynamic multileaf collimators using Monte Carlo techniques for intensity-modulated radiation therapy,” Phys. Med. Biol. 10.1088/0031-9155/46/9/302 46, 2283–2298 (2001). [DOI] [PubMed] [Google Scholar]
- Loi G. et al. , “Design and characterization of a dynamic multileaf collimator,” Phys. Med. Biol. 10.1088/0031-9155/43/10/033 43, 3149–3155 (1998). [DOI] [PubMed] [Google Scholar]
- Ma L., Boyer A. L., Xing L., and Ma C.-M., “An optimized leaf-setting algorithm for beam intensity modulation using dynamic multileaf collimators,” Phys. Med. Biol. 10.1088/0031-9155/43/6/019 43, 1629–1643 (1998). [DOI] [PubMed] [Google Scholar]
- Neicu T., Berbeco R., Wolfgang J., and Jiang S. B., “Synchronized moving aperture radiation therapy (SMART): Improvement of breathing pattern reproducibility using respiratory coaching,” Phys. Med. Biol. 10.1088/0031-9155/51/3/010 51, 617–636 (2006). [DOI] [PubMed] [Google Scholar]
- Neicu T., Shirato H., Seppenwoolde Y., and Jiang S. B., “Synchronized moving aperture radiation therapy (SMART): Average tumour trajectory for lung patients,” Phys. Med. Biol. 10.1088/0031-9155/48/5/303 48, 587–598 (2003). [DOI] [PubMed] [Google Scholar]
- Papiez L. and Rangaraj D., “DMLC leaf-pair optimal control for mobile, deforming target,” Med. Phys. 10.1118/1.1833591 32, 275–285 (2005). [DOI] [PubMed] [Google Scholar]
- Papiez L., Rangaraj D., and Keall P., “Real-time DMLC IMRT delivery for mobile and deforming targets,” Med. Phys. 10.1118/1.1987967 32, 3037–3048 (2005). [DOI] [PubMed] [Google Scholar]
- Rangaraj D. and Papiez L., “Synchronized delivery of DMLC intensity modulated radiation therapy for stationary and moving targets,” Med. Phys. 10.1118/1.1924348 32, 1802–1817 (2005). [DOI] [PubMed] [Google Scholar]
- Suh Y., Yi B., Ahn S., Lee S., Kim J., Shin S., and Choi E., “Adaptive field shaping to moving tumor with the compelled breath control: A feasibility study using moving phantom,” in Proc. World Congress in Medical Physics, Sydney, Australia, 2003.
- Vedam S., Docef A., Fix M., Murphy M., and Keall P., “Dosimetric impact of geometric errors due to respiratory motion prediction on dynamic multileaf collimator-based four-dimensional radiation delivery,” Med. Phys. 10.1118/1.1915017 32, 1607–1620 (2005). [DOI] [PubMed] [Google Scholar]
- Webb S., “The effect on IMRT conformality of elastic tissue movement and a practical suggestion for movement compensation via the modified dynamic multileaf collimator (dMLC) technique,” Phys. Med. Biol. 10.1088/0031-9155/50/6/009 50, 1163–1190 (2005). [DOI] [PubMed] [Google Scholar]
- Webb S., “Quantification of the fluence error in the motion-compensated dynamic MLC (DMLC) technique for delivering intensity-modulated radiotherapy (IMRT),” Phys. Med. Biol. 10.1088/0031-9155/51/7/L01 51, L17–21 (2006). [DOI] [PubMed] [Google Scholar]
- Webb S., Hartmann G., Echner G., and Schlegel W., “Intensity-modulated radiation therapy using a variable-aperture collimator,” Phys. Med. Biol. 10.1088/0031-9155/48/9/310 48, 1223–1238 (2003). [DOI] [PubMed] [Google Scholar]
- Mageras G. S. et al. , “Fluoroscopic evaluation of diaphragmatic motion reduction with a respiratory gated radiotherapy system,” J. Appl. Clin. Med. Phys. 10.1120/1.1409235 2, 191–200 (2001). [DOI] [PMC free article] [PubMed] [Google Scholar]
- Ahn S. et al. , “A feasibility study on the prediction of tumour location in the lung from skin motion,” Br. J. Radiol. 10.1259/bjr/64800801 77, 588–596 (2004). [DOI] [PubMed] [Google Scholar]
- Berbeco R. I., Mostafavi H., Sharp G. C., and Jiang S. B., “Towards fluoroscopic respiratory gating for lung tumours without radiopaque markers,” Phys. Med. Biol. 10.1088/0031-9155/50/19/004 50, 4481–4490 (2005). [DOI] [PubMed] [Google Scholar]
- Cui Y., Dy J. G., Sharp G. C., Alexander B., and Jiang S. B., “Robust fluoroscopic respiratory gating for lung cancer radiotherapy without implanted fiducial markers,” Phys. Med. Biol. 10.1088/0031-9155/52/3/015 52, 741–755 (2007). [DOI] [PubMed] [Google Scholar]
- B. Horn K. P. and Schunck B. G., “Determining optical flow,” Artif. Intell. 10.1016/0004-3702(81)90024-2 17, 185–203 (1981). [DOI] [Google Scholar]
- Anandan P., “Measuring visual motion from image sequences,” Ph.D. dissertation, University of Massachusetts, Amherst, MA (1987). [Google Scholar]
- Anandan P., “A computational framework and an algorithm for the measurement of visual motion,” Int. J. Comput. Vis. 10.1007/BF00158167 2, 283–310 (1989). [DOI] [Google Scholar]
- Black M. J. and Anandan P., “A framework for the robust estimation of optical flow,” in Proc. Int. Conf. on Computer Vision, Berlin, Germany, 1993, pp. 231–236.
- Fleet D. J. and Jepson A. D., “Computation of component image velocity from local phase information,” Int. J. Comput. Vis. 10.1007/BF00056772 5, 77–104 (1990). [DOI] [Google Scholar]
- Heeger D. J., “Optical flow using spatiotemporal filters,” Int. J. Comput. Vis. 10.1007/BF00133568 1, 279–302 (1988). [DOI] [Google Scholar]
- Lucas B. D., “Generalized image matching by the method of differences,” Ph.D. dissertation, Carnegie Mellon University (1984). [Google Scholar]
- Lucas B. D. and Kanade T., “An iterative image registration technique with an application to stereo vision,” in Proc. Imaging Understanding Workshop (1981), pp. 121–130.
- Nagel H. H., “On the estimation of optical flow: Relations between different approaches and some new results,” Artif. Intell. 33, 298–324 (1987). [Google Scholar]
- Singh A., “An estimation-theoretic framework for image-flow computation,” in Proc. IEEE of CVPR, Osaka, Japan, 1990, 168–177.
- Singh A., Optical Flow Computation: A Unified Perspective (IEEE Computer Society Press, Los Alamitos, CA, 1992). [Google Scholar]
- Uras S., Girosi F., Verri A., and Torre V., “A computational approach to motion perception,” Biol. Cybern. 10.1007/BF00202895 60, 79–97 (1988). [DOI] [Google Scholar]
- Waxman A. M., Wu J., and Bergholm F., “Convected activation profiles and receptive fields for real time measurement of short range visual motion,” in Proc. Conf. Comput. Vis. Patt. Recog., Ann Arbor, MI, 1988, pp. 717–723.
- Barron J. L., Fleet D. J., and Beauchemin S. S., “Performance of optical flow techniques,” Int. J. Comput. Vis. 10.1007/BF01420984 12, 43–77 (1994). [DOI] [Google Scholar]
- Galvin B., McCane B., Novins K., Mason D., and Mills S., “Recovering motion fields: An evaluation of eight optical flow algorithms,” in Proc. of the Ninth British Machine Vision Conference, Southampton, UK, 1998, Vol. 1, pp. 195–204.
- Tang X., Sharp G., and Jiang S. B., “Patient setup based on lung tumor mass for gated radiotherapy (Abstract),” Med. Phys. 33, 2244 (2006). [Google Scholar]
- Odobez J. M. and Bouthemy P., “Robust multiresolution estimation of parametric motion models,” J. Visual Commun. Image Represent 10.1006/jvci.1995.1029 6, 348–365 (1995). [DOI] [Google Scholar]
- Duda R. O. and Hart P. E., Pattern Classification and Scene Analysis (Wiley-Interscience, New York, 1973). [Google Scholar]
- Cui Y., Dy J. G., Sharp G. C., Alexander B., and Jiang S. B., “Multiple template-based fluoroscopic tracking of lung tumor mass without implanted fiducial markers,” Phys. Med. Biol. 10.1088/0031-9155/52/20/010 52, 6229–6242 (2007). [DOI] [PubMed] [Google Scholar]


