Abstract
In cochlear implant surgery, an electrode array is permanently implanted in the cochlea to stimulate the auditory nerve and allow deaf people to hear. A minimally invasive surgical technique has recently been proposed—percutaneous cochlear access—in which a single hole is drilled from the skull surface to the cochlea. For the method to be feasible, a safe and effective drilling trajectory must be determined using a preoperative CT. Segmentation of the structures of the ear would improve trajectory planning safety and efficiency and enable the possibility of automated planning. Two important structures of the ear, the facial nerve and the chorda tympani, are difficult to segment with traditional methods because of their size (diameters as small as 1.0 and 0.3 mm, respectively), the lack of contrast with adjacent structures, and large interpatient variations. A multipart, model-based segmentation algorithm is presented in this article that accomplishes automatic segmentation of the facial nerve and chorda tympani. Segmentation results are presented for ten test ears and are compared to manually segmented surfaces. The results show that the maximum error in structure wall localization is ∼2 voxels for the facial nerve and the chorda, demonstrating that the method the authors propose is robust and accurate.
Keywords: atlas-based segmentation, optimal path, model-based segmentation, cochlear implant, facial nerve, chorda tympani
INTRODUCTION
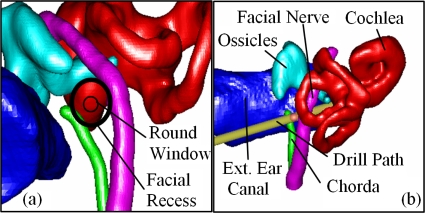
Cochlear implantation is a surgical procedure performed on individuals who experience profound to severe sensorineural hearing loss. In cochlear implant (CI) surgery, an electrode array is permanently implanted into the cochlea by threading the array into the basal turn, which is located at the round window shown in Fig. 1a. The array is connected to a receiver mounted securely under the skin behind the patient’s ear. When activated, the external processor senses sound, decomposes it (usually involving Fourier analysis), and digitally reconstructs it before sending the signal through the skin to the internal receiver, which then activates the appropriate intracochlear electrodes causing stimulation of the auditory nerve and the perception of hearing. Current methods of performing the surgery require wide excavation of the mastoid region of the temporal bone. This excavation procedure is necessary to safely avoid damaging sensitive structures but requires surgical time of at least 2 h. Recently, another approach has been proposed—percutaneous cochlear access—in which a single hole is drilled on a straight path from the skull surface to the cochlea.1, 2 The advantages of this technique are time saving and uniform insertion of the electrode array, which may be less damaging to inner ear anatomy.
Figure 1.
3D rendering of the structures of the left ear. (a) Left-right, posterior-anterior view. (b) Posterior-anterior view.
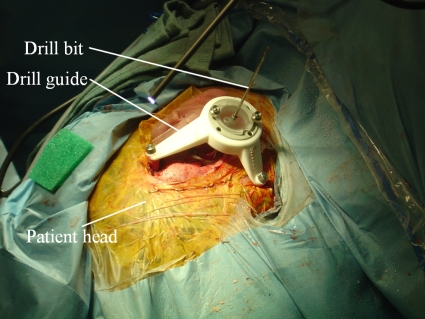
Percutaneous cochlear access is accomplished by using preoperative CT images to plan an appropriate drilling trajectory from which a drill guide is rapid prototyped. Prior to surgery, in the clinic, anchors are affixed to the patient’s skull by creating three small skin incisions and screwing self-tapping anchors into the bone. The incisions are stitched over the anchors, and a CT image of the patient is acquired. Using the image, a safe direct drilling trajectory from the skin surface to the cochlea is then selected. The anchors are localized, and a unique platform, which is used as a drill guide {STarFix™ microTargeting™ Platform [FDA 510(K)], No. K003776, Feb 23, 2001, FHC, Inc.; Bowdoin, ME} is manufactured for each patient using software designed to mathematically relate the location of the bone markers to the trajectory. On the day of surgery, the platform is mounted on the anchors and the drill is mounted on the guide. Figure 2 shows the platform mounted on the skull with a bit in place.
Figure 2.
Picture taken during clinical testing of percutaneous CI method.
One major difficulty with the percutaneous approach is the selection of a safe drilling trajectory. The preferred trajectory passes through the facial recess, a region approximately 1.0–3.5 mm in width bounded posteriorly by the facial nerve and anteriorly by the chorda tympani. Figure 1a shows a view along the preferred drilling trajectory, where the round window is located at the basal turn of the cochlea, and the facial recess is located at the depth of the facial nerve. The facial nerve, a tubular structure approximately 1.0–1.5 mm in diameter (∼3 voxels), is a highly sensitive structure that controls all movement of the ipsilateral face. If damaged, the patient may experience temporary or permanent facial paralysis. The chorda is a tubular structure approximately 0.3–0.5 mm in diameter (∼1 voxel). If the chorda is damaged, the patient may experience loss in the ability to taste. In our previous work studying the safety of CI drilling trajectories, in which error of the drill guide system was taken into account,3, 4 we have determined that safe trajectories planned for 1 mm diameter drill bits generally need to lie at least 1 mm away from both the facial nerve and the chorda. Fitting a trajectory in the available space can thus be difficult, and any planning error can have serious consequences.
During the planning process, the physician selects the drilling trajectory in the patient CT by examining the position of the trajectory with respect to the sensitive structures in 2D CT slices. This is difficult, even for experienced surgeons, because the size of the facial nerve and chorda and their curved shape makes them difficult to follow from slice to slice. The planning process would be greatly facilitated if these structures could be visualized in 3D, which requires segmentation. Segmentation of these structures is also necessary to implement techniques for automatically planning safe drilling trajectories for CI surgery.4
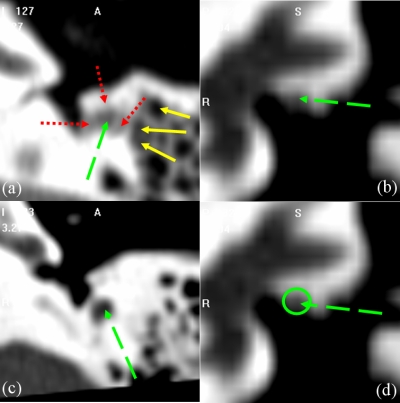
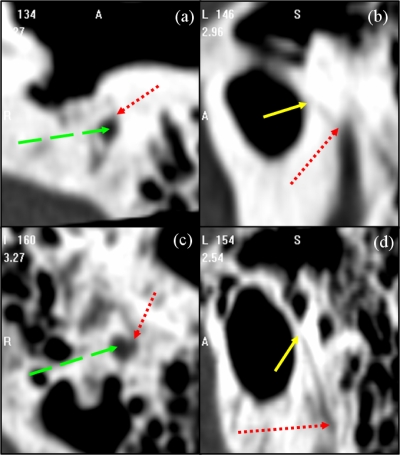
Atlas-based segmentation is a common technique, which relies on image registration, to perform automatic segmentation of general structures in medical images (see, for instance, Refs. 5, 6, 7, 8, 9). But one underlying assumption on which these methods are based is that the volumes to be registered are topologically equivalent. Even when this is the case, these methods are challenged by applications in which lack of local contrast makes intensity similarity measures used to drive the algorithms ineffectual. In our application, both the lack of local contrast and topological differences are issues. Indeed, the facial nerve and chorda are surrounded by structures of comparable intensity values and pneumatized bone. Pneumatized bone appears as voids within the bone, which can vary in number and location across subjects. These characteristics are visualized in Figs. 34. In Fig. 3, the facial nerve is identified by the dashed green arrow. Adjacent structures with boundaries that exhibit little contrast with the facial nerve are indicated by dotted red arrows. Several voids within the pneumatized bone (indicated by yellow solid arrows) of the subject in (a) do not appear in (c). The images in (b) and (d) show a portion of the facial nerve which lacks adequate contrast. Difficulties with the chorda are illustrated in Fig. 4. The dotted red arrows indicate one extremity of the chorda, at its branch from the facial nerve (indicated by green dashed arrows). The solid yellow arrows indicate the opposing extremity of the structure, where it exits the temporal bone. The chorda can be seen as the dark rift of intensities between these two arrows. The chorda of the subject in the top row branches from the facial nerve at a more anterior orientation and at a position approximately 5 mm more superior relative to the anatomy of the subject in the bottom row. As a result, the former chorda is much shorter and oriented at a different angle. Because of this lack of contrast and topological variation, atlas-based methods alone do not, in our experience, lead to results that are accurate enough. However, they can be used in conjunction with another technique as described below.
Figure 3.
Illustration of the complexity of the problem. Panels (a) and (c) are axial and (b) and (d) are coronal slices through the middle ear.
Figure 4.
Illustration of the shape variation of the chorda between two patients with highly visible anatomy. Patient 1 [(a),(b)] and 2 [(c),(d)] in axial [(a),(c)] and parasagittal [(b),(d)] view.
Figure 1 shows that the two structures of interest are tubular. A large body of literature exists, which describes methods designed to segment this type of structures (see, for instance, Refs. 10, 11, 12, 13, 14, 15, 16). However, the characteristics of our problem, i.e., partial volume effects due to the size of the structure, lack of clearly defined edges, and changes in the intensity characteristics along the structures’ length—dark in some section and bright in other sections—presents unique challenges for these methods. It is thus unlikely that, when used in isolation, these techniques could produce robust and accurate segmentations of the facial nerve and chorda tympani. However, when these methods are combined with an atlas-based method as described later, excellent results can be achieved. Among the various methods proposed to segment tubular structures, we have used a minimal cost path based approach.14, 15, 16 This type of algorithm extracts the structure centerline as the path of minimum cost from a starting to an ending point through the image. Typically, the function used to associate a cost to every connection between neighboring voxels involves terms derived from the image, such as intensity value or gradient. In general, however, the cost function is spatially invariant, i.e., it is computed the same way over the entire image. Spatial invariance is a severe limitation for our application because, as discussed earlier, the intensity characteristics of the structures of interest vary along the structures. These methods also typically do not use a priori geometric information. This is also a limitation for our application because the path of minimum cost, based on intensity values alone, does not always correspond to the structure centerline. As a consequence, a priori information about the shape of the structure is required to discriminate between correct and incorrect paths.
In this article, we propose a novel method that combines an atlas-based approach with a minimum cost path finding algorithm. The atlas is used to create a spatially varying cost function, which includes geometric information. Once the cost function is evaluated, a 3D minimum cost path is computed. This process is used to extract the centerline of the facial nerve and of the chorda. The centerlines are then expanded into the full structures using a level-set algorithm with a spatially varying speed function.
The remainder of this article is organized as follows. In Sec. 2, we describe how the structure models are created and used to segment images. The results that were obtained are presented in Sec. 3. We discuss these results in Sec. 4. Section 5 presents our conclusions and a few suggestions for future work.
MATERIALS AND METHODS
Data
Two sets of CT volumes acquired with IRB approval were used in this study. The first is the training set, and it consists of a total of 12 CT volumes, which include 15 ears unaltered by previous surgery. These images were all acquired on a Philips Mx8000 IDT 16 scanner. The second set, which is used as the testing set, consists of another 7 CT volumes, which include ten ears unaltered by previous surgery. These images were acquired from several scanners, including a Philips Mx8000 IDT 16, a Siemens Sensation Cardiac 64, and a Philips Brilliance 64. The scans were acquired at 120–140 kVp and exposure times of 265–1000 mA s. Typical resolutions were 768×768×300 voxels with voxel size of approximately 0.3×0.3×0.4 mm3.
Construction of the structure models
The model used in this work consists of (1) the centerline of the left facial nerve segmented manually in one reference CT volume, (2) the centerline of the left chorda segmented manually in the same CT volume, and (3) expected values for three characteristics at each voxel along these structures. A separate model for the right anatomy is not necessary since it can be approximated by reflecting the left model across the midsagittal plane without bias due to the symmetry of the left and right anatomy of the human head. The three expected characteristics, which have been used are (a) the width of the structure EW, (b) the intensity of the centerline EI, and (c) the orientation of the centerline curve EO. The expected values for each of the three structure characteristics have been computed from all 15 ears in the training set as follows.
(1) Aligning the images: First, one volume among the 12 training CT volumes was chosen as the reference volume, which will be referred to as A for atlas. Next, all the other training images are affinely registered to A to correct for large differences in scale and orientation between the volumes. This is performed in three steps. (a) The images are downsampled by a factor of 4 in each dimension, and transformations are computed by optimizing 12 parameters (translation, rotation, scaling, and skew) using Powell’s direction set method and Brent’s line search algorithm17 to maximize the mutual information18, 19 between the two images, where the mutual information between image A and B is computed as
| (1) |
with H(.) as the Shannon entropy in one image and H(.,.) as the joint entropy between these images. The entropy in the images is estimated as follows:
| (2) |
in which pi(i) is the intensity probability density function, which is estimated using intensity histograms with 64 bins. This step roughly aligns all the image volumes with the atlas. (b) The region of interest (ROI) that contains the ear, which has been manually identified in the atlas volume, is used to crop all ear images. (c) The cropped images are registered to the atlas ear at full resolution, using the same algorithm described above. Registering the images first at low resolution, then at high resolution on a region of interest, both speeds up the process and improves registration accuracy in the region of the ear.
(2) Extracting image data: To extract feature values from each individual CT volume in the training set, the structures of interest are first segmented by hand (note that manual segmentation is used only for the creation of the model). This produces binary structure masks from which a centerline is extracted using a topology preserving voxel thinning algorithm (see, for instance, Ref. 20). At each voxel along the centerlines, the intensity, structure width, and structure orientation are estimated. To estimate the width, the intersection of the mask with a plane perpendicular to the centerline is computed. Structure width is then estimated by averaging the lengths of radii cast in that plane to the edge of the structure mask at rotation intervals of π∕8 rad. The orientation of the centerline is estimated using a backward difference of the voxel locations with the exception of the first voxel, where a forward difference is used.
(3) Determining correspondence across model images: To establish a correspondence between points on the atlas centerline and points on the centerlines of each other volume, the atlas is registered nonrigidly to each of the volumes. This is done with an intensity-based nonrigid registration algorithm we have developed and called the adaptive bases algorithm.21 This algorithm models the deformation field that registers the two images as a linear combination of radial basis functions with finite support
| (3) |
where x is a coordinate vector in Rd, with d being the dimensionality of the images. Φ is one of Wu’s compactly supported positive radial basis functions,22 and the ci’s are the coefficients of these basis functions. The ci’s, which maximize the mutual information between the images, are computed through an optimization process, which combines steepest gradient descent and line minimization. The steepest gradient descent algorithm determines the direction of the optimization. The line minimization calculates the optimal step in this direction.
The algorithm is applied using a multiscale and multiresolution approach. The resolution is related to the spatial resolution of the images. The scale is related to the region of support and the number of basis functions. Typically, the algorithm is started on a low-resolution image with few basis functions with large support. The image resolution is then increased and the support of the basis function decreased. This leads to transformations that become more and more local as the algorithm progresses.
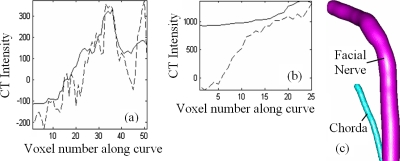
Once the registration step is completed, each of the points on the atlas centerline is projected onto each of the volumes in the training set using the corresponding nonrigid transformation. The point on a training volume’s centerline that is the closest to the projected point is found and a correspondence is established between these two points. For each point on the atlas centerline, this results in 14 corresponding points on the training volumes’ centerlines. Note that localizing the closest point on the training volumes’ centerline is required because registration is not perfect. As a consequence, the atlas centerline points projected onto the training volumes do not always fall on their centerlines. The expected feature values for each point on the atlas centerline are then computed as the average of the feature values of 15 points (one point in the atlas and 14 corresponding points in the other volumes). The facial nerve and chorda models generated with this method are shown in Fig. 5. In the plots, the solid lines are mean intensities along the model centerline curve for the facial nerve (a) and chorda (b). The dashed lines are intensities along the curve in the image chosen as the atlas. A clear change in intensities along the structures is visible.
Figure 5.
Model data. (a) and (b) show intensity data for the facial nerve and chorda. (c) illustrates the average structure orientation and width.
Structure segmentation
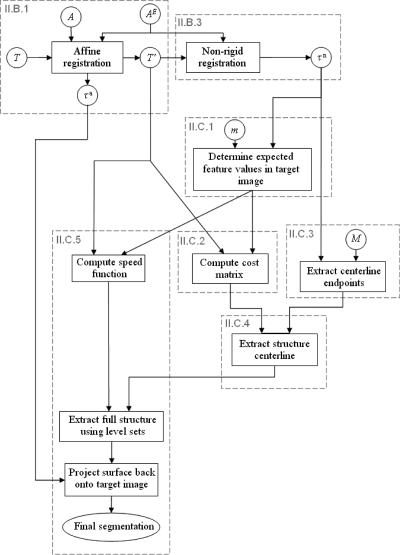
Once the models are built, they are used to segment new volumes. In Fig. 6, we present a general overview of the method we have developed for this purpose. Dashed boxes in this figure refer to sections in which the content of the box is discussed in more detail. In this figure, circles indicate an image (upper case roman letters), values associated with sets of voxels (lower case roman letters) or a transformation (greek letters). Rectangles are operations performed on the images. T is the target image, i.e., the image, which needs to be segmented, A is the entire atlas image, and AE is an atlas subimage that only contains the ear region. As discussed in Sec. 2B.(1) the target image is affinely registered first to the full atlas volume and then to the ear subvolume. This results in image T′ and an affine transformation τa. A nonrigid registration is then computed between T′ and AE to produce transformation τn. Note that segmentation of the structures of interest is performed on the images T′. This rescales and reorients the target image to match the atlas and permits using the a priori structure orientation information stored in the model. An alternative would be to register the atlas to the target but this would necessitate also reorienting the structures’ orientation information stored in the model. The transformation τn is used to associate each voxel in T′ with expected feature values using a method detailed in Sec. 2C1. Using T′, these expected feature values, and the cost function described in Sec. 2C2, costs are computed for all voxel connections in the range of T′ and stored in a cost matrix. The starting and ending points for each structure are localized also using transformation τn and masks M with a technique described in Sec. 2C3. Once the cost matrix is computed and the structure extremities localized, the structures’ centerlines are computed with a minimum cost path algorithm (see Sec. 2C4). Once the centerlines are found, the complete structures are extracted using the method described in Sec. 2C5. A speed function is first generated using expected feature values in the model, which are projected onto the image T′. Next, a level set-based algorithm is utilized to grow the centerlines into full structures. When the structures have been found in T′, they are projected back to T, which completes the process.
Figure 6.
Flow chart of the segmentation process.
Cost matrix for centerline segmentation: Concept
Minimum cost path algorithms require two pieces of information: (1) Starting and ending points and (2) a cost associated with the transitions from each point to its neighbors. To compute costs based on a priori information, i.e., intensity and orientation, stored for each point along the path in the atlas image, we use the following approach. First, the atlas centerline points are projected from the atlas to image T′ using τn. Next, for each voxel in T′, the closest projected point is found. The expected feature values for each voxel in T′ are then set to be the feature values of the closest projected point. The value of the cost matrix at each voxel v is then simply computed as the difference between the expected feature values and the feature values computed from the image at v. This approach permits to compensate for small registration errors. Assume, for instance, that one centerline atlas point is projected near but not on the structure centerline in T′ at point n. Suppose also that the closest point on the true structure centerline in T′ is c. Using our scheme, the intensity-based cost associated with point n will be higher than the cost associated with point c, assuming that the structure characteristics in T′ are similar to those in the model, which is the fundamental assumption of our approach. A minimum cost path algorithm will thus tend to pass through point c rather than point n, which would be on the path obtained if only a nonrigid registration algorithm was used.
Cost matrix for centerline segmentation: Analytical expression
The terms we have included in the cost matrix are based on (1) the expected intensity, (2) the expected structure orientation, and (3) local intensity minima in the image. These features were chosen after observation of structure characteristics in a number of CT images. Table 1 shows the exact analytical expression for each term used in our cost function and lists the value of the parameters used for the facial nerve and the chorda tympani, respectively. The constant terms in these expressions are scaling factors, which have been introduced to map the range of the expressions before multiplication by parameter β and exponentiation by parameter α approximately onto the [0,1] interval. The first term penalizes voxels whose intensity value departs from the expected intensity values. The second term favors making a transition in the direction predicted by the model. In this expression, is the direction of the transition (i.e., up, left, right, etc.), and is the structure direction predicted by the model. A transition in the direction predicted by the model has an associated cost of zero while a transition in the opposite direction has an associated cost of one. The third term favors voxels, which are local intensity minima. The expression #{y in Nhbd(x):T′(y)>T′(x)} is the number of voxels in the 26 connected neighborhood of x, which have an intensity value that is larger than the intensity value of x. Note that this term is not model dependent. The overall cost to move from one voxel to the other is the sum of terms (1) and (3) at the new voxel plus the transition cost in that direction. All values are precomputed before finding the path of minimum cost. The method used to select the parameter values for each structure is discussed in Sec. 2E.
Table 1.
Terms used to compute the costs at every voxel in the image. For each term, the values and sensitivities are shown.
| Cost function | Purpose | Facial nerve | Chorda | ||
|---|---|---|---|---|---|
| α | β | α | β | ||
| β[∣T′(x)−EI(x)∣∕2000]α | Penalize deviation from expected intensity | 0.5∣30% | 3.0∣70% | 2.5∣20% | 10.0∣40% |
| Penalize deviation from expected Curve orientation | 40∣80% | 1.0∣80% | 4.0∣80% | 1.0∣80% | |
| Penalize deviation from local intensity minima | 2.0∣70% | 1.0∣50% | 2.0∣70% | 1.0∣40% | |
Identifying starting and ending points
We rely on an atlas-based approach to localize the starting and ending points in image T′. First, masks for anatomical structures are manually segmented in the atlas. These masks are then projected onto the image to be segmented, and the extremity points are computed from these projected masks.
To localize the ending and starting points for the facial nerve, a facial nerve mask is delineated in the atlas such that it extends 2 mm outside the facial nerve’s segment of interest at each extremity. The starting and ending points for the facial nerve centerline are then chosen as the center of mass of the most inferior 5% of the projected facial nerve mask and the center of mass of the most anterior 5% of the projected facial nerve mask. In all the training images we have used in this study, this results in starting and ending points that are outside the segment of interest but within 2 mm of the nerve centerline as assessed by manual identification of the facial nerve in the CT scans. The paths thus start and end outside the segment of interest, and the localization of the starting and ending points is relatively inaccurate. However, the path finding algorithm corrects for this inaccuracy within the segment of interest. This makes our approach robust to unavoidable registration errors associated with the localization of the ending and starting points.
The chorda is a structure that branches laterally from the facial nerve at a location that exhibits high interpatient variability. Thus, the chorda mask was created such that the structure extends into the facial nerve 4 mm inferior to its branch from the facial nerve. The starting point for the chorda is then chosen as the most inferior 5% of the projected chorda mask. This point falls outside the segment of interest for the chorda. The path will thus start outside of the ROI, but the branching point at which the chorda separates from the facial nerve is, with a high probability, located between the starting and ending points. The other end of the chorda in the segment of interest is placed on the undersurface of the tympanic membrane. But, because the exact location where it joins the membrane is ambiguous in CT images and also exhibits large interpatient variability, the end point for the chorda segmentation is chosen to be any point within the projected tympanic membrane mask. This accounts for the variability in the final position by assuming that the true final position is the one which corresponds to the path with the smallest total cost.
Centerline segmentation
The starting and ending points defined using the approach described in the previous subsection and the cost matrix computed using the methods described in Sec. 2C2 are passed directly to the minimal cost path finding algorithm,23 which returns the final structure centerline segmentation.
Full structure segmentation
Because the chorda is extremely narrow, the chorda segmentation is completed simply by assigning a fixed radius of 0.25 mm along the length of its centerline. For the facial nerve, the centerline produced by the method presented in Sec. 2C4 is used to initialize a full structure segmentation scheme. A standard geometric deformable model, level-set based method is used.24 In this approach, the contour is the zero level set of an embedding function, ϕ which obeys the following evolution equation:
| (4) |
in which F is the speed function, i.e., the function that specifies the speed at which the contour evolves along its normal direction. The speed function we have designed for the facial nerve has two components, the analytical expressions of which are shown in Table 2. In these expressions the terms Ew(x) and EI(x) are the expected width and intensity value at x predicted by the model. The first term is larger when the expected width is greater, and the second term is larger when the intensity in the image is similar to the predicted intensity. The total speed defined at each voxel is the product of the terms in Table 2. Traditionally, Eq. 4 is solved iteratively until the front stabilizes and stops. This is not possible here because the contrast between the facial nerve and its surrounding structures is weak. To address this issue, we solve Eq. 4 a fixed number of times (here, three times), and we choose the values of α and β such that the propagating front reaches the vessel boundary in three iterations. The method used to select values for α and β is discussed in Sec. 2E.
Table 2.
Terms used to compute the speed function at every voxel in the image. For each term, the values and sensitivities are shown.
| Speed function | Purpose | Facial nerve | |
|---|---|---|---|
| α | β | ||
| e[βEW(x)α] | Slow propagation where structure is thinner | 1.0∣80% | 0.7∣80% |
| e[−β(∣T′(x)−EI(x)∣∕2000)α] | Slow propagation where intensities deviate from expectation | 0.5∣80% | 1.3∣60% |
Creation of the gold standard and evaluation method
Gold standards for both the training and testing sets were obtained by manual delineation of these structures. The contours were drawn by a student rater (JHN), then corrected by an experienced physician (FMW, RFL). Contours were drawn only over regions of the structures that were judged to be of clinical significance for planning CI surgery, i.e., only along the length of the structure in the region that is directly in danger of being damaged by the drilling procedure. As a consequence, the most extreme inferior and posterior processes of the facial nerve and the inferior and superior processes of the chorda are typically not included in the ROI. To quantitatively compare automatic and manual segmentations, surface voxels from structures are first identified. Because portions of the structure models extend beyond the ROI, some voxels are present in the automatic segmentation that fall outside this region. To avoid biasing the quantitative analysis, the portions of the automatic segmentations which lie beyond the manually chosen extrema are eliminated prior to calculations. Thus, the extreme processes of the automatic tubular structures are cropped to match the manual segmentation.
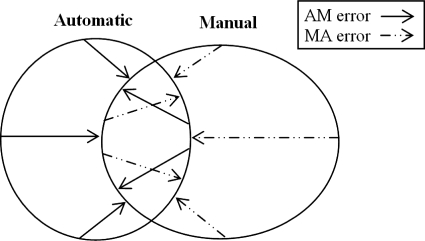
We use two distance measures to compare similarity between automatic and manual segmentations. For each voxel on the automatic surface, the distance to the closest voxel on the manual surface is computed, which we call the automatic-manual (AM) error. Similarly, for each voxel on the manual surface, the distance to the closest point on the automatic surface is computed, which we call the manual-automatic (MA) error. These two types of error, which are generally not symmetric, are illustrated by a 2D example in Fig. 7.
Figure 7.
Methods for calculating error between automatically and manually generated structure surfaces.
Parameter selection
Using the 15 ears in the training set, we chose parameter values and studied the sensitivity of the algorithm to these values. Parameter selection was done manually and heuristically. For each parameter, an acceptable value was chosen first by visually observing the behavior of the algorithm as a function of parameter values. Once an acceptable value was found, it was modified in the direction that reduced the maximum AM or MA error over all volumes in the training set until a value was found at which the error clearly increased. The final value was chosen away from this point in the generally flat error region, which preceded it. Once values were determined for each parameter, the sensitivity of the resulting parameters was analyzed. This was done by sequentially modifying the parameter values in 10% increments around their selected value until the maximum AM or MA error over all volumes in the training set increased above 1 mm. The deviation (in percent) at which this happens is reported in Tables 1, 2 for each parameter.
Implementation and timing
The presented methods were all coded in C++. Segmentation of the facial nerve and chorda tympani requires approximately 5 min on an Intel quad-core 2.4 GHz Xeon processor, Windows Server 2003 based machine.
Evaluation
Once chosen, the parameter values were frozen and the algorithm was applied, without modification, to the ten ears included in the testing set.
RESULTS
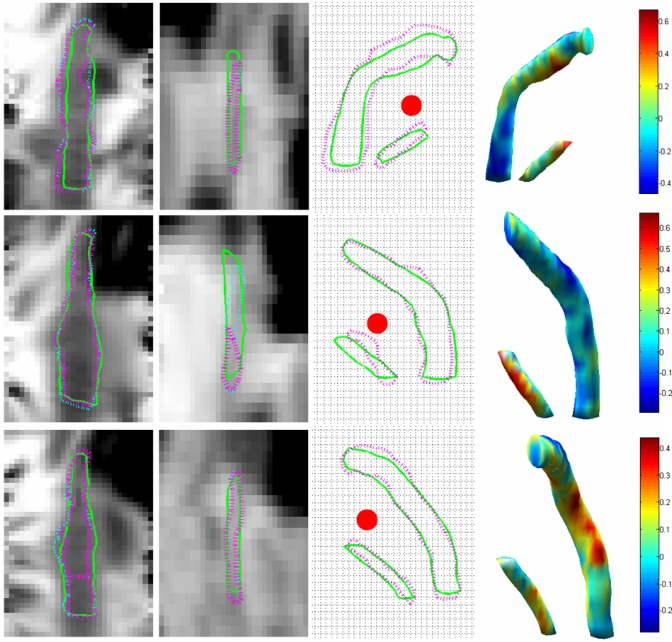
Mean, median, and maximum AM and MA errors for the testing set are shown in Table 3. Segmentation results for three cases are shown in Fig. 8, these includes the case exhibiting the worst facial nerve error (4-R), the case exhibiting the worst chorda error (1-L), and a case with very little all around error (3-L). In this figure, the first two columns show the facial nerve (first column) and the chorda tympani (second column) in gray level images. To generate these figures, the 3D medial axis of the automatically segmented structures was mapped onto a straight line using thin-plate splines. The images show the intensity values in a plane passing through the straightened center lines. This permits to show the entire length of the structures in a single 2D image. The solid green and purple dashed lines are the intersections of the automatic and manual surfaces with the image plane, respectively. Small differences between the manual and automatic centerlines, as is the case for the second chorda, will cause the manual surface to only partially intersect the image plane. The thin dashed cyan lines are the contours of the projection of the manual surface on the image plane. The third column shows the silhouette of the facial nerve and chorda tympani on a plane perpendicular to a typical trajectory, i.e., the contour of the structures’ projection on this plane. The purple and green contours correspond to the manually and automatically segmented structures, respectively. The red dots in these images are the cross sections of the drilling trajectory. The grid lines are spaced according to the size of one voxel (∼0.35×0.4 mm2). The fourth column shows the surface of the automatically segmented structures. The color map encodes the distance between this surface and the closest point on the manually segmented surface in millimeters. In this figure, the distance is negative when the automatic surface is inside the manual surface. It is positive when it is outside.
Table 3.
Facial nerve and chorda segmentation results. All measurements are in millimeters and were performed on a voxel by voxel basis. Shown are the mean, maximum and median distances of the automatically generated structure voxels to the manually (AM) segmented voxels and vice versa (MA). The last column contains mean, max, and median values for voxels from all ears.
| Volume Ear | 1 L | 2 R | 3 L | 4 | 5 | 6 | 7 L | Overall statistics | ||||
|---|---|---|---|---|---|---|---|---|---|---|---|---|
| L | R | L | R | L | R | |||||||
| Facial nerve | Mean Dist. AM | 0.103 | 0.093 | 0.140 | 0.093 | 0.146 | 0.175 | 0.161 | 0.126 | 0.159 | 0.122 | 0.132 |
| Max Dist. AM | 0.487 | 0.438 | 0.492 | 0.521 | 0.800 | 0.524 | 0.557 | 0.618 | 0.651 | 0.400 | 0.800 | |
| Median Dist. AM | 0.000 | 0.000 | 0.246 | 0.000 | 0.000 | 0.234 | 0.234 | 0.206 | 0.206 | 0.000 | 0.103 | |
| Mean Dist. MA | 0.085 | 0.128 | 0.121 | 0.104 | 0.215 | 0.138 | 0.124 | 0.147 | 0.149 | 0.195 | 0.141 | |
| Max Dist. MA | 0.468 | 0.400 | 0.470 | 0.477 | 0.838 | 0.469 | 0.469 | 0.509 | 0.509 | 0.738 | 0.838 | |
| Median Dist. MA | 0.000 | 0.000 | 0.000 | 0.000 | 0.260 | 0.234 | 0.000 | 0.206 | 0.206 | 0.000 | 0.000 | |
| Chorda | Mean Dist. AM | 0.349 | 0.207 | 0.156 | 0.179 | 0.212 | 0.082 | 0.095 | 0.153 | 0.120 | 0.055 | 0.161 |
| Max Dist. AM | 0.689 | 0.438 | 0.348 | 0.582 | 0.582 | 0.381 | 0.234 | 0.634 | 0.364 | 0.400 | 0.689 | |
| Median Dist. AM | 0.344 | 0.310 | 0.246 | 0.260 | 0.260 | 0.000 | 0.000 | 0.206 | 0.206 | 0.000 | 0.226 | |
| Mean Dist. MA | 0.224 | 0.199 | 0.043 | 0.114 | 0.026 | 0.079 | 0.054 | 0.111 | 0.100 | 0.053 | 0.100 | |
| Max Dist. MA | 0.630 | 0.438 | 0.246 | 0.544 | 0.260 | 0.469 | 0.332 | 0.600 | 0.600 | 0.369 | 0.630 | |
| Median Dist. MA | 0.122 | 0.310 | 0.000 | 0.000 | 0.000 | 0.000 | 0.000 | 0.000 | 0.000 | 0.000 | 0.000 | |
Figure 8.
Segmentation results for CT volumes 4-R (top row), 1-L (middle row), and 3-L (bottom row).
DISCUSSION
The method we propose requires selecting a number of parameters (10 for the facial nerve and 6 for the chorda). Although, at the present time, this requires initial manual adjustment, our study shows that the method is not very sensitive to the selection of these parameters. Any of the parameters can be changed by 20% before the segmentation error reaches 1 mm. Several of these parameters can be changed by 80% or more. Our results also show that our method is robust. The algorithm has been trained on 12 CT volumes (15 ears) acquired at our institution on the same scanner. It was tested without modification on seven additional CT volumes (ten ears) acquired both at our institution and at other institutions on different scanners. Results also show that the proposed method is accurate. The mean AM and MA errors are on the order of 0.1 mm for the facial nerve and slightly higher for the chorda. Maximum errors are on the order of 0.8 mm for the facial nerve and 0.7 mm for the chorda. Note that these errors are differences between manual and automatic segmentation. Fig. 8 shows that the largest errors in the chorda segmentation occur at the superior end of the structure, where it exits the tympanic bone. Precise and consistent localization of this point is very difficult even manually. Manual contouring of the facial nerve is also difficult, leading to contour discontinuities between slices. This is especially acute when the nerve is surrounded by structures with similar intensities. This is apparent in Fig. 8 where the automatic contours are generally smoother than the manual ones. It is thus possible that the automatic segmentation is, in fact, more accurate than the manual one. Figure 8 also shows that the segmentation errors are generally not larger in areas that matter most (i.e., along the drilling trajectory) than they are in other regions of the structure, thus suggesting that our method can be used to generate reliable surfaces to be used for surgical planning.
CONCLUSIONS
To the best of our knowledge, this article presents the first method for the automatic segmentation of two critical structures for cochlear implant surgery: The facial nerve and the chorda tympani. Because of the shape and size of these structures, and because of the lack of contrast between these and surrounding structures, accurate segmentation is challenging. In our experience, purely atlas-based methods are ineffectual for this problem. Computing transformations that are elastic enough to compensate for anatomic variations leads to transformations that are not constrained enough to deform the structures of interest in a physically plausible way. More constrained transformations lead to results that are not accurate enough for our needs. We have attempted to use an optimal path finding algorithm based purely on intensity. This was also unsuccessful. Even if starting and ending points are chosen manually, changes in intensity along the structures, lack of intensity gradients between the structures of interest and background structures, and incorrect paths of similar intensity from starting to ending points led to inaccurate segmentations.
The solution lies in providing the optimal path finding algorithm with expected feature values. These can be provided with an atlas-based approach because a perfect registration is not required. An approximate registration is sufficient to provide the algorithm with the expected feature values for centerline voxels in a region. The optimal path algorithm then chooses the path that contains voxels associated with feature values that are similar to the expected features.
Another novel element of our approach is a spatially varying speed function also defined using a model. This speed function is then used to drive a geometric deformable model and segment the complete facial nerve. Traditional geometric deformable model approaches involve the definition of a speed function that stops the front at the edge of the structures of interest. A common problem is the issue of leakage when edges are poorly defined. The solution we have developed is to design a speed function that evolves the front from the centerline to the structure edges in a fixed number of steps. As shown in our results, this approach is robust and accurate.
Finally, although the analytical form of the cost function that is used is application specific, the concept of using atlas information to guide an optimum path finding algorithm is generic. We are currently applying the same idea to the segmentation of the optic nerves and tracts in MR images and exploring it applicability to the segmentation of white matter tracts in diffusion tensor images.
ACKNOWLEDGMENTS
This research has been supported, in part, by NIH Grant Nos. R01EB006193, R01DC008408, and 1F31DC009791. The authors would also like to acknowledge Professor J. Michael Fitzpatrick for creative discussion concerning this work and for critical editions to a previous version of this article.
References
- Labadie R. F., Choudhury P., Cetinkaya E., Balachandran R., Haynes D. S., Fenlon M., Juscyzk S., and Fitzpatrick J. M., “Minimally-invasive, image-guided, facial-recess approach to the middle ear: Demonstration of the concept of percutaneous cochlear access in-vitro,” Otol. Neurotol. 26, 557–562 (2005). [DOI] [PubMed] [Google Scholar]
- Labadie R. F., Noble J. H., Dawant B. M., Balachandran R., Majdani O., and Fitzpatrick J. M., “Clinical validation of percutaneous cochlear implant surgery: Initial report,” Laryngoscope 118, 1031–1039 (2008). [DOI] [PMC free article] [PubMed] [Google Scholar]
- Fitzpatrick J. M., Konrad P. E., Nickele C., Cetinkaya E., and Kao C., “Accuracy of customized miniature stereotactic platforms,” Stereotact. Funct. Neurosurg. 83, 25–31 (2005). [DOI] [PubMed] [Google Scholar]
- Noble J. H., Warren F. M., Labadie R. F., Dawant B. M., and Fitzpatrick J. M., “Determination of drill paths for percutaneous cochlear access accounting for target positioning error,” Proc. SPIE 6509, 650925.1–650925.10 (2007). [Google Scholar]
- Rueckert D., Sonoda L. I., Hayes C., Hill D. L. G., Leach M. O., and Hawkes D. J., “Nonrigid registration using free-form deformations: Application to breast MR images,” IEEE Trans. Med. Imaging 10.1109/42.796284 18, 712–721 (1998). [DOI] [PubMed] [Google Scholar]
- Fischl B., Salat D., Busa E., Albert M., Dieterich M., Haselgrove C., van der Kouwe A., Killiany R., Kennedy D., Klaveness S., Montillo A., Makris N., Rosen B., and Dale A., “Whole brain segmentation: Automated labeling of neuroanatomical structures in the human brain,” Neuron 33, 341–355 (2002). [DOI] [PubMed] [Google Scholar]
- Dawant B. M., Hartmann S. L., Thirion J.-P., Maes F., Vandermeulen D., and Demaerel P., “Automatic 3D segmentation of internal structures on the head in MR images using a combination of similarity and free form transormations: Part I, metholody and validation on normal subjects,” IEEE Trans. Med. Imaging 10.1109/42.811271 18, 909–916 (1999). [DOI] [PubMed] [Google Scholar]
- Rohlfing T. and C. R.Maurer, Jr., “Nonrigid image registration in shared-memory multiprocessor environments with application to brains, breasts, and bees,” IEEE Trans. Inf. Technol. Biomed. 7, 16–25 (2003). [DOI] [PubMed] [Google Scholar]
- Dinggang S. and Davatzikos C., “HAMMER: Hierarchical attribute matching mechanism for elastic registration,” IEEE Trans. Med. Imaging 10.1109/TMI.2002.803111 21, 1421–1439 (2002). [DOI] [PubMed] [Google Scholar]
- Feng J., Ip H. H. S., and Cheng S. H., “A 3D geometric deformable model for tubular structure segmentation,” Proceedings of the International Multimedia Modeling Conference 10, 174–180 (2004). [Google Scholar]
- Yim P. J., Cebral J. J., Mullick R., Marcos H. B., and Choyke P. L., “Vessel surface reconstruction with a tubular deformable model,” IEEE Trans. Med. Imaging 10.1109/42.974935 20, 1411–1421 (2001). [DOI] [PubMed] [Google Scholar]
- Manniesing R., Viergever M. A., and Niessen W. J., “Vessel axis tracking using topology constrained surface evolution,” IEEE Trans. Med. Imaging 26, 309–316 (2007). [DOI] [PubMed] [Google Scholar]
- Wesarg S. and Firle E. A., “Segmentation of vessels: The corkscrew algorithm,” Proc. SPIE 5370, 1609–1620 (2004). [Google Scholar]
- Santamaría-Pang A., Colbert C. M., Saggau P., and Kakadiaris I. A., “Automatic centerline extraction of irregular tubular structures using probability volumes from multiphoton imaging,” Lecture Notes in Computer Science 4792, 486–494 (2007). [DOI] [PubMed] [Google Scholar]
- Olabarriaga S. D., Breeuwer M., and Niessen W. J., “Minimum cost path algorithm for coronary artery central axis tracking in CT data,” Lecture Notes in Computer Science 2879, 687–694 (2003). [Google Scholar]
- Hanssen N., Burgielski Z., Jansen T., Lievin M., Ritter L., von Rymon-Lipinski B., and Keeve E., “Nerves—Level sets for interactive 3D segmentation of nerve channels,” IEEE International Symposium on Biomedical Imaging: Nano to Macro 1, 201–204 (2004). [Google Scholar]
- Press W. H., Flannery B. P., Teukolsky S. A., and Vetterling W. T., Numerical Recipes in C, 2nd ed. (Cambridge University Press, Cambridge, 1992), pp. 412–419. [Google Scholar]
- Maes F., Collignon A., Vandermeulen D., Marchal G., and Suetens P., “Multimodality image registration by maximization of mutual information,” IEEE Trans. Med. Imaging 10.1109/42.563664 16, 187–198 (1997). [DOI] [PubMed] [Google Scholar]
- W. M.WellsIII, Viola P., Atsumi H., Nakajima S., and Kikinis R., “Multi-modal volume registration by maximization of mutual information,” Med. Image Anal. 10.1016/S1361-8415(01)80004-9 1, 35–51 (1996). [DOI] [PubMed] [Google Scholar]
- Palágyi K. and Kuba A., “A 3-D 6-subiteration thinning algorithm for extracting medial lines,” Pattern Recogn. Lett. 10.1016/S0167-8655(98)00031-2 19, 613–627 (1998). [DOI] [Google Scholar]
- Rohde G. K., Aldroubi A., and Dawant B. M., “The adaptive bases algorithm for intensity-based nonrigid image registration,” IEEE Trans. Med. Imaging 10.1109/TMI.2003.819299 22, 1470–1479 (2003). [DOI] [PubMed] [Google Scholar]
- Wu Z., “Multivariate compactly supported positive definite radial functions,” Adv. Comput. Math. 4, 283–292 (1995). [Google Scholar]
- Dijkstra E. W., “A note on two problems in connexion with graphs,” Numerische Mathematik 1, 269–271 (1959). [Google Scholar]
- Sethian J., Level Set Methods and Fast Marching Methods, 2nd ed. (Cambridge University Press, Cambridge, 1999). [Google Scholar]


