Abstract
Osteoporotic bone loss is accompanied by impaired structural integrity of the trabecular network, leading to a decrease in the overall mechanical properties of the bone. The development of the “virtual bone biopsy” (VBB), a method combining magnetic resonance microimaging (μMRI) and digital image processing techniques, has previously been shown to quantify topology and scale of human trabecular bone noninvasively. The aim of this work was to determine the extent to which structural parameters derived from images acquired in the limited spatial resolution regime of in vivo imaging are sensitive to resolution and noise and further, whether under these conditions, a small amount of bone loss and its associated structural manifestations can be detected. Toward these goals 3D models of trabecular bone representing multiple anatomic locations were generated on the basis of μCT images of human cadaveric bone cores. These images were binarized and the resulting data arrays representing pure bone (proton density=0) and pure marrow (proton density=255) subjected to simulated MR imaging by Cartesian sampling of k space, yielding, after 3D Fourier reconstruction, voxel sizes currently achievable in vivo. Subsequently, realistic levels of Gaussian noise were superimposed on the complex data and magnitude images were computed. The resulting images were subsequently VBB processed for a range of signal-to-noise ratio (SNR) values and image voxel sizes. For comparison of the predicted behavior to in vivo data, images from a recent patient study were evaluated as well. Systematic changes of the derived structural parameters changing progressively with decreasing SNR were noted, and it is shown that the errors are correctable using simple linear transformations, thereby allowing the data to be normalized. The predicted dependence of the structural parameters on SNR also closely parallel those observed in vivo. Finally, in order to assess the sensitivity of the VBB processing algorithms to detect bone loss during disease progression or regression in response to treatment, the high-resolution specimen data were subjected to 5% bone loss either by homogeneous or heterogeneous erosion and μMR images simulated at in vivo resolution and SNR. At typical in vivo SNR (SNR=12) and effective image resolution (160 μm isotropic and 137×137×410 μm3), VBB algorithms were able to detect the structural implications of a 5% loss in bone volume fraction with high statistical significance.
Keywords: trabecular bone imaging, noise and resolution, osteodegeneration
INTRODUCTION
There is increasing recognition of the importance of trabecular bone architecture as a contributor to bone strength.1 Until recently, however, structural information was available only through bone biopsy in conjunction with histomorphometry,2 and more recently, microcomputed tomography (μCT).3 Further, virtually the sole anatomic site for bone biopsy has been the ilium. Recent advances in imaging technology, notably micromagnetic resonance imaging4, 5, 6 (μMRI) and high-resolution quantitative CT (HR-pQCT),7, 8 now permit acquisition of images at peripheral locations such as the distal radius,9, 10 distal tibia,11 or calcaneus12, 13 at resolutions adequate to partially resolve the trabecular network. Some structural aspects have also recently been shown to be retrievable from an analysis of whole-body CT images of the vertebrae.14, 15
The linear resolution achievable in vivo has been on the order of trabecular thickness. In μMRI, voxel sizes reported in recent work at the distal extremities range from 137×137×350 μm3 to 156×156×500 μm3 and as large as 172×172×700 μm3 (see Refs. 10, 16, 13). In HR-pQCT voxel sizes are smaller,7 typically on the order of 80×80×80 μm3. In MRI the width of the point-spread function (which determines resolution) for images obtained with the Cartesian imaging techniques, as they are typically used for microimaging of trabecular bone, is about 20% greater than the linear dimensions of the imaging voxel.5 In CT, however, the point-spread function is usually considerably larger than the voxel dimension, being determined by such parameters as the finite resolution of the detector system, the geometric magnification, the band limiting filter used during reconstruction, and the focal spot of the x-ray tube.17 So, the actual resolution of the two modalities is probably comparable. In MRI the practically attainable resolution is limited by the achievable signal-to-noise ratio (SNR), whereas in CT resolution is radiation dose limited.
In recognition of the errors incurred by the relatively low resolution and SNR characteristics of in vivo images, the conventional histomorphometric parameters such as TB∕TV, Tb.N, or Tb.Th have been termed “apparent.”9 The linear relationship between parameters extracted from images acquired in different resolution regimes is well documented (see, for example, Ref. 18). Although it has been shown that it is possible to obtain values of trabecular thickness or volume fraction in the limited spatial resolution and SNR regime of in vivo imaging close to those measured at micro-CT resolution,19, 20 some parameters relating to topology of the trabecular network, such as those derived via digital topological analysis (DTA),21 are inherently resolution dependent.22, 23 This is readily seen when we consider, for example, a plate-like structure. Depending on voxel size relative to the structural element’s width, skeletonization will either convert it to a surface or a curve. It is likely that many of the trabecular network analysis techniques and indices3, 24, 25, 26, 27, 28 are sensitive to voxel size and specific imaging technique used. A related question is whether subtle treatment-induced changes or degradation of the trabecular network during disease progression can be detected under conditions typical of in vivo imaging.
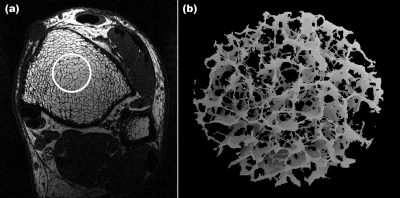
The objectives of the present work were twofold. The first was to evaluate the errors in digital topological parameters incurred from limiting sampling resolution and the presence of noise, and to explore possible means to correct for such errors using noise-free high-resolution datasets. The second objective was to determine the extent to which different forms of bone loss, and their implications on parameters of network topology and scale, can be detected in this regime. It is expected that homogeneous and, more so, heterogeneous erosion, cause fenestration of trabecular plates and disconnection of rod-like trabeculae.29, 30 Saha et al.31 devised an algorithm called DTA that classifies each voxel of a digitized structure after its skeletonization. The method, in which trabecular plates are converted to surfaces and rods to curves, has recently been applied to the classification of trabecular networks.23 Although a plethora of different structural parameters have been used in studies of trabecular bone architecture, digital topological parameters such as the “surface-to-curve ratio” and “erosion index” have been found to be particularly useful for fracture discrimination22, 32 and as a means to quantify the response to treatment,33 hence, our focus on this class of structural parameters in this study. A typical in vivo image along with a virtual core derived from a skeletonized 3D dataset of a cylindrical subregion is shown in Fig. 1.
Figure 1.
(a) Micro-MR image (one of 32 contiguous images) obtained with the 3D FLASE pulse sequence at the tibial metaphysis at 137×137 μm2 pixel size and 410 μm slice thickness. (b) 3D rendered skeleton image obtained by VBB processing of virtual core indicated by circle in (a).
The present study was conducted by first generating an accurate 3D voxel model of the bone on the basis of binarized high-resolution μCT images of human trabecular bone specimens. The images were subsequently subjected to simulated MR scanning by assuming the marrow spaces to contain signal-producing material mimicking bone marrow, and then Cartesian sampling k space up to maximal spatial frequencies corresponding to resolutions as they are commonly achieved in vivo. Random noise was subsequently superimposed in the real and quadrature channel to yield SNR values typically achievable in patient scans. The predicted functional dependence of the derived structural parameters was also evaluated in actual patient scans for comparison with simulations. In addition, the simulated MR images were also downsampled via low-pass filtering in k space to examine the effects of resolution on the derived parameters. After analyzing the functional dependence of the derived topological and scale parameters, correction schemes were developed to account for the effect of noise and limited resolution.
Last, to determine the sensitivity of the algorithms to detect changes from bone loss, the μCT-derived 3D binary voxel models were subjected to erosion and again subjected to simulated MR scanning mimicking in vivo conditions. The structural measures of scale and topology derived from these images were subsequently evaluated with respect to their ability to detect and quantify the anticipated changes.
MATERIALS AND METHODS
Simulated MR imaging
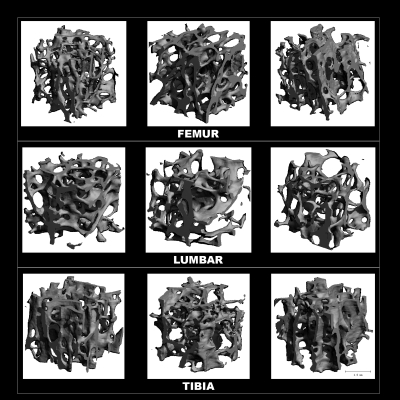
To create a set of images with controlled SNR and resolution, 3D voxel models of human trabecular bone specimens were generated and subjected to simulated MR scanning. Toward this goal nine bone biopsy samples extracted from five human cadavers (four male, one female; ages 44–69 years∕mean 55 years) were scanned by μCT (vivaCT 40, SCANCO Medical AG, Switzerland) at a voxel size of 21×21×22 μm3 (Fig. 2). These images were binarized at the midpoint of the modes representing bone and marrow, and the resulting 3D voxel arrays assigned intensities of I=0 for bone and I=255 for marrow voxels. 3D k-space sampling was simulated by computing 3D Fourier transforms of the binary high-resolution images. The resulting k-space data were low-pass filtered by downsampling by factors of 6×6×18 to remove the data’s high-frequency content. In this manner “μMR images” at a voxel size of 126×126×396 μm3, close to the voxel size used in prior clinical studies in the authors’ laboratory,11, 22, 33 were obtained.
Figure 2.
3D renderings of μCT images from cores of the nine human cadaver specimens used in the analyses.
Evaluation of the effects of noise and resolution
Noise was added to each of the nine data sets, producing a range of different average SNRs. This was achieved by reading the simulated μMR images into MATLAB (The Mathworks Inc., Natick, MA), and adding Gaussian-distributed real and imaginary random numbers in image space. Subsequently, the absolute values of the noisy images were computed (thereby converting Gaussian to Rician noise34). To control image SNR, the standard deviation σ of the Gaussian-distributed random numbers added were set as SNR=S∕σ, with S being the mean signal intensity in the images. SNR values analyzed ranged from 6 to 16, a range typical of in vivo μMR of trabecular bone.5 The images were then processed analogous to in vivo images as described previously to yield a bone volume fraction map35 in which the pixel intensity is given by the fractional occupancy of the voxel by bone. Subsequently, the resulting bone volume fraction images were 3D sinc interpolated, thresholded and skeletonized.36 Skeletonization converts trabecular struts to curves and trabecular plates to surfaces. The skeleton maps were then subjected to digital topological analysis, in which each voxel in the bone network is classified as belonging to a surface, curve, or their mutual junctions.31 Composite parameters surface-to-curve ratio (ratio of the sum of surface-type voxels divided by the sum of curve-type voxels) and erosion index (ratio of the sum of parameters expected to increase with osteoclastic resorption divided by the sum of those expected to decrease) were computed as well,23 since these had previously been shown to be sensitive indicators of osteoporotic bone loss22 and bone accrual in response to antiresorptive treatment.33 Finally, the derived structural parameters results were plotted as a function of SNR.
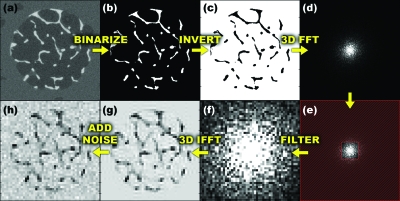
The same 126×126×396 μm3 simulated μMR images were downsampled in k space to various resolutions in only the xy plane to study the effects of varying transverse resolution on the derived structural parameters. Downsampling was performed by applying 2D fast Fourier transforms to the images, thereby converting them into the k-space domain, followed by zeroing the high-frequency kxky data. Zero-filling high-frequency data (instead of cropping) maintains image voxel sizes while reducing resolution (see Fig. 3, which illustrates downsampling via cropping). In this manner, a more objective comparison of topological parameter densities is possible. Conversely, increasing voxel size in the xy plane would affect the parameter counts differently for the different topological types. For example, a “curve” (a 1D element) would be expected to scale by a factor of approximately 1∕(21)=1∕2 when doubling voxel size, while the number of voxels composing a “surface” (a 2D element) would scale by a factor of approximately 1∕(22)=1∕4. The downsampling factors (DSF) of the resulting images ranged from 1 to 3 in intervals of 0.1, corresponding to 21 different resolutions simulated, ranging from 126×126×396 μm3 to 378×378×396 μm3. There are various notions of image “resolution.” In the context of this study, we use the term “effective resolution” to mean what would have been the resulting voxel size if only the array of nonzeroed data had been used in the discrete Fourier transform. As described above, the actual voxel size is the same for all simulated images, while the effective resolution varies. Parameterization algorithms were run on all downsampled images and the results were plotted as a function of DSF.
Figure 3.
Illustration of processing sequence: (a) specimen μCT image; (b) segmented to yield binarized image; (c) inverted to mimic MRI grayscale; (d) k-space map after 3D FFT of (c); (e) low-pass filtering by removing high-frequency data, marked in red; (f) low-pass filtered k-space data; (g) 3D inverse FFT to produce image with in vivo μMRI resolution characteristics; and (h) superimposed with noise.
Processing errors for parameter values at a given SNR (between 6 and 16) were corrected based on the empirically observed linear relationship between the corresponding values of the nine specimen datasets at different SNR. This relationship assumes that at a given SNR, structural parameters vary linearly with the same parameters derived at infinite SNR, while the R2 values of the fits give an approximation of the accuracy of the correction.
To create correction slopes and intercepts for a continuous range of SNR, curves were fit to the slopes and intercepts versus SNR data. The fits were generated using MATLAB’s Curve Fitting Toolbox functions. Curve fitting was performed using a sum of decaying exponentials and other functions on several parameters and piece-wise smoothing splines on the remaining parameters. The “smoothing parameter” of the spline fitting, which ranged from 0.08 to 0.999, was manually adjusted to achieve accurate fits while avoiding “overfitting” and including random error in the data.
These correction curves were then used to linearly transform the derived parameter values calculated at a given SNR to predict those derived from noiseless images. The relative errors in the predictions were calculated as the fractional difference between the predicted parameter values at given SNR and those calculated at SNR=∞.
Corrections were applied to the parameters derived from the systematically downsampled images using the previously described techniques for correcting the effects of noise. Whereas corrections for noise required choosing structural parameters derived from noiseless images as the “true” values, resolution-affected results were corrected toward processing results from images that received no additional downsampling, i.e., images with DSF=1 (126×126×396 μm3 resolution).
In vivo MR images
The purpose of these experiments was to compare the functional behavior of some of the parameters examined by simulation with in vivo μMRI data. Toward this goal, μMRI data from a recently completed transverse study examining the association between vertebral deformity and structural measures at two surrogate sites—the distal radius and distal tibia—were evaluated32 for a range of SNR values. The SNR of these images was determined by dividing the mean of the signal over the trabecular bone region in the central slice by the standard deviation of the noise in a nonsignal producing region, i.e., outside the anatomy. The SNR of the initial image determined the range of accessible SNR values (since noise can, of course, only be increased). Ten high-SNR datasets were selected (eight tibia, SNR>9 and 2 wrist, SNR>15) and a series of lower SNR images were produced. Toward this goal the Fourier transform of the image was calculated and complex Gaussian noise added with the standard deviation of the Gaussian determining the reduced image SNR. The noise-enhanced image was then computed as the absolute value of the inverse Fourier transform of the noise-enhanced k-space data. The images used had a voxel size of 137×137×410 μm3 and are therefore close to those obtained by simulation. Finally, structural parameters were computed as a function of SNR in each of the ten image datasets. The process chosen is therefore analogous to the simulations described above except that, of course, no images at SNR=∞ were available, which, as we shall see, is not essential.
Structural implications of bone loss in the limited SNR and resolution regime of in vivo imaging
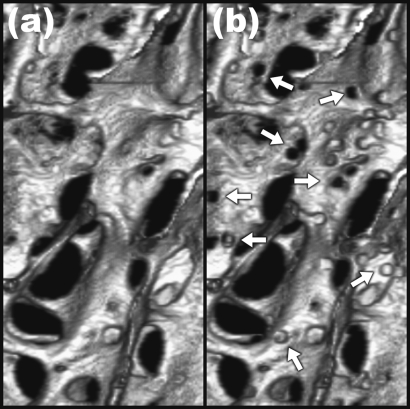
To simulate the structural effects of trabecular bone loss, heterogeneous and homogeneous erosion algorithms were written in MATLAB and applied to the 3D voxel models derived from the μCT images of the nine human specimens as described previously. Heterogeneous erosion was simulated by creating pits of 60 μm radius centered on trabecular bone surface voxels, defined as voxels with at least one or more nonbone neighbors. The coordinates of pit centers were chosen from a uniform random distribution. Pit creation was iterated until total bone volume was reduced to the desired amount. Figure 4 shows surface-rendered images before and after simulated pitting. Homogeneous erosion was achieved by iteratively removing bone surface voxels. Once the desired volume of remaining bone was approached, random surface voxels were removed, one at a time, until the desired volume of bone was attained.
Figure 4.
Three-dimensional surface rendering of binarized trabecular bone μCT images from one of the specimens before (a) and after applying heterogeneous erosion by generating pits of 60 μm radius (indicated with arrows) until bone volume was reduced by 5%.
For both erosion models, bone volume was reduced by 5%. Heterogeneous erosion was achieved by creating a sufficient number of pits with radii of approximately 60 μm so as to reduce total bone volume by the desired fraction. For homogeneous erosion, voxels were homogeneously removed from trabecular surfaces. These erosion techniques closely mimic clinically observed bone loss.37, 38, 39
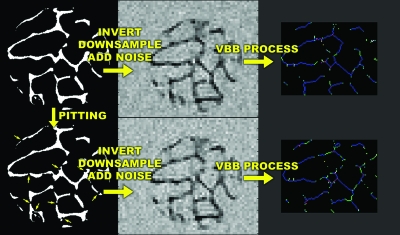
Analogous to the previously described simulations, noise was added to the eroded and original simulated μMR images to produce image sets with SNR=12 and resolutions of 137×137×410 μm3 and 160×160×160 μm3. The resulting images were then subjected to processing as illustrated in Fig. 5. Finally, the results were read into MATLAB and analyzed using two-tailed single-sample t tests. The null hypothesis tested was that there was no difference between structural parameters derived from eroded and noneroded images.
Figure 5.
Illustration of heterogeneous erosion, downsampling to mimic in vivo μMRI and subsequent image processing, resulting in topological classifications of trabeculae into surfaces (blue), surface edges (green), curves (light blue), curve-curve junctions (red), etc.
RESULTS
Effect of noise and resolution
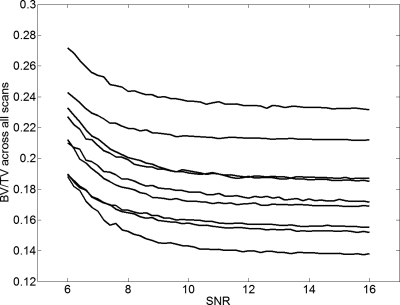
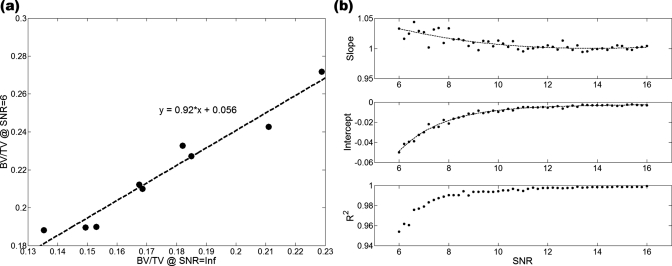
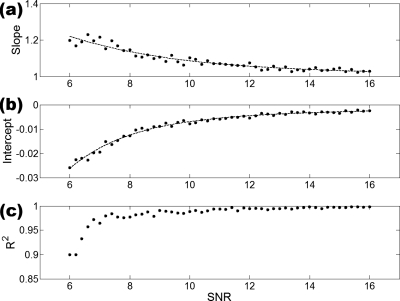
From the data in Fig. 6, in which BV∕TV is plotted versus SNR, we note that the algorithm used for bone volume fraction mapping is very stable down to SNR values on the order of 10, and the apparent BV∕TV values asymptotically converge toward a limiting value at SNR≈13–14. For SNR<10 the apparent BV∕TV values begin to rise in a systematic but predictable manner. As shown by the data in Fig. 7a, the parameters extracted at a given SNR are linearly related to those at SNR=∞ (and thus because of the rapid convergence generally to those at SNR>13). The R2 values of these fits followed a decreasing trend with decreasing SNR, as expected, showing the linear relationship to be weakened for noisier images. In the SNR range of 6–16, the R2 values of the fits did not fall below 0.95 for BV∕TV and 0.90 for surface density [Figs. 7b, 8]. For the composite topological parameter surface-to-curve ratio,23 however, R2 of the fits dropped as low as 0.78 at SNR=8 and 0.08 at SNR=6.
Figure 6.
BV∕TV as a function of SNR showing systematic trend. Each curve represents a different specimen. Except for two specimens with nearly the same BV∕TV (third and fourth from top) the parameter values remain relatively constant down to SNR∼10 while rank is preserved down to SNR∼8.
Figure 7.
(a) Linear relationship between BV∕TV at SNR=N and corresponding value at SNR=Inf (shown for SNR=6, the lowest SNR simulated). (b) Slopes, intercepts and R2 of each linear fit applied at different SNR values, with exponential decay curve fits overlaid on slope and intercept data.
Figure 8.
(a) Slopes of the linear fits of surface density at SNR=N vs surface density at SNR=Inf; (b) intercepts of the linear fits of surface density at SNR=N vs surface density at SNR=Inf; (c) R2 values of the linear fits. This parameter was fitted with a piece-wise smoothing spline since no mathematical expressions could accurately fit the data.
Curve fits performed on the slope and intercept values of the linear fits [Figs. 7b, 8] produced varying R2 values. Ten of 16 parameters yielded highly accurate fits (defined as R2>0.95) with respect to slope data and 9 of 16 were within this category for the intercept data. While providing some idea of the accuracy of the corrections, the R2 values of some parameters were found to be somewhat sensitive to the selection of the smoothness of the spline used for fitting. High R2 values for noisy slope and intercept data are likely to be caused by overfitting the data, erroneously including the noise in the data into the spline fit.
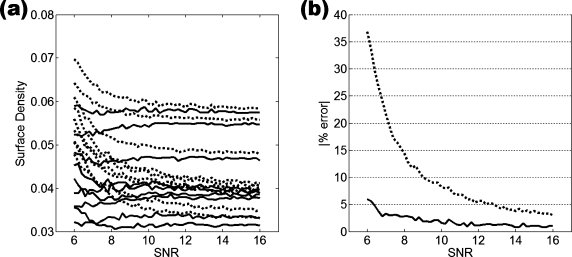
To evaluate the effectiveness of linear corrections, the errors of the corrected parameters were compared to the errors of the parameters prior to correction. We defined error as the mean of the magnitude of each image dataset’s calculated parameters subtracted from reference values, i.e., parameters calculated from images with infinite SNR or at 126×126×396 μm3 resolution. This residual error after correction was consistently much smaller than the error induced by just noise, showing that the correction algorithms improved the accuracy of the structural parameters. An example of the error analysis is shown for the topological parameter representing surface density in Fig. 9. While the error after correction in the SNR=8–10 range reached 2%–3% of the parameters derived from the noiseless images, it was considerably smaller than the error caused by image noise, which was on the order of 8%–15%. The error reduction before and after correction of several structural parameters are listed in Table 1. At all SNR levels and resolutions, correction substantially decreased the mean error in every parameter. As expected, the errors induced by noise and resolution were greatest at low resolution and low SNR, but they were significantly reduced after application of the correction algorithm in all situations examined. The extent of error reduction from corrections also varied by parameter. It is noted from the data in Table 1 that curves are particularly sensitive to noise, leading to a dramatic overestimation at low SNR. Nevertheless, curve count was substantially improved. Even at the highest SNR level reported, the correction algorithm reduced curve count from 47% to 4%, while the relative error in BV∕TV was lowered from 2.6% to 0.6%.
Figure 9.
Correction for varying SNR of surface density and correction accuracy: (a) surface density before correction (dotted line), corrected surface density (solid line); (b) error in surface density calculation induced by noise (dotted line) and after correction (solid line). The error in the corrected values is lower than the errors in the original values, and in the SNR range of 8–10 it is lower by approximately 10% of the noncorrected surface density values.
Table 1.
Error in derived structural parameters induced by reduced SNR with resolution fixed at 126×126×396 μm3. Mean magnitude of error in parameters are shown before and after corrections were applied and are relative to parameters calculated from noiseless images (SNR=∞).
| SNR | 6 | 9 | 12 | |||
|---|---|---|---|---|---|---|
| Before | After | Before | After | Before | After | |
| BV∕TV (%) | 25.1 | 2.9 | 5.6 | 1.0 | 2.6 | 0.6 |
| Skeleton density (%) | 102.2 | 10.3 | 23.7 | 2.9 | 11.8 | 2.1 |
| Surface density (%) | 36.8 | 6.0 | 10.0 | 1.9 | 5.6 | 1.1 |
| Curve count (%) | 463.0 | 21.9 | 108.6 | 7.4 | 47.4 | 3.6 |
| Surface-to-curve ratio (%) | 73.6 | 24.2 | 45.9 | 9.1 | 27.2 | 5.5 |
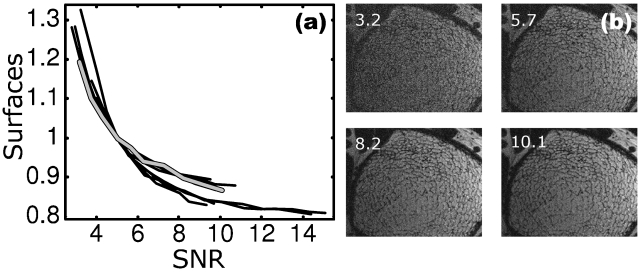
Figure 10 illustrates the dependence of topological surface density on SNR plotted for ten subjects. The parameter values were normalized such that at SNR=5 the trabecular bone in each of the ten datasets had a relative surface density of 1. After normalization, the curves for all samples collapse onto approximately the same dependence [Fig. 10a]. The data clearly show decreasing dependence of the apparent surface density with increasing SNR in that the derivative ∂(parameter)∕∂(SNR) rapidly converges to zero for SNR>10. Similar functional behavior was also found for other topological and scale parameters (data not shown).
Figure 10.
(a) Topological surface voxel density, normalized to SNR=5, derived from ten patient μMRI scans showing progressive increase in error with decreasing SNR. The images were processed and analyzed as described in Ref. 5. Bold curve in gray corresponds to parameters derived from the images including those in panel (b) obtained by superimposing noise to achieve a range of SNR values; (b) SNR-degraded images of the distal tibia scan (bold gray curve) in panel (a) with SNR indicated. Panel corresponding to SNR 10.1 pertains to images acquired.
The effectiveness of correction for effective resolution degradation was comparable to that predicted for the noise simulations. A systematic error, with magnitude increasing with decreasing resolution, is apparent for most parameters. The accuracy of the linear fits decreased with the resolution of the images processed, similar to the behavior previously found for increasing noise level. Curve fitting the slope and intercept data of the linear fits yielded results slightly inferior to those of the noise simulations, as evidenced by both slope and intercept fit qualities (R2>0.95 for 8 of 16 parameters, as compared to the 9 of 16 with R2>0.95 found previously). However, overall accuracy was increased after correction, as seen in Table 2. Like the corrections for SNR effects, the corrections for parameters derived at low resolution reduced errors for all parameters. The corrections were most dramatic for the lowest resolution images and varied in extent by parameter. At only a slightly reduced resolution of 151×151×396 μm3 (DSF=1.2), BV∕TV error was reduced from about 2% to 1%, relative to parameters values calculated at 126×126×396 μm3 (DSF=1), while the error in surface density was lowered from 12% to 1%. Even at low resolution (252×252×396 μm3, DSF=2), errors in postcorrection parameters did not exceed 10%.
Table 2.
Error in derived structural parameters induced by reduced resolution. Resolutions correspond to DSF=1.2, 1.5, and 2.0. Mean magnitude of error in parameters are shown before and after corrections were applied and are relative to parameters calculated at 126×126×396 μm3 resolution (DSF=1).
| Resolution | 151×151×396 μm3 | 189×189×396 μm3 | 252×252×396 μm3 | |||
|---|---|---|---|---|---|---|
| Before | After | Before | After | Before | After | |
| BV∕TV (%) | 1.8 | 0.9 | 9.2 | 2.6 | 30.7 | 6.1 |
| Skeleton density (%) | 10.3 | 0.9 | 22.9 | 1.1 | 37.9 | 1.6 |
| Surface density (%) | 12.4 | 1.0 | 27.8 | 1.6 | 45.6 | 2.6 |
| Curve count (%) | 7.8 | 3.6 | 16.6 | 7.0 | 24.3 | 8.7 |
| Surface-to-curve ratio (%) | 16.0 | 3.2 | 32.7 | 4.5 | 49.6 | 8.3 |
Detection sensitivity of bone loss
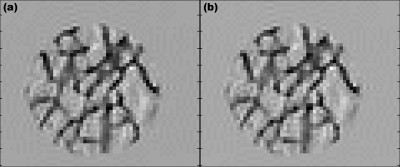
Figure 11 shows resampled images before and after heterogeneous erosion corresponding to a 5% reduction in bone volume fraction. These images appear visually indistinguishable due to the minute quantity of bone removed and subsequent downsampling and noise addition to simulate in vivo imaging conditions. Most of the derived topological parameters significantly changed in response to bone loss for both homogeneous and heterogeneous loss models (Fig. 12). Highly significant changes, commensurate with expectation, were detected for both voxel sizes simulated at SNR=12 for BV∕TV, surface density and surface-to-curve ratio, which were all decreased (p<0.0005). Most notably, the bone loss recovered by the virtual bone biopsy (VBB) was in excellent agreement with the applied value. Finally, both etiologies of bone loss caused the erosion index to increase (p<0.0005). Curve density showed no significant changes after homogeneous erosion and the change in junction density was not significant after heterogeneous erosion.
Figure 11.
Sample slices of pre- (a) and posterosion (b) simulated μMR images obtained by resampling 21 μm isotropic resolution μCT images to clinical resolution (137×137×410 μm3). Changes caused by erosion are not visually apparent but are readily quantifiable by the VBB algorithm.
Figure 12.
Relative changes in structural parameters detected by VBB processing after downsampling the data to clinical voxel size and SNR levels following removal of 5% bone volume through heterogeneous (a) and homogeneous (b) erosion of the 21 μm resolution images. Error bars indicate the standard deviation of the changes.
DISCUSSION
In MRI, scan time and intrinsic detection sensitivity limit the achievable SNR and thus spatial resolution. In CT, the parameter imposing practical limits on voxel size, and thus resolution, is radiation dose. In the regime of SNR and resolution achievable in vivo with the two modalities, partial volume and point-spread function blurring, as well as noise, are shown to affect the derived structural parameters. Even though this study was performed largely from the perspective of μMRI, it may have implications on CT as well.
The ability to retrospectively correct for variations in parameter values caused by subject and equipment-dependent effects on noise and resolution should be of significant practical interest in clinical imaging of trabecular bone microstructure. Patient-dependent variations in SNR can occur as a result of anatomic variations in the size of the limb being scanned, in particular in conjunction with surface coils, which have a spatially variant reception profile. The resulting errors can thus easily mask the effects under study for differentiating between patient groups. Longitudinal studies designed to evaluate the effect of intervention, such as treatment with antiresorptive or anabolic drugs, require a particularly high degree of stability of the imaging conditions between base line and repeat examination.
There is currently no standard for image resolution in μMRI of trabecular bone. Recent work in the distal extremities have used image voxel sizes ranging from 7.7×10⁻³ mm3 to 1.2×10⁻² mm3 or even as large as 2.1×10⁻² mm3 (see Refs. 33, 40, 13) Resolution and SNR in MRI are trade-off parameters, but it is not known whether enhancing resolution at the expense of SNR increases or decreases detection sensitivity. It is also unknown what errors are incurred by imaging at anisotropic resolution (typically voxel size is chosen larger along the anatomic axis with an anisotropy ratio of about 3:1).41 Application of corrections to resolution-induced errors in VBB processing would prove useful in comparing images of subjects scanned at different resolutions.
The practically achievable resolution for a particular anatomic location is largely governed by the SNR achievable at that voxel size and determined by the hardware (field strength, RF receive coils) as well as the tolerable scan time. However, SNR can vary substantially between subjects, in particular in conjunction with surface coils where the signal is a function of the depth from the surface. Even when the same patient is studied repeatedly, as in treatment effect monitoring, patient-related effects such as weight gain between imaging sessions or inconsistent coil placement can give rise to variations in SNR. The results of the noise variation simulations show that variations in SNR produce systematic changes in the computed structural parameters. BV∕TV derived with the bone volume fraction algorithm used35 is shown to be nearly invariant down to SNR levels of about 10, thereafter increasing progressively toward lower SNR. Generally, parameters obtained at a given SNR or resolution were linearly related to those obtained under reference conditions, independent of the structural characteristics of the bone examined (which in this work covered a range of anatomic locations and bone volume fractions). Such a behavior is shown to lend itself for retrospective correction. The empirically derived functions allowing correction for effects of noise and reduced effective resolution have been found to be well behaved and can be defined explicitly or as piecewise splines. Some parameters, such as BV∕TV and surface voxel classification parameters, changed in a particularly regular and predictable manner with SNR, while others, typically curve-type voxel classes, exhibited a more erratic behavior. The data show that the more predictable parameters are amenable to retrospective correction, i.e., there was a more significant reduction of noise and resolution induced errors after applying linear transformation corrections. The results from a subset of a previously performed fracture study in postmenopausal women using the authors’ VBB technology show that the behavior of the surface density (Fig. 10) closely parallels that predicted by the simulations, thus lending further credence to the practicality of the proposed correction scheme.
At clinically practiced resolution (currently 137×137×410 μm3 at 1.5 T field strength in the authors’ laboratory) and 160×160×160 μm3 (more recently achieved at 3 T with new RF coil technology), SNR=12 chosen for the simulations is realistic. Under these conditions, BV∕TV and the most common topological quantities were significantly different post erosion for both models of bone loss (Fig. 12) even though the cross-sectional images are visually indistinguishable (Fig. 11). Heterogeneous erosion caused a consistently significant decrease in the surface-to-curve ratio, and an increase in the erosion index [Fig. 12a]. These parameters had previously been shown in studies performed by in vivo structure analysis to exhibit disproportionately large differences between postmenopausal women with and without vertebral fractures.22, 42 Such an etiology, indicative of gradual conversion of plate-like to rod-like bone,3 is well known to occur in postmenopausal osteoporosis.43 A recent longitudinal μMRI study conducted in early postmenopausal women based on images of resolution and SNR comparable to those used in the present work was able to detect topological changes of magnitude similar to those in our simulations.44 The present work therefore provides further evidence that subtle changes in response to intervention or hormone loss are quantifiable in the limited spatial resolution regime of in vivo μMRI and, further, that the simulated loss in bone volume fraction of 5% is accurately recovered at in vivo resolution.
In the second model examined [homogeneous bone loss, Fig. 12b] a similar, albeit less pronounced, pattern emerges, again with a decrease in surface-to-curve ratio and an increase in erosion index. Clearly, even when bone is lost homogeneously (a pattern more consistent with corticosteroid-induced osteoporosis45, 46), perforations will occur since trabecular thickness is spatially variant. However, the above effects are generally smaller in this case. The consistently observed reduction in the junction density parameter for homogeneous erosion (but not for heterogeneous erosion) could be interpreted as resulting from disconnection of trabecular elements due to thinning, thereby reducing the number of junctions between struts and plates.
One limitation of the present study is the relatively small number of samples studied, even though these covered a wide range of structure types and the form of the transformation function for a given parameter was found to be an excellent match for all nine specimens. It would therefore be desirable to test the linear transformation hypothesis on a larger cohort of specimens and in patient data. Future studies of the effects of noise and resolution on VBB processing may therefore involve application of noise and resolution corrections to images acquired in vivo, to determine whether such corrections improve the sensitivity for group differentiation (e.g., treatment versus placebo) by accounting for inconsistencies in image SNR of time-series data. Additionally, the sensitivity of digital processing algorithms can be further tested through additional simulations by incrementally varying the fractional change in bone volume for different image resolution and SNR regimes, thereby determining the limit at which digital image analysis can detect bone loss (or accrual in response to treatment). Finally, the ideal balance between SNR and resolution needs to be determined by trading between resolution and SNR.
A more fundamental limitation relates to the assessment of the accuracy for retrospective corrections for resolution-induced errors. While structural parameters can be derived from images simulated with infinitely high SNR as a gold standard for noise-induced error correction, it is, of course, not feasible to simulate images with infinitely high resolution to generate a reference standard for resolution-induced error correction. It also needs to be noted that topological parameters inherently depend on resolution and voxel size. It is evident, for example, that depending on voxel size, a narrow plate will either be classified as a curve or surface after skeletonization.23
So far, we have confined ourselves to the topological parameters, but the more traditional measures adapted from histomorphometry, used for analysis of in vivo μMRI (Ref. 4) and high-resolution pQCT,7 need to be examined in greater detail as well. A few studies have compared μCT derived structural measures with those obtained with in vivo imaging modalities and correlations were noted (see, for example, Ref. 47). However, no studies exist which systematically examine the effects of resolution and noise on the derived structural measures or the implications of these fundamental imaging parameters on detection sensitivity.
CONCLUSIONS
Variations in SNR and resolution of simulated trabecular bone μMR images cause systematic errors in the derived parameters representative of topology and scale of the trabecular network. The data suggest that the resulting errors can be retrospectively corrected using empirical methods. These corrections would be a crucial step in comparing structural parameters calculated from images with varying voxel size and SNR, or in normalizing parameters calculated from single images with spatially varying noise. Last, we have provided evidence that our analysis algorithms may be able to detect topological changes in trabecular structure caused by small decrements of bone loss, such as those expected clinically over the period of 1 year following menopause, under conditions currently achievable in vivo.
ACKNOWLEDGMENTS
This work was supported by NIH Grant Nos. R01 AR41443, R01 AR53156 and R01 AR051376.
References
- Seeman E. and Delmas P. D., “Bone quality—The material and structural basis of bone strength and fragility,” N. Engl. J. Med. 354, 2250–2261 (2006). [DOI] [PubMed] [Google Scholar]
- Barger-Lux M. J. and Recker R. R., “Bone microstructure in osteoporosis: Transilial biopsy and histomorphometry,” Top Magn. Reson Imaging 13, 297–305 (2002). [DOI] [PubMed] [Google Scholar]
- Hildebrand T., Laib A., Muller R., Dequeker J., and Ruegsegger P., “Direct three-dimensional morphometric analysis of human cancellous bone: microstructural data from spine, femur, iliac crest, and calcaneus,” J. Bone Miner. Res. 10.1359/jbmr.1999.14.7.1167 14, 1167–1174 (1999). [DOI] [PubMed] [Google Scholar]
- Majumdar S., “Magnetic resonance imaging of trabecular bone structure,” Top Magn. Reson Imaging 13, 323–334 (2002). [DOI] [PubMed] [Google Scholar]
- Wehrli F. W., Saha P. K., Gomberg B. R., and Song H. K., “Noninvasive assessment of bone architecture by magnetic resonance micro-imaging-based virtual bone biopsy,” Proc. IEEE 10.1109/JPROC.2003.817867 91, 1520–1542 (2003). [DOI] [Google Scholar]
- Wehrli F. W., Song H. K., Saha P. K., and Wright A. C., “Quantitative MRI for the assessment of bone structure and function,” NMR Biomed. 10.1002/nbm.1066 19, 731–764 (2006). [DOI] [PubMed] [Google Scholar]
- Boutroy S., Bouxsein M. L., Munoz F., and Delmas P. D., “In vivo assessment of trabecular bone microarchitecture by high-resolution peripheral quantitative computed tomography,” J. Clin. Endocrinol. Metab. 90, 6805–6815 (2005). [DOI] [PubMed] [Google Scholar]
- Khosla S., Riggs B. L., Atkinson E. J., Oberg A. L., McDaniel L. J., Holets M., Peterson J. M., and L. J.MeltonIII, “Effects of sex and age on bone microstructure at the ultradistal radius: A population-based noninvasive in vivo assessment,” J. Bone Miner. Res. 10.1359/JBMR.050916 21, 124–131 (2006). [DOI] [PMC free article] [PubMed] [Google Scholar]
- Majumdar S., Newitt D., Mathur A., Osman D., Gies A., Chiu E., Lotz J., Kinney J., and Genant H., “Magnetic resonance imaging of trabecular bone structure in the distal radius: Relationship with x-ray tomographic microscopy and biomechanics,” Osteoporosis Int. 10.1007/BF01623011 6, 376–385 (1996). [DOI] [PubMed] [Google Scholar]
- Wehrli F. W., Hwang S. N., Ma J., Song H. K., Ford J. C., and Haddad J. G., “Cancellous bone volume and structure in the forearm: noninvasive assessment with MR microimaging and image processing [published erratum appears in Radiology 1998 Jun; 207(3):833],” Radiology 206, 347–357 (1998). [DOI] [PubMed] [Google Scholar]
- Benito M., Gomberg B., Wehrli F. W., Weening R. H., Zemel B., Wright A. C., Song H. K., Cucchiara A., and Snyder P. J., “Deterioration of trabecular architecture in hypogonadal men,” J. Clin. Endocrinol. Metab. 88, 1497–1502 (2003). [DOI] [PubMed] [Google Scholar]
- Link T. M., Vieth V., Matheis J., Newitt D., Lu Y., Rummeny E. J., and Majumdar S., “Bone structure of the distal radius and the calcaneus vs BMD of the spine and proximal femur in the prediction of osteoporotic spine fractures,” Eur. Radiol. 12, 401–408 (2002). [DOI] [PubMed] [Google Scholar]
- Boutry N., Cortet B., Dubois P., Marchandise X., and Cotten A., “Trabecular bone structure of the calcaneus: Preliminary in vivo MR imaging assessment in men with osteoporosis,” Radiology 227, 708–717 (2003). [DOI] [PubMed] [Google Scholar]
- Ito M., Ikeda K., Nishiguchi M., Shindo H., Uetani M., Hosoi T., and Orimo H., “Multidetector row CT imaging of vertebral microstructure for evaluation of fracture risk,” J. Bone Miner. Res. 10.1359/JBMR.050610 20, 1828–1836 (2005). [DOI] [PubMed] [Google Scholar]
- Graeff C., Timm W., Nickelsen T. N., Farrerons J., Marin F., Barker C., and Gluer C. C., “Monitoring teriparatide associated changes in vertebral microstructure by high-resolution computed tomography in vivo: Results from the EUROFORS study,” J. Bone Miner. Res. 22, 1426–1433 (2007). [DOI] [PubMed] [Google Scholar]
- Majumdar S., Link T. M., Augat P., Lin J. C., Newitt D., Lane N. E., and Genant H. K., “Trabecular bone architecture in the distal radius using magnetic resonance imaging in subjects with fractures of the proximal femur. Magnetic Resonance Science Center and Osteoporosis and Arthritis Research Group,” Osteoporosis Int. 10, 231–239 (1999). [DOI] [PubMed] [Google Scholar]
- Feldkamp L. A., Goldstein S. A., Parfitt A. M., Jesion G., and Kleerekoper M., “The direct examination of three-dimensional bone architecture in vitro by computed tomography,” J. Bone Miner. Res. 4, 3–11 (1989). [DOI] [PubMed] [Google Scholar]
- Laib A. and Ruegsegger P., “Calibration of trabecular bone structure measurements of in vivo three-dimensional peripheral quantitative computed tomography with 28-micron-resolution microcomputed tomography,” Bone (N.Y.) 10.1016/S8756-3282(98)00159-8 24, 35–39 (1999). [DOI] [PubMed] [Google Scholar]
- Hwang S. N. and Wehrli F. W., “Estimating voxel volume fractions of trabecular bone on the basis of magnetic resonance images acquired in vivo,” Int. J. Imaging Syst. Technol. 10, 186–198 (1999). [DOI] [Google Scholar]
- Saha P. and Wehrli F., “Measurement of trabecular bone thickness in the limited resolution regime of in vivo MRI by fuzzy distance transform,” IEEE Trans. Med. Imaging 10.1109/TMI.2003.819925 23, 53–62 (2004). [DOI] [PubMed] [Google Scholar]
- Saha P. K., Udupa J. K., and Odhner D., “Scale-based fuzzy connected image segmentation: Theory, algorithms, and validation,” Comput. Vis. Image Underst. 10.1006/cviu.1999.0813 77, 145–174 (2000). [DOI] [Google Scholar]
- Wehrli F. W., Gomberg B. R., Saha P. K., Song H. K., Hwang S. N., and Snyder P. J., “Digital topological analysis of in vivo magnetic resonance microimages of trabecular bone reveals structural implications of osteoporosis,” J. Bone Miner. Res. 10.1359/jbmr.2001.16.8.1520 16, 1520–1531 (2001). [DOI] [PubMed] [Google Scholar]
- Gomberg B. G., Saha P. K., Song H. K., Hwang S. N., and Wehrli F. W., “Application of topological analysis to magnetic resonance images of human trabecular bone,” IEEE Trans. Med. Imaging 10.1109/42.845175 19, 166–174 (2000). [DOI] [PubMed] [Google Scholar]
- Vesterby A., “Star volume of marrow space and trabeculae in iliac crest: Sampling procedure and correlation to star volume of first lumbar vertebra,” Bone (N.Y.) 11, 149–155 (1990). [DOI] [PubMed] [Google Scholar]
- Parfitt A. M., Mathews C. H. E., Villanueva A. R., Kleerekoper M., Frame B., and Rao D. S., “Relationships between surface, volume, and thickness of iliac trabecular bone in aging and in osteoporosis. Implications for the microanatomic and cellular mechanisms of bone loss,” J. Clin. Invest. 72, 1396–1409 (1983). [DOI] [PMC free article] [PubMed] [Google Scholar]
- Hahn M., Vogel M., Pompesius-Kempa M., and Delling G., “Trabecular bone pattern factor—A new parameter for simple quantification of bone microarchitecture,” Bone (N.Y.) 10.1016/8756-3282(92)90078-B 13, 327–330 (1992). [DOI] [PubMed] [Google Scholar]
- Mellish R. W., Ferguson-Pell M. W., Cochran G. V., Lindsay R., and Dempster D. W., “A new manual method for assessing two-dimensional cancellous bone structure: comparison between iliac crest and lumbar vertebra,” J. Bone Miner. Res. 6, 689–696 (1991). [DOI] [PubMed] [Google Scholar]
- Hildebrand T. and Rüegsegger P., “Quantification of bone microarchitecture with the structure model index,” Comput. Methods Biomech. Biomed. Eng. 1, 15–23 (1997). [DOI] [PubMed] [Google Scholar]
- Amling M., Posl M., Ritzel H., Hahn M., Vogel M., Wening V. J., and Delling G., “Architecture and distribution of cancellous bone yield vertebral fracture clues. A histomorphometric analysis of the complete spinal column from 40 autopsy specimens,” Arch. Orthop. Trauma Surg. 115, 262–269 (1996). [DOI] [PubMed] [Google Scholar]
- Parfitt A. M., “Implications of architecture for the pathogenesis and prevention of vertebral fracture,” Bone (N.Y.) 13, S41–S47 (1992). [DOI] [PubMed] [Google Scholar]
- Saha P. K., Gomberg B. R., and Wehrli F. W., “Three-dimensional digital topological characterization of cancellous bone architecture,” Int. J. Imaging Syst. Technol. 11, 81–90 (2000). [DOI] [Google Scholar]
- Ladinsky G. A., Vasilic B., Popescu A. M., Wald M., Zemel B. S., Snyder P. J., Loh L., Song H. K., Saha P. K., Wright A. C., and Wehrli F. W., “Trabecular structure quantified with the MRI-based virtual bone biopsy in postmenopausal women contributes to vertebral deformity burden independent of areal vertebral BMD,” J. Bone Miner. Res. 10.1359/jbmr.070815 23, 64–74 (2008). [DOI] [PMC free article] [PubMed] [Google Scholar]
- Benito M., Vasilic B., Wehrli F. W., Bunker B., Wald M., Gomberg B., Wright A. C., Zemel B., Cucchiara A., and Snyder P. J., “Effect of testosterone replacement on bone architecture in hypogonadal men,” J. Bone Miner. Res. 10.1359/JBMR.050606 20, 1785–1791 (2005). [DOI] [PubMed] [Google Scholar]
- Gudbjartsson H. and Patz S., “The Rician distribution of noisy MRI data,” Magn. Reson. Med. 10.1002/mrm.1910340618 34, 910–914 (1995). [DOI] [PMC free article] [PubMed] [Google Scholar]
- Vasilic B. and Wehrli F. W., “A novel local thresholding algorithm for trabecular bone volume fraction mapping in the limited spatial resolution regime of in-vivo MRI,” IEEE Trans. Med. Imaging 10.1109/TMI.2005.859192 24, 1574–1585 (2005). [DOI] [PubMed] [Google Scholar]
- Magland J. F. and Wehrli F. W., “Trabecular bone structure analysis in the limited spatial resolution regime of in vivo MRI,” Acad. Radiol. 15(12), 1482–1493 (2008). [DOI] [PMC free article] [PubMed] [Google Scholar]
- Guo X. E. and Kim C. H., “Mechanical consequence of trabecular bone loss and its treatment: A three-dimensional model simulation,” Bone (N.Y.) 10.1016/S8756-3282(01)00673-1 30, 404–411 (2002). [DOI] [PubMed] [Google Scholar]
- Muller R., “Long-term prediction of three-dimensional bone architecture in simulations of pre-, peri- and post-menopausal microstructural bone remodeling,” Osteoporosis Int. 16, S25–S35 (2005). [DOI] [PubMed] [Google Scholar]
- van der Linden J. C., Homminga J., Verhaar J. A., and Weinans H., “Mechanical consequences of bone loss in cancellous bone,” J. Bone Miner. Res. 16, 457–465 (2001). [DOI] [PubMed] [Google Scholar]
- C. H.ChesnutIII, Majumdar S., Newitt D. C., Shields A., Van Pelt J., Laschansky E., Azria M., Kriegman A., Olson M., Eriksen E. F., and Mindeholm L., “Effects of salmon calcitonin on trabecular microarchitecture as determined by magnetic resonance imaging: results from the QUEST study,” J. Bone Miner. Res. 20, 1548–1561 (2005). [DOI] [PMC free article] [PubMed] [Google Scholar]
- Wehrli F. W., “Structural and functional assessment of trabecular and cortical bone by micro magnetic resonance imaging,” J. Magn. Reson Imaging 25(2), 390–409 (2007). [DOI] [PubMed] [Google Scholar]
- Lin W., Ladinsky G. A., Wehrli F., and Song H. K., “Image metric-based correction (autofocusing) of motion artifacts in high-resolution trabecular bone imaging,” J. Magn. Reson Imaging 26, 191–197 (2007). [DOI] [PubMed] [Google Scholar]
- Parfitt A. M., “Trabecular bone architecture in the pathogenesis and prevention of fracture,” Am. J. Med. 10.1016/0002-9343(87)90274-9 82, 68–72 (1987). [DOI] [PubMed] [Google Scholar]
- Wehrli F. W., Ladinsky G. A., Jones C., Benito M., Magland J., Vasilic B., Popescu A. M., Zemel B., Cucchiara A. J., Wright A. C., Song H. K., Saha P. K., Peachey H., and Snyder P. J., “In vivo magnetic resonance detects rapid remodeling changes in the topology of the trabecular bone network following menopause and protective effect of estradiol,” J. Bone Miner. Res. 10.1359/jbmr.080108 23, 730–740 (2008). [DOI] [PMC free article] [PubMed] [Google Scholar]
- Aaron J. E., Johnson D. R., Paxton S., and Kanis J. A., “Secondary osteoporosis and the microanatomy of trabecular bone,” Clin. Rheumatol. 8, 84–88 (1989). [DOI] [PubMed] [Google Scholar]
- Takahashi M., Wehrli F. W., Hilaire L., Zemel B. S., and Hwang S. N., “In vivo NMR microscopy allows short-term serial assessment of multiple skeletal implications of corticosteroid exposure,” Proc. Natl. Acad. Sci. U.S.A. 19, 19 (2002). [DOI] [PMC free article] [PubMed] [Google Scholar]
- Phan C. M., Matsuura M., Bauer J. S., Dunn T. C., Newitt D., Lochmueller E. M., Eckstein F., Majumdar S., and Link T. M., “Trabecular bone structure of the calcaneus: Comparison of MR imaging at 3.0 and 1.5 T with micro-CT as the standard of reference,” Radiology 239, 488–496 (2006). [DOI] [PubMed] [Google Scholar]


