Abstract
Digital breast tomosynthesis (DBT) is a three-dimensional (3D) x-ray imaging modality that reconstructs image slices parallel to the detector plane. Image acquisition is performed using a limited angular range (less than 50 degrees) and a limited number of projection views (less than 50 views). Due to incomplete data sampling, image artifacts are unavoidable in DBT. In this preliminary study, the image artifacts in DBT were investigated systematically using a linear system approximation. A cascaded linear system model of DBT was developed to calculate the 3D presampling modulation transfer function (MTF) with different image acquisition geometries and reconstruction filters using a filtered backprojection (FBP) algorithm. A thin, slanted tungsten (W) wire was used to measure the presampling MTF of the DBT system in the cross-sectional plane defined by the thickness (z-) and tube travel (x-) directions. The measurement was in excellent agreement with the calculation using the model. A small steel bead was used to calculate the artifact spread function (ASF) of the DBT system. The ASF was correlated with the convolution of the two-dimensional (2D) point spread function (PSF) of the system and the object function of the bead. The results showed that the cascaded linear system model can be used to predict the magnitude of image artifacts of small, high-contrast objects with different image acquisition geometry and reconstruction filters.
Keywords: tomosynthesis, breast imaging, linear system model, ASF, PSF, MTF
INTRODUCTION
The diagnosis of breast cancer using mammography, the current standard in breast cancer screening, suffers from the obscuring effect of overlapping breast tissue due to the projection of a three-dimensional (3D) object onto a two-dimensional (2D) image. Laya et al. reported that the sensitivity and specificity of breast cancer detection using mammography are only 89% and 85%, respectively.1 Digital breast tomosynthesis (DBT) overcomes this limitation by acquiring a limited number of projection images over a specified angular span and reconstructing a number of thin slices (typically 1 mm) parallel to the detector plane. In contrast-detail phantom studies DBT was shown to significantly outperform projection images in object detection.2, 3 Investigators have used mastectomy samples to illustrate the increased conspicuity of lesions made possible by the removal of structural noise.4, 5 In preliminary clinical studies, microcalcifications and low-contrast lesions were made more visible.6
Because DBT involves the reconstruction of a 3D object imaged with a limited number of views over a limited angular span, image artifacts are unavoidable. Reconstructions with simple or filtered backprojection (FBP) algorithms generate out-of-plane artifacts which appear as blurred (in the direction of tube motion) versions of the in-plane objects. Previous studies have proposed reconstruction methods to suppress or reduce the amplitude of the artifacts.7, 8, 9, 10, 11 A number of investigators have studied the dependence of out-of-plane artifacts on imaging geometry and reconstruction algorithms. Mertelmeier et al. found that by limiting the frequency response in the z-direction (i.e., the slice thickness direction) through the application of a slice-thickness filter, the intensity of the artifact is spread throughout a larger thickness in the reconstructed image, decreasing its intensity.12 Investigators have calculated the degradation of the modulation transfer function (MTF), with respect to the depth from the in-focus plane to determine the effective thickness of the reconstructed slice and to quantify the effect of the out-of-plane artifact in the reconstructed image.13, 14, 15 Deller et al. referred to the blurred out-of-plane artifact as ripple and related it to the distance from the in-plane location and the scan geometry.15 Wu et al. have quantified the out-of-plane artifact using the artifact spread function (ASF), which is defined as the ratio between the contrast of the object outside of the plane of its location to that of that in-plane. ASF has typically been plotted as a function of distance from the object location.6, 16, 17, 18 Others have used ASF in both experimental and simulation studies to quantify the dependence of the artifact on acquisition and reconstruction methods for calcifications and masses.17, 18 Although ASF provides a simple quantification of the amplitude of the artifact in the thickness direction, it does not provide the spatial distribution of the blurred pattern of the artifact, which is in the tube travel direction.
In this preliminary study, the image artifacts in DBT were investigated systematically using a linear system approximation. A cascaded linear system model was developed to calculate the 3D presampling modulation transfer function (MTF) for DBT with different image acquisition geometries and reconstruction filters. The inverse Fourier transform of the MTF provides the 3D point spread function (PSF). The 2D PSF in the x-z cross-sectional plane, where x-represents the tube travel direction, was used to investigate the out-of-plane blur artifact. In our experimental study, a thin tungsten (W) wire was placed at a small angle with respect to the detector surface to measure the 2D oversampled PSF in the x-z plane. The measured PSF was compared with the modeled results. A small steel bead was used to calculate the ASF of the DBT system. The ASF was correlated with the convolution of the 2D PSF of the system and the object function of the bead.
THEORY AND METHODS
System geometry and image reconstruction
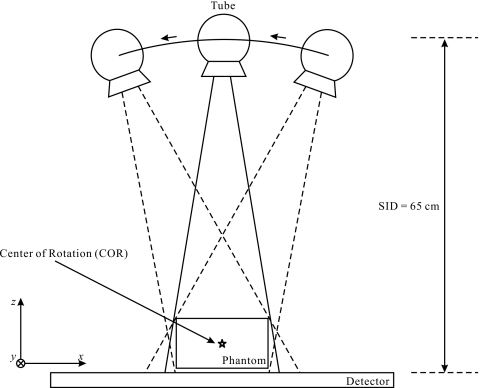
The experimental system used in our investigation was a prototype Siemens NovationTOMO DBT unit with source-to-imager distance (SID) of 65 cm. (This is an investigations device, and limited by U.S. Federal law to investigational use. The information about this product is preliminary. The product is under development and is not commercially available in the U.S.; its future availability cannot be ensured.) It incorporates a large area amorphous selenium (a-Se) full field digital mammography detector with 85 μm pixel size and 2816×3584 pixels. During a DBT scan, as shown in Fig. 1, the detector remains stationary while the x-ray tube travels continuously in an arc with respect to a center of rotation (COR) that is 4.5 cm above the detector cover, which is 1.5 cm above the a-Se layer. The angular range of tube motion is ±25 degrees relative to the vertical position and the angular range over which x-ray images are acquired is nominally ±20 degrees. The number of views acquired during one DBT scan can be varied from 11 to 49. The actual angular position of the x-ray tube at the beginning of radiation exposure for each view was measured with an inclinometer mounted in the tube housing (MicroStrain, Inc., Burlington, VT), which measures the tilt angle of the x-ray tube column with respect to gravity. The angular position measurements were saved in a parameter file and used later to set up the accurate geometry for image reconstruction.
Figure 1.
The experimental DBT unit operates under partial isocentric motion with a stationary detector. The x-ray tube travels along an arc in the x-z plane with an angular range of ±25 degrees.
Image reconstruction was performed using an FBP algorithm.12, 19 In the present study, images were acquired using a W∕rhodium (Rh) target∕filter combination with a 28 kVp spectrum and a total exposure of 250 mAs, which corresponds to a glandular dose of 2.6 mGy for a 4.2 cm breast with average density. For each tomosynthesis scan, 49 views were acquired over a nominal angular range of ±20 degrees with the detector operated in full resolution mode, i.e., mode “x49.”20
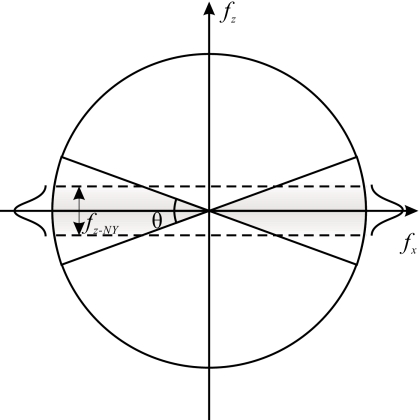
According to central slice theorem, the frequency space in the x-z plane that is sampled by DBT acquisition has a double wedge shape with angle θ, as shown in Fig. 2. The incomplete sampling results in an out-of-plane artifact in the reconstructed image, which is manifested as streaks for a point object. Depending on the reconstruction filtering of the FBP algorithm, the streak pattern exhibits different traits. Three reconstruction filters were implemented in the FBP algorithm used in our study: (1) Ramp filter, RA,
| (1) |
where θ is the angular range of DBT acquisition and fx−NY is the Nyquist frequency in the x-direction of the reconstructed volume; (2) Spectral apodization filter, SA, to limit the frequency response in the x-direction, which is in the form of a Hanning window,
| (2) |
where A is the cutoff frequency defining the window width; (3) Slice-thickness filter, ST, to limit the frequency response in the z-direction, which is also in the form of a Hanning window,
| (3) |
where B is the cutoff frequency. A and B are usually given in multiples of the Nyquist frequencies of the projection images fNY, which is 5.88 cycles∕mm for full resolution readout. The Nyquist frequencies of the reconstructed images are
| (4) |
and
| (5) |
where dx is the in-plane voxel dimension, i.e., pixel size of the reconstructed image slices, and dz is the slice thickness.
Figure 2.
DBT acquires images over a limited angular range. The sampled region in the frequency domain is in the shape of a double wedge with angle θ. The effect of the slice-thickness filter is highlighted with gradient shading.
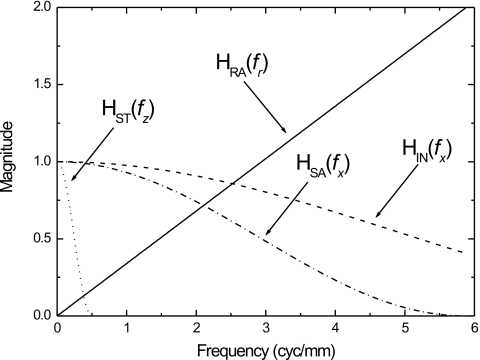
Four filter schemes were used to investigate the effects of reconstruction parameters on the artifacts. They are listed in Table 1: (1) Simple backprojection (SBP), i.e., no reconstruction filters; (2) RA filter only; (3) RA and SA filters, with relative Hanning window width A=1 for the SA filter; (4) RA, SA, and ST filters, with A=1 and B=0.085. Shown in Fig. 3 are the filter functions with the parameters chosen for our present investigation. It shows that the SA and ST filters eliminate frequency components above fx−NY and fz−NY, respectively, thus minimizing noise aliasing in the reconstructed images. With filter schemes 1 and 2, the interpolation filter, which is associated with the bilinear interpolation used in our voxel driven cone-beam reconstruction algorithm, is able to reduce the frequency response in the x-direction.
Table 1.
Summary of the reconstruction filter schemes used in our investigation.
| Filter scheme 1 | SBP |
| Filter scheme 2 | HRA |
| Filter scheme 3 | HRAXHSA(A=1) |
| Filter scheme 4 | HRAXHSA(A=1)XHST(B=0.085) |
Figure 3.
The reconstruction filter functions in their corresponding spatial frequency directions. The RA filter, HRA, is given as a function of fx and fz, the SA filter, HSA, is given as a function of fx, and the slice thickness filter, HST, is given as a function of fz. The interpolation filter, HIN, is plotted as a function of fx however; in two dimensions it is a function of both fx and fy.
Imaging a slanted tungsten wire
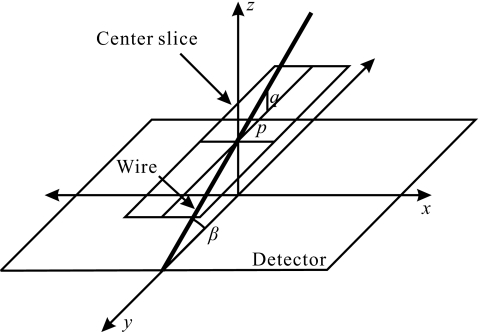
In the work by Eberhard et al., wires of different thicknesses were used to investigate artifacts in DBT. The wires, placed parallel to the detector, were imaged and reconstructed to an isotropic voxel size (i.e., slice thickness equal to a pixel size of 0.1 mm). The intensity of the artifact in the cross-sectional plane (x-z) was investigated for different wire thicknesses.21 In our present investigation, as shown in Fig. 4, a thin W wire that is 70 μm in diameter was placed with a tilt angle, β, with respect to the detector plane, and orthogonal to the direction of tube travel. The DBT images were acquired with the maximum angular range and number of views, i.e., 49 views over ∼±20 degrees. The reconstruction was performed using the filter schemes shown in Table 1 and the reconstructed slice thickness was dz=1 mm.
Figure 4.
A tungsten wire phantom is used to image a 2D point spread function (PSF). The wire is tilted at an angle, β, with respect to the z-axis and oriented orthogonally to the direction of tube motion.
The tilt angle, β, was calculated by creating a vector of the y-position of the data point with the maximum intensity for each slice of the reconstructed image. A linear fitting of the vector was then used to calculate the tilt angle using
| (6) |
where Δz is the total thickness of the reconstructed volume and Δy is the difference between the maximum and minimum y-positions of the data points with maximum intensity.
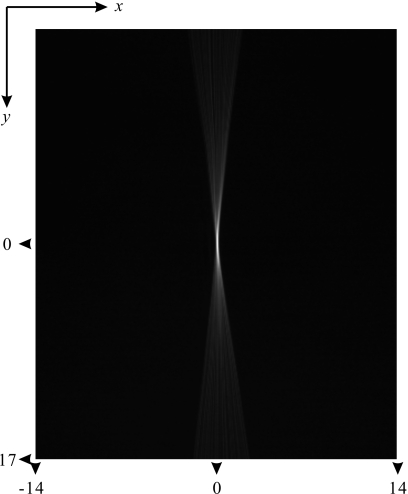
To obtain an oversampled PSF in the z-direction, we used the in-plane (x-y) images of the tilted W wire. Shown in Fig. 5 is an example of the in-plane image for the wire. The point with maximum intensity is designated as the in-focus point, or the point at which the wire is at the same physical depth as the center of the slice. We denote this point as the origin for the PSF, i.e., x=y=0. A point on the wire with a distance in the y-direction of p from the origin is at a distance q in the z-direction from the in plane. The relationship between p and q, as shown in Fig. 5, is given by
| (7) |
The in-plane intensity of the wire decreases with increased distance, p, from which the PSF as a function of q can be derived using Eq. 7. Since the sampling distance in y is equal to the sampling distance in x, dx=0.085 mm, the sampling distance in the z-direction, , is given by . Therefore, the in-plane image of the wire can be converted to an x-z relationship and obtain an oversampled (in the z-direction) PSF, the Fourier transform of which forms the MTF.
Figure 5.
The in-plane (x-y) image of a tilted W wire phantom reconstructed using simple backprojection (SBP). Both axes are in units of mm. The z-dependence of image intensity can be derived from the y-dependence using the angle of the wire and Eq. 7.
The 2D PSF was also investigated as a function of angular range. A subset of the 49 projection images from the original acquisition was selected to simulate the performance with different angular ranges. Since the angular separation of the original DBT scan was ∼0.8 degrees, choosing the central projection and six adjacent views from each side would result in an angular range of ±5 degrees. Similarly, an angular range of ±10 and ±15 could be simulated by including 12 and 18 views from each side.
Cascaded linear system model
A 3D cascaded linear system model has been developed to investigate the imaging performance of DBT with FBP reconstruction and understand their relationship with projection image quality. The model can be used to predict the 3D imaging performance of DBT and has been described in detail elsewhere.22 Here, we made a slight modification of the model to take into account the partial isocentric geometry of the prototype DBT system, i.e., the detector remains stationary while the tube travels in an arc. The main difference of a stationary detector is that the frequency information of the projection view at angle θi is scaled by 1∕cos(θi) compared to that in an isocentric geometry, where the detector rotates with the x-ray tube around a pivot point. For the purpose of the present investigation, the relevant part of the model is the calculation of 3D presampling MTF for DBT.
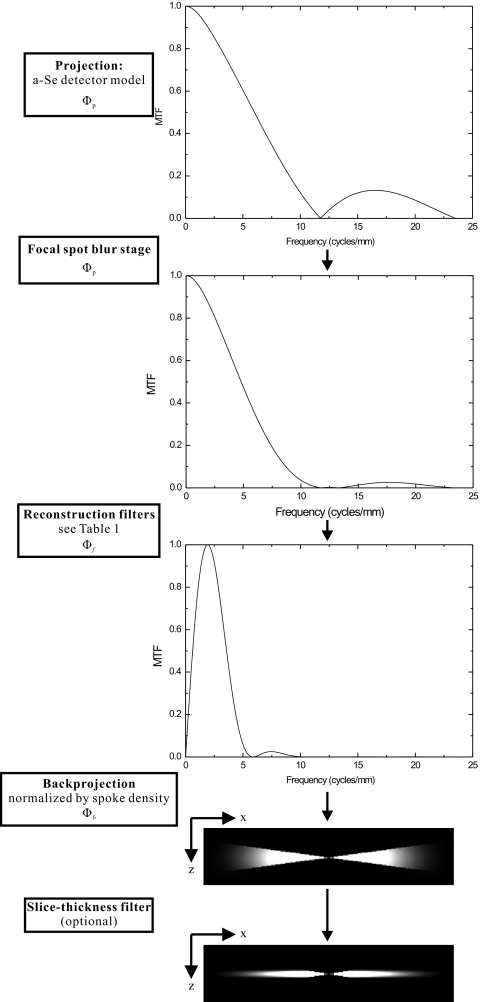
Shown in Fig. 6 is the flow chart of the cascaded linear system model for the MTF of DBT. The signal spectrum Φp for the projection images was first generated using a cascaded linear system model for a-Se flat panel detectors.23 The shape of Φp is identical to the presampling MTF of the detector, which is dominated by the aperture function of the pixel electrode. The next stage is the additional blur introduced by focal spot motion (FSM), since the gantry in our prototype system travels continuously during DBT acquisition. The additional focal spot blur (FSB) due to motion is only in the tube travel direction, and its function HFSB(fx) is given by
| (8) |
where a0 and a1 are the nominal width and travel distance of the focal spot, respectively. With a stationary detector, the effect of FSB on the projection image increases with the magnification of the plane of interest, which causes HFSB(f) to be position dependent. For simplicity, HFSB(f) was calculated for tube angle θ=0 and d=4 cm above the detector surface. The focal spot travel distance during each view of “x49” mode acquisition is a1=0.3 mm, which corresponds to an exposure time of 30 ms and gantry travel speed of 10 mm∕s. This value for a1 is comparable to the nominal size of the large focal spot and therefore, according to our previous calculations, not expected to add noticeable blur to the MTF.20
Figure 6.
Flow chart showing the cascaded stages of the linear system model for calculating the 3D MTF of the DBT system. The left column shows the description of each stage, and the graphs on the right show conceptually the change in MTF after each cascaded stage.
After FSB, Φp was subsequently multiplied with the filter functions associated with one of the four filtering schemes listed in Table 1. Because voxel driven backprojection was used in the reconstruction, a bilinear interpolation filter, HIN, was applied in both the x- and y-directions. The filter function, HIN(fx,fy), associated with bilinear interpolation is a sinc2 function, and is related to the pixel size in the x- and y-directions through
| (9) |
where mx and my are the pixel dimensions of the projection image. The filtered signal spectrum Φf is given by
| (10) |
The filtered spectra for all projection angles were mapped to the 3D space using the central slice theorem. For tomosynthesis acquisition with angular range θ and view number N, the output 3D signal spectrum Φb can be calculated using24
| (11) |
where δ(fx sin(θi)−fz cos(θi)) is incorporated to map the spectra of each projection image along angle θi into the 3D frequency domain, which means that the signal spectra only have values along the “spokes” defined by each angle θi. Then, to obtain signal spectra at any point on the Cartesian coordinate, the 3D spectra in Eq. 11 were normalized by the “spoke density,”
| (12) |
Finally, the 3D presampling MTF can be obtained by normalizing Φb by its zero frequency value,
| (13) |
The investigation of an artifact can be simplified to a 2D problem in the x-z plane. The PSF in the x-z plane, which is related to an artifact, can be obtained by taking the 2D inverse Fourier transform of the 2D MTF in the x-z plane, with fy=0.
Artifact of small, high-contrast object
A 0.4 mm steel bead was imaged to investigate the ASF of small, high-contrast objects, and its correlation with the x-z plane PSF. The bead was taped to the bottom surface of the compression paddle, which was positioned 2.1 cm above the detector surface. The DBT acquisition and image reconstruction parameters were identical to those used to image the slanted wire. The reconstructed images of the bead were used to quantify the artifact using ASF. The intensity of the in-plane bead image and its out-of-plane artifact was first integrated in the y-direction to obtain ρbead(x,z). This is equivalent to the simplification of fy=0 in the cascaded linear system model. Then, the maximum value of ρbead(x,z) for each plane, ρbm(z), was selected to compute the ASF as a function of depth z,6, 16, 17, 18
| (14) |
where z0 is the in-focus location of the reconstructed bead image, and ρb0 is the average background intensity of each reconstructed image plane.
Since the size of the steel bead (0.4 mm) is substantially larger than an ideal point, to facilitate the comparison between the measured ASF and the cascaded linear system model, the effect of object size has to be included in our modeled result. The presampling MTF(fx,fz) was multiplied with the object spectrum of a sphere, S(fx,fz), which is given by a Bessel function,25
| (15) |
where J1 is the first-order Bessel function of the first kind and d is the diameter of the sphere. The inverse Fourier transform of the result formed the modeled PSF of the steel bead, and its central vertical line was normalized to form the modeled ASF.
The ASF of the bead was investigated as a function of angular range using the same method as described for the slanted wire measurements. The ASF was also investigated as a function of angular separation between subsequent views, which ranged from less than 1 degree up to greater than 3 degrees. This was accomplished by selecting every second or up to fourth view of the acquired images, so that the angular separation increases while the angular range remains the same.
RESULTS AND DISCUSSION
Measured PSF using slanted tungsten wire and comparison with model
2D PSF in x-z plane
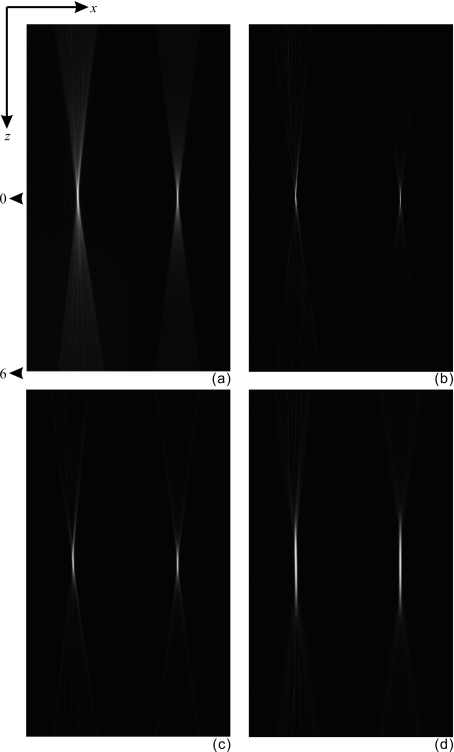
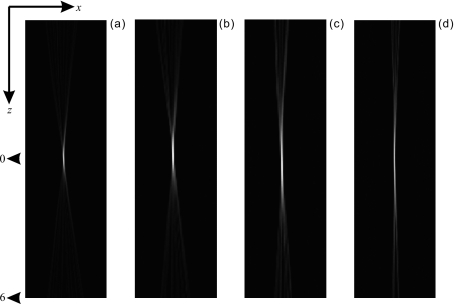
An example of the in-plane (x-y) image of a slanted wire is shown in Fig. 5, from which the 2D PSF for the x-z plane was derived using Eq. 7. Shown in Fig. 7 are the comparisons between measured and modeled PSF (in the x-z plane) for all four filter schemes. The measured and modeled results have excellent agreement in shape. Figure 7 shows that the intensity of the artifact using SBP (scheme 1) is the highest. Application of the RA filter (scheme 2) decreases the artifact. The addition of the SA filter (scheme 3) smears the artifact in the x-direction and reduces its intensity. Implementation of the ST filter (scheme 4) in the z-direction elongates the depth of focus, and makes the artifact more uniform.
Figure 7.
Comparison between measured (left) and modeled (right) 2D PSF in the x-z plane. The graphs (a)–(d) correspond to filter schemes 1–4 listed in Table 1. The PSF in each graph is plotted from −4.85 to 4.85 mm along the x-direction, and −6 to 6 mm in the z-direction.
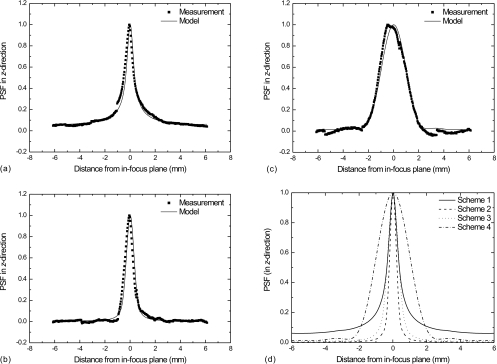
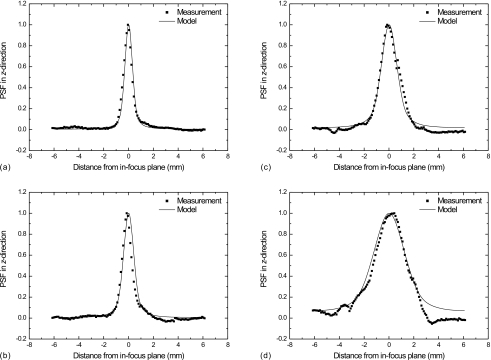
To facilitate quantitative comparison between modeled and measured results, the central vertical lines of the PSF (i.e., x=0) are plotted in Figs. 8a, 8b, 8c for filter schemes 1, 3, and 4. Excellent agreement between model and measurement is observed for all cases. The modeled PSF results for all four filter schemes are plotted in Fig. 8d to demonstrate the effect of the reconstruction filters. It shows that the PSF with SBP drops reasonably quickly within 2 mm on either side, but then decreases very slowly as a function of distance. The PSF is still >5% at 6 mm from the in-focus plane. The PSF for filter schemes 2 and 3 are similar, which drop rapidly to negligible values at 2 mm from the in-focus plane. This is due to the application of an RA filter during reconstruction. With scheme 4, the ST filter elongates the depth of focus and makes the PSF wider. However the values become negligible beyond 2 mm.
Figure 8.
The comparison between measured and modeled 1D PSF in z-direction (with x=0). The graphs (a), (b), and (c) correspond to filter schemes 1, 3, and 4, respectively. Plot (d) is a comparison between the modeled 1D PSF in the z-direction for each filter scheme.
It should be noted that the object spectrum of the 70 μm W wire was not removed from the measured PSF and MTF. This is because, with the additional frequency limiting filters applied in the DBT reconstruction process, i.e., SA, ST, and IN filters, the effect of wire diameter is negligible. For example, the frequency response of HIN is 0.41 at fx−NY=5.88 cycles∕mm, whereas the signal spectrum of the wire is 0.81 at the same frequency.
Angular range dependence
Figure 9 shows the measured presampling PSF with angular ranges of ±20, ±15, ±10, and ±5 degrees. The results shown were reconstructed using filter scheme 3. Figure 9 shows that a decrease in the angular span increases the intensity of the PSF. The angular span of the 2D PSF corresponds well with the angular span of acquisition, i.e., narrower with decreasing angular range.
Figure 9.
Comparison between the measured presampling PSF for the angular range of (from left to right): ±20, ±15, ±10, and ±5 degrees. The image reconstruction was performed using filter scheme 3.
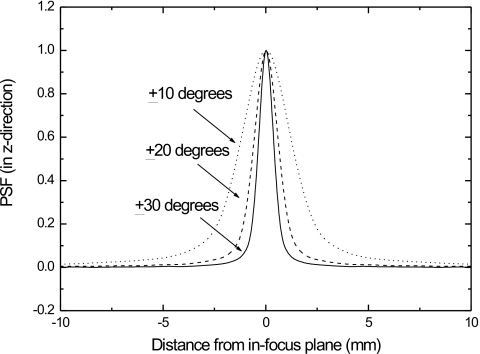
The central vertical lines of the 2D PSF in Fig. 9 (with x=0) are plotted in Fig. 10 in comparison with the modeled results using filter scheme 3. Decreasing the angular range of acquisition degrades the resolution in the z-direction, resulting in more pronounced smearing of the in-plane feature along the depth of the reconstructed volume. Excellent agreement between model and measurements is observed for all angular ranges. To facilitate the comparison between different angular ranges, the modeled results for the angular range of ±10 and ±20 degrees are plotted in the same graph in Fig. 11. Also shown is in Fig. 11 is the prediction of PSF if the angular range increases to ±30 degrees, which is the largest angular range reported in existing DBT prototype systems.18
Figure 10.
The comparison between measured and modeled 1D PSF in the z-direction (x=0) with the angular range of (a) ±20 degrees; (b) ±15 degrees; (c) ±10 degrees; and (d) ±5 degrees. Filter scheme 3 was used in all cases.
Figure 11.
Comparison of modeled 1D PSF in the z-direction (x=0) for the angular ranges of ±10, ±20, and ±30 degrees. All results were modeled using filter scheme 3.
Artifact of small, high-contrast objects
Artifacts of the steel bead in reconstructed images
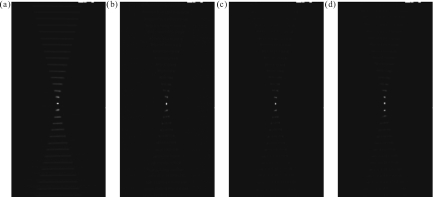
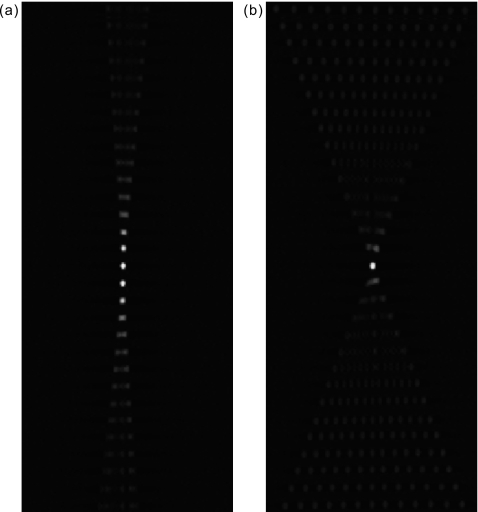
The reconstructed images of the 0.4 mm steel bead are shown in Fig. 12 in the form of stacked image slices with a small region of interest (ROI). An ROI that contains the entire image (or artifact) of the bead was selected from each image slice and arranged in a stack as a function of their distance from the location of the bead. Figure 12a shows that with SBP, the extent of the bead artifact in the tube travel direction reflects the path of tube travel during DBT acquisition, and the artifact is still visible 14 slices away from the object. Figures 12b, 12c, 12d demonstrate the artifact suppression with the application of reconstruction filters. The artifact with ST filter (scheme 4) is slightly higher than that for filter schemes 2 and 3 because of the increased depth of focus.
Figure 12.
Stacked image slices showing the artifact of the steel bead as a function of their distance from the location of the bead. A small ROI with 11 image lines was selected from each slice to include the entire image or artifact of the bead. Images (a)–(d) corresponded to reconstructions using filter schemes 1 to 4.
The effects of angular range and angular separation on the artifacts were investigated by reconstructing the images using subsets of the 49 views acquired over ±20 degrees. Using the central 13 views resulted in an angular range of ±5 degrees with the same (as the 49 views) angular separation of ∼0.8 degrees. Images with larger angular separation were obtained by selecting the central view and every fourth view on each side, resulting in 13 views with ∼3.2 degrees between subsequent views. Figure 13 shows the results of these two reconstructions with filter scheme 3. The same ROI as that used in Fig. 12 was selected for the stacked images showing the artifact. Figure 13 shows that the extent of the blurred artifact in the x-direction is proportional to the angular range. When the angular separation increases, as shown in Fig. 13b, individual streaks corresponding to each angular view are observed. At distances further away from the in-focus plane, the artifact appears as individual ghosts of the bead as opposed to a line. Quantitative comparison of the artifact was established through calculation of the ASF in the next section.
Figure 13.
The stacked images∕artifacts of the bead with reconstruction using: (a) a limited angular range of ±5 degrees; and (b) a wider angular separation of 3.2 degrees with angular range of ±20 degrees. Filter scheme 3 was used in all cases.
ASF measurements
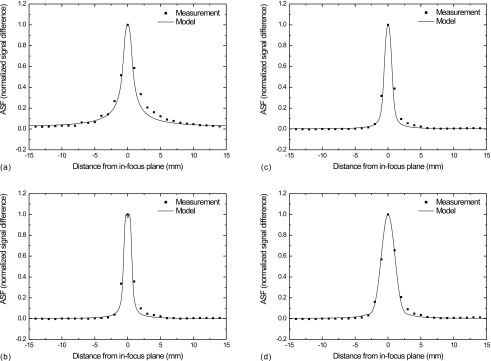
To calculate the ASF, the intensity of the in-focus and out-of-plane artifact of the bead, as shown in Fig. 12, was first integrated in the y-direction. ASF was then calculated using Eq. 14. The ASF for all four filter schemes is shown in Fig. 14. Plotted in the same graphs for comparison are the modeled ASF, which was obtained as the inverse Fourier transform of the multiplication of the modeled PSF and the object spectrum of a 0.4 mm diameter sphere given in Eq. 15. Figure 14 shows good agreement between the modeled and measured ASF of the steel bead for all filter schemes. This demonstrated the ability of the cascaded linear system model in prediction of the ASF for objects with known shape and size.
Figure 14.
Comparison between modeled and measured ASF: (a)–(d) correspond to filter schemes 1–4, respectively. The modeled ASF was calculated by multiplying the signal spectrum of a 0.4 mm diameter sphere with the presampling MTF of the DBT system, followed by an inverse Fourier transform. The vertical line with x=0 was normalized and plotted as the modeled ASF.
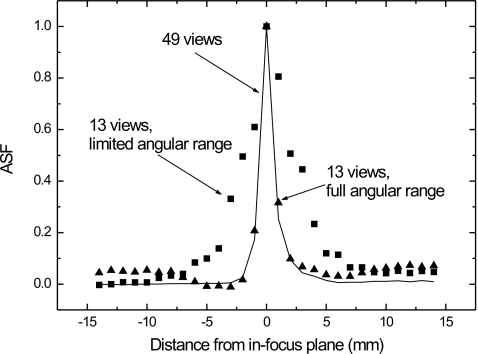
Figure 15 shows the comparison between ASF with different acquisition geometries. The results were obtained using filter scheme 3. It shows that ASF is wider with decreased angular range, which is consistent with the angular range dependence of the PSF shown earlier in Sec. 3A. Increasing the angular separation while maintaining the same angular range produced a similar ASF compared to the acquisition with 49 views. However, the ASF with larger angular separation exhibits an increase in ASF for slices further away (>5 mm) from the in-focus plane. This is because the sparse angular sampling resulted in individual ghosts of the bead in these slices instead of a blurred line, as shown in Fig. 11b. Therefore to minimize an artifact in DBT, it is not only important to maintain a reasonable angular range, e.g., >±15 degrees, but also to limit the angular separation to less than 2 degrees.
Figure 15.
Comparison of ASF with different acquisition geometries: 49 views over ±20 degrees (solid line); 13 views over ±5 degrees (squares); and 13 views over ±20 degrees (triangles).
In summary, our results revealed that a wider angular range can always reduce the artifact in DBT. SBP reconstruction results in the highest artifact intensity. An artifact can be reduced substantially by the application of ramp filter in all the FBP algorithms. The optimal choice of the filter combination in FBP will have to be determined with the consideration of noise in DBT systems, which can be reduced by the addition of SA and ST filters.
Limitations of the present study
The main focus of the present study is to relate the artifacts in DBT, as seen in the 2D cross-sectional plane (x-z), to the modeled system PSF. Since the cascaded linear system model assumes shift invariance, the modeled PSF is a representation of typical performance within the breast, e.g. 0–4 cm above the detector surface. In reality, the system PSF would vary from the center to the edge of the detector due to the cone-beam nature of the DBT geometry.26 Nevertheless, our modeled results showed good agreement with measurements. For extreme conditions that deviate from the main assumption of shift invariance, e.g., at the edge of the detector and >8 cm above the detector surface, the system can be treated as shift-invariant in small local regions. DBT parameters in the model can be modified to reflect the major changes in equivalent angular distribution of each view and magnification.
Our cascaded linear system model can only be used to predict DBT performance when linear reconstruction methods are used. These include SBP, FBP and its variations, matrix inversion, and various linear iterative reconstruction methods such as the simultaneous algebraic reconstruction technique (SART).
CONCLUSION
Out-of-plane artifacts due to limited angle acquisition in DBT were investigated using the 2D PSF in x-z plane measured with a slanted W wire. The results showed excellent agreement with PSF and MTF calculated using a cascaded linear system model previously developed for DBT. The ASF for small, high-contrast objects was measured using a 0.4 mm diameter steel bead. The measured ASF with RA, SA, and ST filters showed good correlation with the measured and modeled PSF. The ASF was also investigated as a function of angular range and angular separation. The results showed that an increase in angular range will reduce the intensity of the artifact significantly. Wider angular separation between subsequent views will result in higher ASF at slices further away (>5 mm) from the in-focus plane. Our results showed that the cascaded linear system model for DBT can be used not only to predict the in-plane image quality, but also the intensity of artifact in DBT.
ACKNOWLEDGMENTS
The authors gratefully acknowledge the financial support from NIH (1 R01 EB002655), the U.S. Army Breast Cancer Research Program (W81XWH-04-1-0554), and Siemens Healthcare. Also, we thank Dr. Thomas Mertelmeier and Dr. Jasmina Ludwig for helpful discussion and assistance.
References
- Laya M. B. et al. , “Effect of estrogen replacement therapy on the specificity and sensitivity of screening mammography,” J. Natl. Cancer Inst. 10.1093/jnci/88.10.643 88, 643–649 (1996). [DOI] [PubMed] [Google Scholar]
- Suryanarayanan S. et al. , “Evaluation of linear and nonlinear tomosynthetic reconstruction methods in digital mammography,” Acad. Radiol. 8, 219–224 (2001). [DOI] [PubMed] [Google Scholar]
- Suryanarayanan S. et al. , “Comparison of tomosynthesis methods used with digital mammography,” Acad. Radiol. 7, 1085–1097 (2000). [DOI] [PubMed] [Google Scholar]
- Wu T. et al. , “Tomographic mammography using a limited number of low-dose cone-beam projection images,” Med. Phys. 10.1118/1.1543934 30, 365–380 (2003). [DOI] [PubMed] [Google Scholar]
- Niklason L. T. et al. , “Digital tomosynthesis in breast imaging,” Radiology 205, 399–406 (1997). [DOI] [PubMed] [Google Scholar]
- Wu T. et al. , “A comparison of reconstruction algorithms for breast tomosynthesis,” Med. Phys. 10.1118/1.1786692 31, 2636–2647 (2004). [DOI] [PubMed] [Google Scholar]
- Kolitsi Z., Panayiotakis G., and Pallikarakis N., “A method for selective removal of out-of-plane structures in digital tomosynthesis,” Med. Phys. 10.1118/1.597060 20, 47–50 (1993). [DOI] [PubMed] [Google Scholar]
- Chakraborty D. P. et al. , “Self-masking subtraction tomosynthesis,” Radiology 150, 225–229 (1984). [DOI] [PubMed] [Google Scholar]
- Wu T., Moore R. H., and Kopans D. B., “Voting strategy for artifact reduction in digital breast tomosynthesis,” Med. Phys. 10.1118/1.2207127 33, 2461–2471 (2006). [DOI] [PubMed] [Google Scholar]
- Haaker P. et al. , “A new digital tomosynthesis method with less artifacts for angiography,” Med. Phys. 10.1118/1.595705 12, 431–436 (1985). [DOI] [PubMed] [Google Scholar]
- Roy D. N. G. et al. , “Selective plane removal in limited angle tomographic imaging,” Med. Phys. 10.1118/1.595791 12, 65–70 (1985). [DOI] [PubMed] [Google Scholar]
- Mertelmeier T. et al. , “Optimizing filtered backprojection reconstruction for a breast tomosynthesis prototype device,” Med. Imag. 2006: Phys. Med. Imag. 6142, 61420F–61412 (2006). [Google Scholar]
- Li B., Saunders R., and Uppaluri R., “Measurement of slice thickness and in-plane resolution on radiographic tomosynthesis system using modulation transfer function (MTF),” Med. Imag. 2006: Phys. Med. Imag. 6142, 61425D–61410 (2006). [Google Scholar]
- Li B. et al. , “Optimization of slice sensitivity profile for radiographic tomosynthesis,” Med. Phys. 10.1118/1.2742499 34, 2907–2916 (2007). [DOI] [PubMed] [Google Scholar]
- Deller T. et al. , “Effect of acquisition parameters on image quality in digital tomosynthesis,” Med. Imag. 2007: Phys. Med. Imag. 6510, 65101L (2007). [Google Scholar]
- Wu T.et al. , “Breast Tomosynthesis: Methods and Applications,” RSNA Categorical Course in Diagnostic Radiology: Advances in Breast Imaging - Physics, Technology and Clinical Applications, (2004), pp. 149–163.
- Zhou J., Zhao B., and Zhao W., “A computer simulation platform for the optimization of a breast tomosynthesis system,” Med. Phys. 10.1118/1.2558160 34, 1098–1109 (2007). [DOI] [PubMed] [Google Scholar]
- Zhang Y. et al. , “A comparative study of limited-angle cone-beam reconstruction methods for breast tomosynthesis,” Med. Phys. 10.1118/1.2237543 33, 3781–3795 (2006). [DOI] [PMC free article] [PubMed] [Google Scholar]
- Lauritsch G. and Haerer W. H., “Theoretical framework for filtered back projection in tomosynthesis,” Med. Imag. 1998: Image Process. 3338, 1127–1137 (1998). [Google Scholar]
- Zhao W. et al. , “Optimization of detector operation and imaging geometry for breast tomosynthesis,” Med. Imag. 2007: Phys. Med. Imag. 6510, 65101M–65112 (2007). [Google Scholar]
- Eberhard J. W. et al. , “High-speed large-angle mammography tomosynthesis system,” Med. Imag. 2006: Phys. Med. Imag. 6142, 61420C–61411 (2006). [Google Scholar]
- Zhao B. and Zhao W., “Three-dimensional linear system analysis for breast tomosynthesis,” Med. Phys. 10.1118/1.2996014 35, 5219–5232 (2008). [DOI] [PMC free article] [PubMed] [Google Scholar]
- Zhao W. and Rowlands J. A., “Digital radiology using active matrix readout of amorphous selenium: Theoretical analysis of detective quantum efficiency,” Med. Phys. 10.1118/1.598097 24, 1819–1833 (1997). [DOI] [PubMed] [Google Scholar]
- Kijewski M. F. and Judy A., “The noise power spectrum of CT images,” Phys. Med. Biol. 10.1088/0031-9155/32/5/003 32, 565 (1987). [DOI] [PubMed] [Google Scholar]
- Desponds L. et al. , “Image quality index (IQI) for screen-film mammography,” Phys. Med. Biol. 10.1088/0031-9155/36/1/003 36, 19 (1991). [DOI] [PubMed] [Google Scholar]
- Avinash G., Israni K., and Li B., “Characterization of point spread function in linear digital tomosynthesis: A simulation study,” Proc. SPIE 6142, 6142581–6142588 (2006). [Google Scholar]


