Abstract
Tracking lung tissues during the respiratory cycle has been a challenging task for diagnostic CT and CT-guided radiotherapy. We propose an intensity- and landmark-based image registration algorithm to perform image registration and warping of 3D pulmonary CT image data sets, based on consistency constraints and matching corresponding airway branchpoints. In this paper, we demonstrate the effectivenss and accuracy of this algorithm in tracking lung tissues by both animal and human data sets. In the animal study, the result showed a tracking accuracy of 1.9 mm between 50% functional residual capacity (FRC) and 85% total lung capacity (TLC) for 12 metal seeds implanted in the lungs of a breathing sheep under precise volume control using a pulmonary ventilator. Visual inspection of the human subject results revealed the algorithm’s potential not only in matching the global shapes, but also in registering the internal structures (e.g., oblique lobe fissures, pulmonary artery branches, etc.). These results suggest that our algorithm has significant potential for warping and tracking lung tissue deformation with applications in diagnostic CT, CT-guided radiotherapy treatment planning, and therapeutic effect evaluation.
Keywords: radiotherapy, image registration, pulmonary CT, consistency constraints
INTRODUCTION
Breatholding has been a common practice in diagnostic CT and CT-guided radiotherapy. This technique, however, becomes problemetic when the patent has difficulty to hold breath due to physiological or pathological conditions. For example, one study has shown volume changes more than 300 cm3 and displacements greater than 10 mm were detected in some patients who were under active breath control. The root cause was due to atelectasia and emphysema.1 Unfortunately, most of the patients only need diagnostic CT or CT-guided radiotherapy because of the presence of some kind of pulmonary disease.
To address this issue, approaches based on the principles of respiratory gating and 4D CT have been proposed.2, 3, 4, 5, 6, 7 With these approaches, patients are allowed to breathe freely during the exam, while CT images over multiple respiratory cycles are acquired. It is then possible to reconstruct CT images of the entire lung volume by registering CT images of various phases of a breathing cycle.
As one of the key enabling techniques, 3D nonrigid registration has been sought to track tissue deformation between various phases of the respiratory cycle; for instance, functional residual capacity (FRC) and total lung capacity (TLC). This is typically accomplished using high-dimensional image registration algorithms8, 9, 10, 11, 12, 13, 14, 15, 16, 17, 18, 19, 20, 21, 22, 23 that estimate a transformation mapping corresponding image voxels in the coordinate system of one CT scan to the coordinate system of another.
Among the numerous volumetric image registration approaches, many define the correspondences between images based on corresponding intensity patterns.8, 9, 10, 11, 12, 13, 14, 16 These approaches often minimize a gray-level intensity similarity measure between a transformed template image data set and a target image data set. However, the intensity similarity measure does not define a unique correspondence between two image data sets. Human lungs contain mostly a heterogeneous mixture of air, blood, and muscle. In pulmonary CT images, lung tissue and air are represented by the lower end of the CT gray-level range. In our experience, this produces a large number of registration ambiguities in the intensity-based algorithms (e.g., grayscale correlation and mutual information). In the absence of additional constraints, the intensity is often inadequate to reduce the correspondence ambiguity because of the large number of local minima of the similarity measure in medical images, such as 3D pulmonary CT images.21
Pulmonary-specific volume registration approaches have also been proposed. One approach uses a continuum mechanics model with manually selected airway and vascular tree landmarks for lung image registration.20 The continuum mechanics approach assumes that the lung is a mass-conserving medium. This assumption, however, is not accurate since the lung mass actually changes during the respiratory cycle as air and blood flow in and out of the lung. Boldea et al.23 have proposed another approach to estimate lung volume deformation for radiotherapy treatment. This approach is related to the optical flow model, which again assumes the lung is a mass-conserving medium. This assumption, as we pointed out earlier in this section, is inaccurate for pulmonary registration. Most recently, an attempt was given to use internal landmarks to register temporal lung volumes to track nodule interval growth.24 Three anatomical landmarks (sternum, trachea, and vertebra) were automatically detected in the CT images, and were used to perform a rigid body registration to align the two CT volumes. A variant of the iterative closest point (ICP) algorithm25, 26 was then adopted to match the lung surfaces. Finally, the surface transformation was applied to match nodules in the prior CT scan with the second scan. This method has resulted in a good result (56 of 58 nodules matched correctly). However, this approach suffered two problems: first, since both sternum and vertebra are outside the lungs, there is not adequate information to effectively match the structures inside the lungs. Second, the ICP algorithm can only guarantee a rough match at the not-very-smooth surfaces such as apex, mediastinal, and diaphram. In fact, the authors have observed obvious mismatches in the peripheral lung area. Neither the continuum mechanics approach, the optical flow approach, the ICP method, nor the surface matching methods uses an inverse consistency constraint21, 22 to reduce correspondence ambiguities that are likely to occur when registering one lung image to another.
We hypothesize that using additional constraints—such as minimizing the inverse consistency error of the forward and reverse transformations between the template and target images and matching corresponding landmarks27, 28—can help reduce the number of correspondence ambiguities.
The branchpoints of the airway tree provide ideal internal registration landmarks in the lungs. The first generation of airway, the main bronchus, is connected with nose and mouth. The main bronchus is then divided into the left and the right main bronchus, which form the second generations at the trachea. The left and right main bronchus furcated into the third generation after entering the lung surfaces. Airways terminate at respiratory bronchials with their associated alveolar buds around 16 branch generations. Modern CT scanners provide high enough resolution to detect these airways. For example, a 64-slice VCT with 0.625 mm in-plane resolution can detect airways up to eight branch generations. It is very possible to further improve CT scanners’ spatial resolution so that even more generations of airway branchpoints can be reliably detected.
The remainder of this paper is organized as follows. Sections 2, 3 describe the proposed algorithm in details, Section 5 gives the validation results, and Section 6 concludes with discussions on the results and practical considerations.
PREPROCESSING OF CT DATA SETS
The first step is preprocessing. This step prepares the image data sets and provides the internal landmarks for image registration, which will be discussed in more detail in Sec. 3.
The data preprocessing consists of three main steps: (1) segmentation of the lungs and airways, followed by airway thinning and branchpoint detection; (2) matching the airway branchpoints across all data sets; and (3) rigid registration of both image data sets using the the airway branchpoints as landmarks. These preprocessing steps are described in the following sections.
Lung segmentation
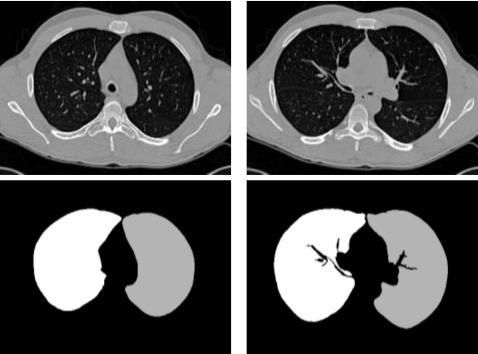
Processing starts by identifying the lungs within the CT data sets. For each of the images to be registered, we use the lung segmentation methods of Hu et al.29 to identify the 3D boundary of the lungs. The method in Ref. 29 uses optimal thresholding and region connectivity to identify the lungs, and dynamic programming to separate the left and right lungs. Ukil and Reinhardt30 improved the method in Ref. 29 by smoothing the lung boundary using information from the segmented human airway tree. We then use a model driven automatic method to segment the lobes.31 In this method, segmented lobe information from a normal subject is selected as the model and is used to limit the lobar fissure search regions after being registered with a nonmodel data set. A fuzzy rule-based graph search algorithm is then used to locate the lobar fissures on each 2D CT slice by minimizing a cost function. 3D connectivity is utilized to initialize the segmentation of fissures in nearby slices. Figure 1 shows two transverse image slices before and after lung segmentation and rigid alignment. After segmentation, the left lung is shown in gray, the right lung in white, and the nonlung regions are shown in black.
Figure 1.
(Top row) two transverse slices of the original gray-level CT images. (Bottom row) images obtained after segmentation. The right lung is in white and the left lung is in gray.
Airway segmentation
After lung and lobe segmentation, the airway tree is automatically identified using a method based on grayscale morphological reconstruction.32, 33 The airway tree skeleton is then automatically extracted from the segmented airway tree using a constrained 3D thinning algorithm.32 Finally, the airway branching points are extracted from the airway skeleton based on 3D connectivity. Figure 2 shows a segmented airway tree, skeleton, and branching points.
Figure 2.
Airway tree, centerlines, and branchpoints extracted from a 3D pulmonary CT image. Results are obtained using the procedure described in Ref. 32.
Matching the airway tree branching points
In order to take advantage of a priori knowledge of the lung structures, we need first to identify a set of feature points. We consider two criteria in selecting such feature points. First, they should represent distinguishable anatomical features that can be accurately identified and matched, and second, the points should be spatially distributed as uniformly as possible to provide adequate information throughout the lung volume. According to these criteria, airway branchpoints are ideal candidates for this purpose.
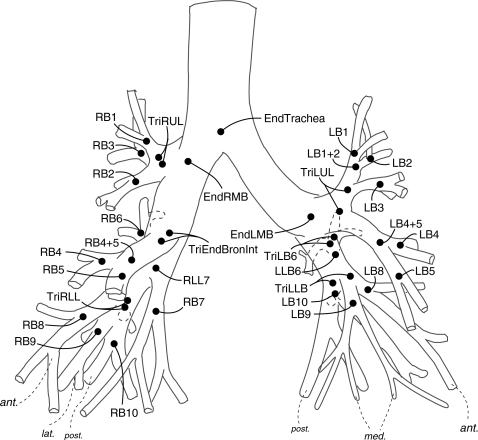
When two airway trees are compared, corresponding branchpoints can be mapped by using anatomic and topological information. We consider an anatomic airway tree model (Fig. 4) as our standard tree structure against which the segmented airway trees can be compared. In this study, the matching of airway trees is accomplished by an automatic method.32 This method is based on the association graph theory.34, 35 One disadvantage of the association graph method is its computational complexity.36 To overcome this problem, the hierarchical structure of an airway tree is first simplified by removing the minor branches that are shorter than a predefined length (3 mm). This algorithm has been tested and proved to be able to match the major airway branches up to the sixth generation.
Figure 4.
About 10–15 branching points per lung are identified and matched for each CT image.
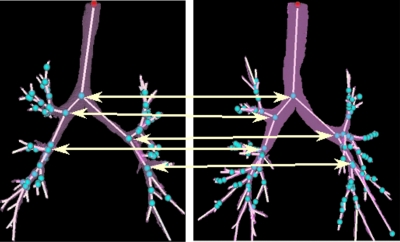
To ensure the validity of the automatic results, these results were also visually verified and corrected (if necessary) by a user. We have developed a customized visualization tool for this purpose so that two or more airway trees can be compared side by side. An example of such comparison is shown in Fig. 3.
Figure 3.
An example of matching branchpoints from two airway trees.
Ideally, a large collection of airway branching points can be selected for registration. However, due to partial volume effects, limited scanner resolution, and errors during skeletonization, only about 10 to 15 branching points per lung can be reliably matched using this approach. The locations of these points are illustrated in Fig. 4. These feature points can be used for volumetric warping if we can appropriately control the process of interpolation from the feature points to the entire volume.
Rigid alignment of the data sets
In order to accommodate the wide variation in patient position and orientation across the images under consideration, an Affine transformation is used to roughly align the lungs of the CT images. The branching structure of the airways provides a natural, in vivo coordinate system that can be used to initially align the data sets.
We select one image, called the template, as a reference image for subsequent processing. All of the remaining images are padded to have the same number of slices as the template image. Next, each image is divided into two subimages, where each subimage contains one of the lungs. For each subimage, we find a 3D rotation to best align the airway branching points in the subimage with the airway branching points in the corresponding lung in the template image. The landmarks used in this step are the ones identified and matched in Sec. 2. In this work, we use a matrix singular value decomposition to find the best least-squares match between branching points in the data sets. After applying the rotation to align the branching points across all data sets, we translate all of the images so that the carina is located at coordinates (x,y,z)=(256,256,180), which is at the approximate center of the image of the template image.
After the rotation and translation are applied, we pad all images to the size 512×512×608 by prepending and appending an equal number of additional image slices with the same intensity as the background. After padding, we downsample the images to the size 256×256×304 to strike a balance between the computation expense and image resolution. After downsampling, the carina in each image is located at (128, 128, 103), which is the approximate center of the downsampled image. The remainder of the image registration processing is applied on a lung-by-lung basis by processing each of the downsampled subimages separately.
CONSISTENT INTENSITY- AND LANDMARK-BASED IMAGE REGISTRATION
In this section, we describe our pair-wise image registration algorithm in more detail. For ease of description, we denote the two image data sets template and target. The template is usually the baseline image data set, such as the pretreatment CT scan for a radiotherapy procedure.
Inverse consistent registration problem statement
The consistent intensity- and landmark-based image registration algorithm described in Ref. 22 consists of an inverse consistent landmark registration step followed by an inverse consistent intensity registration step. The inverse consistent landmark and intensity registration steps are accomplished by minimizing the following two cost functions one after the other:
| (1) |
and
| (2) |
The forward transformation h is used to deform or warp the template image T into the shape of the target image S, and the reverse transformation g is used to deform the shape of S into that of T. The deformed template and target images are denoted by (T∘h) and (S∘g), respectively. The functions , are called displacement fields and are related to the forward and reverse transformations by the equations: h(x)=x+u(x), g(x)=x+w(x), , . The coordinates pi and qi, for i=1,2,…,M, define corresponding landmarks in the target image S and template image T, respectively.
The CSIM term of the cost function in Eq. 1 defines the symmetric intensity similarity. This term is designed to minimize the squared error intensity differences between the images. The CICC term is the inverse consistency constraint or inverse consistency error cost and is minimized when the forward and reverse transformations are inverses of each other. The CREG term is used to regularize the forward and reverse displacement fields. This term is used to force the displacement fields to be smooth and continuous.
Symmetric intensity similarity cost function
Because similarity cost functions usually have many local minima due to the complexity of the images being matched, it does not uniquely determine the correspondence between images. To partially address correspondence ambiguity, the transformations from the image T to S and from S to T are jointly estimated by defining a cost function to simultaneously measure the intensity differences between T∘h and S and between S∘g and T:
| (3) |
where x=(x1,x2,x3) defines an image voxel, T[h(x)] and S[g(x)] denote the deformed template and target images, respectively, and σ is a weighting coefficient.
Thin plate spline regularization cost function
The first term of Eq. 2 defines the thin plate spline regularization cost function given by
| (4) |
where ρ is a weighting coefficient. The operator L corresponds to a symmetric differential operator. In this paper, we used L=∇2=(∂2∕∂2x1,∂2∕∂2x2,∂2∕∂2x3) corresponding to a thin plate spline operator to regularize the displacement field u and w between the corresponding landmarks.
This cost function defines the bending energy of the thin-plate spline for the displacement fields u and w associated with the forward and reverse transformations, respectively. It should be noted that this term penalizes large derivatives of the displacement fields and interpolates a smooth displacement field between the landmarks. This is similar to the unidirectional landmark thin-plate spline (UL-TPS) interpolation27 but has the advantage of having inverse consistency.
Inverse consistency constraint
Minimizing the symmetric cost functions such as Eqs. 3, 4 are not sufficient to guarantee that h and g are inverses of each other. This can be achieved by minimizing the inverse consistency constraint given by
| (5) |
where χ is a weighting coefficient. Notice that cost is minimized when h=g−1 and g=h−1. Equation 5 is also referred to as the inverse consistency error cost, since it measures how much error there is between the forward transformation h and the inverse of the reverse transformation g−1 and vice versa.
Regularization constraint
In order to regularize the ill-posed problem of volumetric warping of the lung, a thin plate spline constraint of the form
| (6) |
is used in this study. This constraint helps to smooth the displacement field and prevent it from folding the image space. At each iteration, the Jacobian of the forward and reverse transformations are checked to make sure they remain positive for all voxels within the lung volume. A positive Jacobian implies that the transformations have not folded image space and, therefore, the topology of the template and target images are preserved during transformation. If the Jacobian becomes negative, the algorithm must be rerun with new parameters until a satisfactory registration is achieved.
ANIMAL STUDY
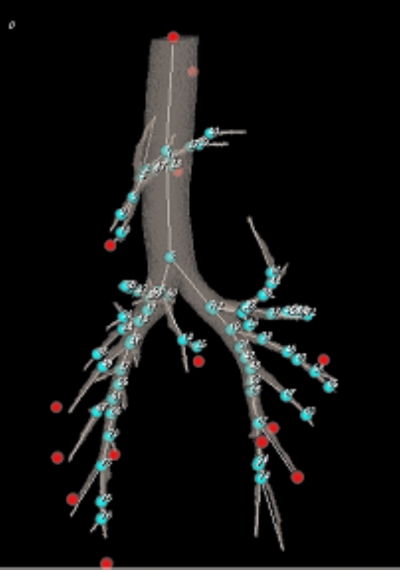
An animal study has been conducted to assess the effectiveness of the proposed method. The animal used in this experiment was a “healthy” adult sheep, which has been paralyzed and put under precise volume control by a pulmonary ventilator. To establish the “ground truth,” a bronchoscopist placed 13 zirconium seeds into this sheep’s lungs, both left and right, through airways using a catheter and a bronchoscope. Figure 5 shows the locations of the zirconium seeds, overlapped with the segmented airways.
Figure 5.
Thirteen zirconium seeds (spheres with no labels) were placed in a sheep’s lungs, both left and right. Shown also are the segmented airways and airway branchpoints (spheres with labels).
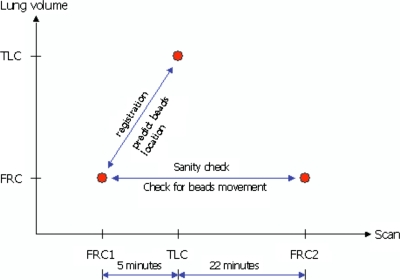
Three volumetric CT data sets (Fig. 6) were acquired during this experiment. The first CT scan was acquired at 50% FRC first. The second data set was collected at 85% TLC about 5 min later to form a registration pair. Towards the end of the experiment, another 50% FRC scan was performed to verify that seeds did not move during the experiments.
Figure 6.
Three volumetric CT data sets were acquired during this experiment. The first CT scan was acquired at FRC first. The second data set was collected at TLC about 5 min later to form a registration pair. Towards the end of the experiment, another FRC scan was performed for a sanity check of seeds movements during the experiment.
The first two data sets were used to verify the registration algorithm’s ability in predicting the seeds locations between the TLC and FRC during breath.
RESULTS
In this work, we attempted to balance computational expense and registration accuracy requirements by using a multiresolution approach, which has resulted in a significant reduction in execution time. Our approach consists of the following procedure: (1) the consistent intensity registration algorithm was applied to match the image surfaces using 1000 iterations per resolution for resolutions of 64×64×76 and 128×128×152; and then (2) the consistent landmark registration algorithm was used for 100 iterations to match the landmarks and to interpolate a smooth displacement field between the landmarks. Finally, (3) the transformation was applied to the 256×256×304 voxel data volumes to produce the final deformed images. The computation time to register two image volumes was approximately 1 hr and 40 min using an AMD Athlon 2.0+ GHz processor.
The results from the animal study are listed in Table 1. The result indicates that there was one metal seed that has shifted more than 5 mm during the course of the experiment. If excluding this seed, the average registration error was 1.9 mm after the registration. It is also noticeable that, on average, the 12 seeds have shifted about 1.7 mm between the two FRC scans.
Table 1.
The registration errors of implanted metal seeds (in mm). After excluding the seed that has moved significantly during the experiment, the average registration error was 1.9 mm after the registration. It is also noticeable that, on average, the 12 seeds have shifted about 1.7 mm between the two FRC scans.
| Seed number | Lung | Error after rigid alignment (mm) | Registration error (mm) | Movement | Note |
|---|---|---|---|---|---|
| 1 | R | 6.35 | 0.82 | 1.88 | |
| 2 | R | 4.56 | 1.25 | 1.01 | |
| 3 | R | 4.15 | 0.91 | 2.07 | |
| 4 | R | 8.67 | 1.67 | 2.43 | |
| 5 | L | 9.99 | 17.85 | Moved significantly | |
| 6 | L | 6.40 | 1.19 | 0.99 | |
| 7 | L | 8.07 | 3.10 | 1.11 | |
| 8 | R | 17.03 | 3.62 | 1.85 | |
| 9 | R | 10.35 | 2.42 | 1.88 | |
| 10 | R | 8.60 | 1.52 | 1.42 | |
| 11 | L | 6.92 | 0.58 | 1.31 | |
| 12 | R | 9.48 | 2.0 | 1.65 | |
| 13 | R | 9.44 | 3.72 | 1.97 | |
| Average* | 9.14 | 1.90 | 1.66 | *Excluding No. 5 | |
| Average | 8.47 | 2.91 | All |
The patient CT scans were gathered under a protocol approved by the University of Iowa IRB. The image data sets used in this work consist of five volumetric pulmonary CT images spanning the full apical-to-basal extent of the lung. Images were acquired using a multidetector row CT (MDCT) scanner (Philips MX8000—four rows). Each volume contained between 300 and 600 image slices with a slice thickness of 1.3 mm, a slice spacing of 0.6 mm, and a reconstruction matrix of 512×512 pixels. In-plane pixel size was approximately 0.625×0.625 mm2. A sophisticated gated programmable ventilator (Eric Hoffman et al., US Patent No. US5183038) was used in image acquisition to achieve the accurate lung volume control.
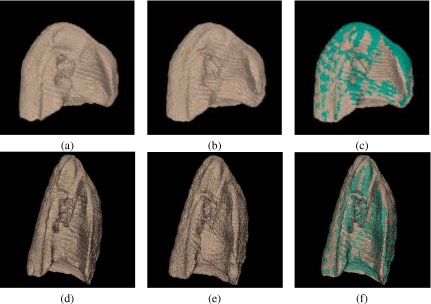
Figure 7 shows surface-rendered views of the right lung volumes that resulted from warping the template to one target to show the effectiveness of the registration method in warping the global shape of lung volumes. Notice the significant shape differences between the template and the target before registration and the good global registration of lung volumes after registration.
Figure 7.
Surface-rendered right lung volumes from a 3D registration experiment: (a) the template T, (b) the deformed target S∘g, (c) surface superposition of (a) and (b), (d) the target S, (e) the deformed template T∘h, and (f) surface superposition of (d) and (e).
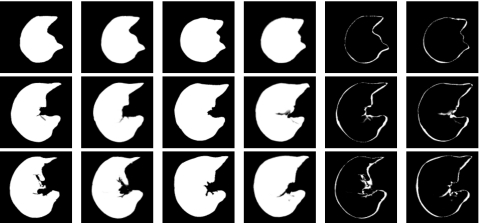
Figure 8 shows three transverse slices that resulted from transforming the template into the shape of a target image. If the registration were perfect, columns one and two would be identical and columns three and four would be identical. The last two columns of this figure show the difference images after the forward and reverse transformations.
Figure 8.
Transverse slices 88, 129, and 144 (top to bottom) from a 3D registration experiment. The columns from left to right correspond to the template T, the deformed target S∘g, the target S, the deformed template T∘h, difference between the template and deformed target, and difference between the target and deformed template. If the registration were perfect, columns one and two would be identical and columns three and four would be identical.
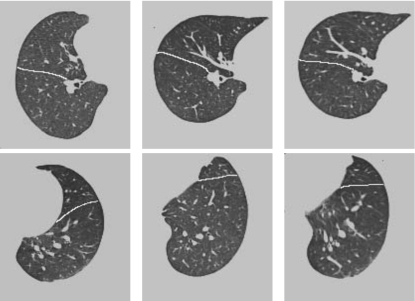
Figure 9 shows two gray-level transverse slices before and after registration. In addition to a good alignment of the global shapes, notice the good alignment between the oblique lobe fissures and between the artery branches after registration. This demonstrates the method’s ability to warp and register various structures within lung volumes.
Figure 9.
Slice 151 (top row, the right lung) and 184 (bottom row, the left lung) from a 3D registration experiment. The columns from left to right correspond to the template T, the target S, the deformed template T∘h. Notice a good alignment between the oblique lobar fissures (highlighted in white lines) and between the artery branches, in addition to a good alignment of global shapes after registration.
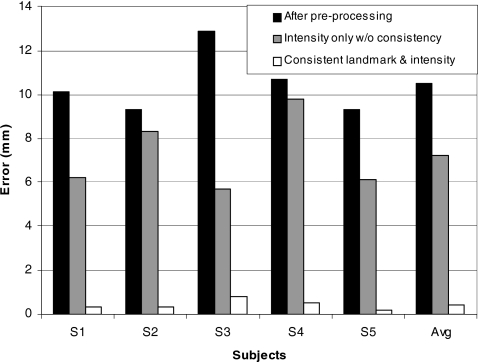
To quantitatively evaluate how well the internal structures are matched, we calculated the average landmark registration error as the Euclidean distances between corresponding landmarks after the preprocessing, using only intensity matching (without inverse consistency constraints), and using the proposed method. These results are shown in Fig. 10. Results show that the proposed method is able to reduce the average landmark registration error from 10.5 mm before registration to 0.4 mm.
Figure 10.
The average landmark registration errors as the Euclidean distances between corresponding landmarks after the preprocessing, using only intensity matching without inverse consistency constraints, or using the consistent landmark and intensity method. The right-hand column shows the average error computed across five subjects.
DISCUSSION AND CONCLUSIONS
In this paper, we have proposed a 3D intensity- and landmark-based image registration algorithm to perform image registration and warping of 3D pulmonary CT image data sets, based on consistency contraints and matching corresponding airway banchpoints. Visual inspection of the human subject results revealed the algorithm’s potential not only in matching the global shapes, but also in registering the internal structures (e.g., oblique lobe fissures, pulmonary artery branches, etc.). The animal study results showed a tracking accuracy of 1.9 mm for 12 metal seeds implanted in the lungs of a breathing sheep under precise volume control. These results suggest that our algorithm has significant potential for warping and tracking lung tissue deformation with applications in diagnostic CT, CT-guided radiotherapy treatment planning, and therapeutic effect evaluation.
Results show that the proposed method is able to reduce the average landmark registration error from 10.5 mm before registration to 0.4 mm. This demonstrates the proposed method’s potential to provide an accurate solution to the problem of tracking 3D internal lung structures over a respiratory cycle. The results have also demonstrated the importance of the landmark-based registration in match and warp the tracheobronchial tree and other internal structures that are associated with the tree because, without it, the average landmark registration error using intensity-based registration alone (without the consistent constraint) is significantly higher (7.6 mm) even after covergence.
Although the initial results are promising, further quantitative evaluation of patient data is necessary. Currently, we are considering one additional criterion for this purpose. This criterion is the relative volume overlap error and is defined as one minus volume the overlap fraction [the ratio of T∩(S∘g) to T∪(S∘g)]. If the registration is perfect, this error measure equals 0; while in the worst case of no overlap, this error equals 1. We expect that the relative volume overlap error using the proposed algorithm should be slightly higher than using only intensity matching (without inverse consistency constraints) because the proposed method registers not only the surfaces but also internal structures.
ACKNOWLEDGMENTS
This work was supported in part by HL64368 from the National Institutes of Health and by Grant No. 0092758 from the National Science Foundation.
References
- Sarrut D., Boldea V., Ayadi M., Badel J., Ginestet C., Clippe S., and Carrie C., “Nonrigid registration method to assess reproducibility of breath-holding with abc in lung cancer,” Int. J. Radiat. Oncol., Biol., Phys. 10.1016/j.ijrobp.2004.08.007 61(2), 594–607 (2005). [DOI] [PubMed] [Google Scholar]
- Parker D., “Optimal short scan convolution reconstruction for fan-beam ct,” Med. Phys. 10.1118/1.595078 9(2), 254–257 (1982). [DOI] [PubMed] [Google Scholar]
- Keall P., Kini V., Vedam S., and Mohan R., “Potential radiotherapy improvements with respiratory gating,” Australas. Phys. Eng. Sci. Med. 25(1), 1–6 (2002). [DOI] [PubMed] [Google Scholar]
- Ford E., Mageras G., Yorke E., and Ling C., “Respiration-correlated spiral ct: A method of measuring respiratory-induced anatomic motion for radiation treatment planning,” Med. Phys. 10.1118/1.1531177 30(1), 88–97 (2003). [DOI] [PubMed] [Google Scholar]
- Vedam S., Keall P., Kini V., and Mohan R., “Acquiring a 4d ct data set using an external respiratory signal,” Phys. Med. Biol. 10.1088/0031-9155/48/1/304 48(1), 45–62 (2003). [DOI] [PubMed] [Google Scholar]
- Low D., Nystrom M., Kalinin E., Parikh P., Dempsey J., Bradley J., Mutic S., Wahab S., Islam T., Christensen G., Politte D., and Whiting B., “A method for the reconstruction of four-dimensional synchronized ct scans acquired during free breathing,” Med. Phys. 10.1118/1.1576230 30(9), 1254–1263 (2003). [DOI] [PubMed] [Google Scholar]
- Pan T., Lee T., Rietzel E., and Chen G., “4d-ct imaging of a volume influenced by respiratory motion on multi-slice ct,” Med. Phys. 10.1118/1.1639993 31(2), 333–340 (2004). [DOI] [PubMed] [Google Scholar]
- Bajcsy R. and Kovacic S., “Multiresolution elastic matching,” Comput. Vis. Graph. Image Process. 10.1016/S0734-189X(89)80014-3 46, 1–21 (1989). [DOI] [Google Scholar]
- Collins D., Peters T., and Evans A., “An automated 3D non-linear image deformation procedure for determination of gross morphometric variability in human brain,” Proc., SPIE Conf. Visual. in Biomed. Comp., 1994, Vol. 2359, pp. 180–190.
- Collins D., Neelin P., Peters T., and Evans A., “Automatic 3D intersubject registration on MR volumetric data in standardized Talairach space,” J. Comput. Assist. Tomogr. 10.1097/00004728-199403000-00005 18(2), 192–205 (1994). [DOI] [PubMed] [Google Scholar]
- Gee J., Barillot C., Briquer L., Haynor D., and Bajcsy R., “Matching structural images of the human brain using statistical and geometrical image features,” Proc. SPIE Conf. Medical Imaging, 1994, Vol. 2359, pp. 191–204.
- Ashburner J., Neelin P., Collins D., Evans A., and Friston K., “Incorporating prior knowledge into image registration,” Neuroimage 6(4), 344–352 (1997). [DOI] [PubMed] [Google Scholar]
- Christensen G. E., Rabbitt R., and Miller M. I., “3D brain mapping using a deformable neuroanatomy,” Phys. Med. Biol. 10.1088/0031-9155/39/3/022 39(6), 609–618 (1994). [DOI] [PubMed] [Google Scholar]
- Thompson P. M. and Toga A. W., “A surface-based technique for warping three-dimensional images of the brain,” IEEE Trans. Med. Imaging 10.1109/42.511745 15(4), 402–417 (1996). [DOI] [PubMed] [Google Scholar]
- Christensen G. E., Rabbitt R., and Miller M. I., “Deformable templates using large deformation kinematics,” IEEE Trans. Image Process. 10.1109/83.536892 5(10), 1435–1447 (1996). [DOI] [PubMed] [Google Scholar]
- Christensen G. E., Joshi S. C., and Miller M. I., “Volumetric transformation of brain anatomy,” IEEE Trans. Med. Imaging 10.1109/42.650882 16(6), 864–877 (1997). [DOI] [PubMed] [Google Scholar]
- Brett A., Hill A., and Taylor C., “A method of 3D surface correspondence for automated landmark generation,” 7th British Machine Vison Conference, 1997, pp. 709–718.
- Lorenz C. and Krahnstöver N., “3D statistical shape models for medical image segmentation,” Proc. 2nd Int’l Conf. 3D Digital Imaging and Medicine, 1999, pp. 414–423.
- Kelemen A., Szekely G., and Gerig Guido, “Elastic model-based segmentation of 3-D neuroradiological data sets,” IEEE Trans. Med. Imaging 10.1109/42.811260 18(10), 828–839 (1999). [DOI] [PubMed] [Google Scholar]
- Fan L. and Chen C., “3D warping and registration from lung images,” Proc. SPIE Conf. Medical Imaging, 1999, Vol. 3660, pp. 459–470.
- Christensen G. E. and Johnson H. J., “Consistent image registration,” IEEE Trans. Med. Imaging 10.1109/42.932742 20(7), 568–582 (2001). [DOI] [PubMed] [Google Scholar]
- Johnson H. J. and Christensen G. E., “Consistent landmark and intensity-based image registration,” IEEE Trans. Med. Imaging 10.1109/TMI.2002.1009381 21(5), 450–461 (2002). [DOI] [PubMed] [Google Scholar]
- Boldea V., Surrat D., and Clippe S., “Lung deformation estimation with non-rigid registration for radiotherapy treatment,” Med. Imag. Computing and Computer-Assisted Intervention 2489, 221–232 (2002). [Google Scholar]
- Betke M., Hong H., Thomas D., Prince C., and Ko J., “Landmark detection in the chest and registration of lung surfaces with an application to nodule registration,” Med. Image Anal. 7, 265–281 (2003). [DOI] [PubMed] [Google Scholar]
- Besl P. and McKay N., “A method for registration of 3-D shapes,” IEEE Trans. Pattern Anal. Mach. Intell. 10.1109/34.121791 14, 239–256 (1992). [DOI] [Google Scholar]
- Rangarajan A., Chui H., Mjolsness E., Pappu S., Davachi L., Goldman-pakic P., and Duncan J., “A robust point matching algorithm for autoradiography alignment,” Med. Image Anal. 4, 379–398 (1997). [DOI] [PubMed] [Google Scholar]
- Bookstein F. L., “Principal warps: Thin-plate splines and the decomposition of deformations,” IEEE Trans. Pattern Anal. Mach. Intell. 10.1109/34.24792 11(6), 567–585 (1989). [DOI] [Google Scholar]
- Davis M., Khotanzad A., Flamig D., and Harms S., “A physics-based coordinate transformation for 3-D image matching,” IEEE Trans. Med. Imaging 10.1109/42.585766 16(3), 317–328 (1997). [DOI] [PubMed] [Google Scholar]
- Hu S., Reinhardt J. M., and Hoffman E. A., “Automatic lung segmentation for accurate quantitation of volumetric X-ray CT images,” IEEE Trans. Med. Imaging 10.1109/42.929615 20(6), 490–498 (2001). [DOI] [PubMed] [Google Scholar]
- Ukil S. and Reinhardt J. M., “Smoothing lung segmentation surfaces in 3D X-ray CT images using anatomic guidance,” Proc. SPIE Conf. Medical Imaging, 2004, Vol. 5370, pp. 1066–1075.
- Zhang L., Hoffman E. A., and Reinhardt J. M., “Atlas-driven lung lobe segmentation in volumetric X-ray CT images,” IEEE Trans. Med. Imaging 10.1109/TMI.2005.859209 25(1), 1–16 (2006). [DOI] [PubMed] [Google Scholar]
- Tschirren J., Palagyi K., Reinhardt J. M., Hoffman E. A., and Sonka M., “Segmentation, skeletonization, and branchpont matching—A fully automated quantitative evaluation of human intrathoracic airway trees,” in Lecture Notes in Computer Science, Dohi T. and Kikinis R., eds., Vol. 2489 (Springer-Verlag, Uttrecht, 2002), pp. 12–19. [Google Scholar]
- Aykac D., Hoffman E. A., McLennan G., and Reinhardt J. M., “Segmentation and analysis of the human airway tree from three-dimensional X-ray CT images,” IEEE Trans. Med. Imaging 10.1109/TMI.2003.815905 22(8), 940–950 (2003). [DOI] [PubMed] [Google Scholar]
- Ambler A., Barrow H., Brown C., Burstall R., and Popplestone R., “A versatile computer-controlled assembly system,” Proc. Int. Joint Conf. Artif. Intel., 1973, pp. 298–307.
- Park Y., “Registration of linear structures in 3D medical images,” Ph.D. thesis, Department of Informatics and Mathematical Science, Osaka University, Osaka, Japan, 2002. [Google Scholar]
- Cormen T., Leiserson C., and Rivest R., eds., Introduction to Algorithms (MIT Press, Cambridge, MA, 1990). [Google Scholar]


