Abstract
Rapid progression of joint destruction is an indication of poor prognosis in patients with rheumatoid arthritis. Computed tomography (CT) has the potential to serve as a gold standard for joint imaging since it provides high resolution three-dimensional (3D) images of bone structure. The authors have developed a method to quantify erosion volume changes on wrist CT scans. In this article they present a description and validation of the methodology using multiple scans of a hand phantom and five human subjects. An anthropomorphic hand phantom was imaged with a clinical CT scanner at three different orientations separated by a 30-deg angle. A reader used the semiautomated software tool to segment the individual carpal bones of each CT scan. Reproducibility was measured as the root-mean-square standard deviation (RMMSD) and coefficient of variation (CoV) between multiple measurements of the carpal volumes. Longitudinal erosion progression was studied by inserting simulated erosions in a paired second scan. The change in simulated erosion size was calculated by performing 3D image registration and measuring the volume difference between scans in a region adjacent to the simulated erosion. The RMSSD for the total carpal volumes was 21.0 mm3 (CoV=1.3%) for the phantom, and 44.1 mm3 (CoV=3.0%) for the in vivo subjects. Using 3D registration and local volume difference calculations, the RMMSD was 1.0−3.0 mm3. The reader time was approximately 5 min per carpal bone. There was excellent agreement between the measured and simulated erosion volumes. The effect of a poorly measured volume for a single erosion is mitigated by the large number of subjects that would comprise a clinical study and that there will be many erosions measured per patient. CT promises to be a quantifiable tool to measure erosion volumes and may serve as a gold standard that can be used in the validation of other modalities such as magnetic resonance imaging.
INTRODUCTION
Rheumatoid arthritis (RA) is a chronic, inflammatory disease1 with a large social and economic impact.2 In America, over 2 million people suffer from RA (Ref. 3) and the direct medical costs per RA patient are over $8000 per year, or over $16 billion total.4 This cost is expected to increase as the population ages and the number of affected individuals gets larger. RA causes pain, swelling, and joint destruction principally to the hands and feet, but all joints can be involved. Over time significant disability and early mortality develop.5 Joint replacement surgery is used to replace destroyed joints but the understanding of the inflammatory processes has led to the development of effective medical treatments such as disease-modifying antirheumatic drugs and biologic agents that specifically target key molecules in the inflammatory process and relieve arthritis symptoms. These therapies have the potential to slow or even reverse structural joint damage.6
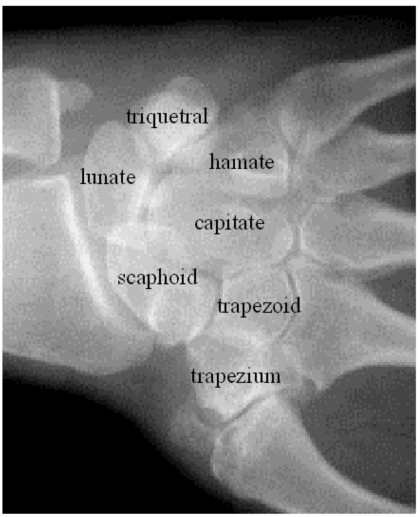
Two main structural changes due to RA are visible on a radiograph: narrowing of the adjacent bones in a joint and erosions, where the disease creates cavities in the bone. Hand radiography is widely used as an imaging modality to visualize erosions since it is fast, inexpensive, and widely available. However, radiography provides only a two-dimensional (2D) representation of the carpal bones, which are complex three-dimensional (3D) structures, and only the projected erosion area can be measured. As can be appreciated in Fig. 1, the wrist joints, in particular, have a great deal of overlapping structure that obscures erosions on projection images. Computed tomography (CT) scans of the wrist potentially allow for improved quantification of the erosion size since the volume can be measured directly. In this article we detail an image processing method to quantify the volume of RA erosions using a clinical CT system.
Figure 1.
Wrist radiograph demonstrating the projected overlapping bone structure. The figure also identifies seven of the eight carpal bones. The pisiform (not identified on the figure) is a small round-shaped bone obscured on the image by the triquetral.
Computer-aided diagnosis (CAD) in fields such as mammography and abdominal imaging often focuses on developing fully automated methods, which require no user interaction.7 The ultimate goal of such techniques is to serve as a surrogate for the judgment of the radiologist or other skilled reader. In practice these methods usually require the expertise of a highly trained physician to confirm the software diagnosis.
In general, the goals of software methods to assess structural changes from arthritis differ from conventional CAD in several important aspects. Arthritis imaging requires assessment rather than diagnosis; methods are required to measure changes over time rather than make a one-time diagnosis. For a single patient there often are numerous joints and bones that are assessed for structural changes. Since a composite score is generally formed by combining the individual measurements for each region or joint, inaccurate assessment of a single region can be considered part of the measurement error. This contrasts with CAD in cancer diagnosis where misclassification of a single lesion can have serious consequences. Finally, changes to the bone margins on either a radiograph or CT image are relatively simple to appreciate and can be assessed by a less skilled individual.
The goal of our methodology is to provide reproducible metrics that quantify the degree of change to the erosion volume. Since it is usually necessary to evaluate the entire patient population for clinical studies, a requirement of the methodology is to provide a measurement for all subjects in the study; no failures can be tolerated.
To address the issues raised above, a semiautomated method is a reasonable approach for carpal segmentation. A reader would be required to perform the segmentation but with integrated image processing routines to allow for faster and more objective bone margin detection. The goal is to provide a convenient and reproducible method that is capable of providing a measurement for every subject and visit in a longitudinal study. Once the individual carpals are segmented in 3D, the change in volume due to erosions from RA progression can be determined.
Our task is not unlike the need to segment soft tissue lesions or other structures on 3D medical images. A variety of semiautomated algorithms have been described and validated in the literature including the level-set8, 9, 10 and live wire11 approaches, which are often used to segment soft tissue structures. These methods can be powerful tools for computer-aided diagnosis as and potentially could also be applied to our task. We chose the specific approach for 3D segmentation of wrist carpals based on the somewhat unique anatomical nature of this region. The close presence of adjacent bones in the wrist is a major confounding factor particularly for diseased joints. However, the task is simplified by the relatively large contrast between cortical bone and the interbone regions. Our approach combines a robust edge-tracking step with an active contour algorithm that was optimized to be robust for these bones.
Previously published studies have investigated segmentation of the carpal bones on wrist CT scans with a variety of goals.12, 13, 14, 15, 16 Snel et al.13 and Sebastian et al.15 performed wrist segmentation to examine the kinematics of the carpal bones. Other studies have examined wrist scans as a validation of the general 3D segmentation methods.14, 16 Van Cleynenbreugel et al.12 describe a semiautomated method to segment bones on spiral CT scans. These techniques were developed to better understand carpal kinematics or as part of a more general 3D segmentation package; none focuses on examining changes due to erosion growth, which requires a high degree of precision in a local diseased region.
In this article we describe and validate a semiautomated software technique to segment the carpal bones on CT images and to measure changes in erosion volume longitudinally. There were three steps in the analysis procedure: segmentation of the individual carpal bones, 3D binary image registration, and calculation of local volume differences. The software was tested using two anthropomorphic hand phantoms that were imaged with a clinical CT scanner and the scans were segmented by two relatively unskilled readers. An in vivo validation study using five subjects was also performed. Performance of the software tool was evaluated by measuring the reproducibility of carpal volume measurements and the time necessary for the readers to perform the segmentation. We also performed a simulation study to quantify the accuracy of detecting erosion volume changes longitudinally.
MATERIALS AND METHODS
Controlling parameters
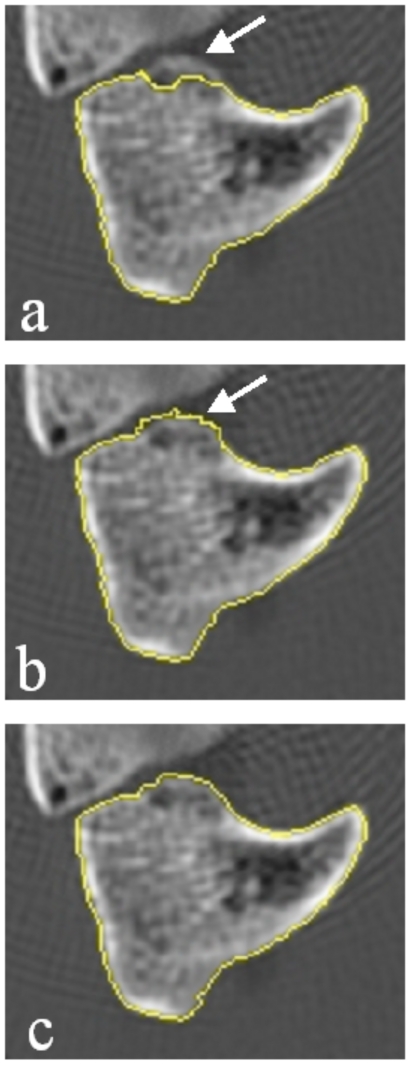
By definition, a “semiautomated” segmentation tool requires a user to guide the underlying low-level image processing algorithms. In skeletal images, bone margins are usually well defined and relatively easy to detect automatically if the software has prior knowledge of the neighborhood where the structures lie. Algorithm failures are generally significant deviations from the true margins, often caused by the presence of adjacent structures, such as adjoining carpal bones or internal trabeculae; such cases require reader interaction to guide the software to the correct approximately location. As a guiding principle our software is designed to minimize the degree to which the final segmented contours are a direct result of delineation by the reader. Through mouse clicks, the reader can guide the software to the general location of the proper bone margin before the software attempts a second automated segmentation using the reader-entered information as a constraint. We illustrate this principle in Fig. 2. In Fig. 2a the software produces an inaccurate result. In Fig. 2b the reader attempts to draw the bone margins in the correct location, and in Fig. 2c, an active contour model edge detection routine refines the manually entered margin. With this technique we maintain the objectivity and precision of the software segmentation while incorporating the common sense and expertise of a human reader.
Figure 2.
Segmented slice of a hamate bone that illustrates the hybrid reader-software edge detection technique. In (a) the edge tracking software has detected a bone margin within the true boundaries of the carpal. The arrow indicated the true bone margin. In (b) the reader manually edits the contour (indicated by arrow). In (c) the automated active contour routine refines the manual edits.
Isolation of individual carpals
The first step in the procedure was to isolate each individual carpal in a rectangular volume of interest. This was done manually with a graphical user interface (GUI) tool that displayed the CT images in the original axial as well as the reformatted sagittal and coronal planes. This typically required less than 3 min per hand and was factored into the reader time we quote in Sec. 3. Here we balanced the real-time reader interaction time versus the need for additional software development and concluded that it was not cost effective to invest effort in an automated carpal isolation step.
Segmentation procedure
Using the GUI tool to scroll through the images, the reader first identified a CT slice near the center of the carpal and placed a seed point adjacent to the bone surface [Fig. 3a]. The software then used an edge tracking routine to attempt a full segmentation of the carpal [Fig. 3b]. On a 2D image the tracking algorithm proceeded by examined adjacent pixels in the image and choosing the location with the maximum gray scale gradient that also satisfied the topological constraint of a clockwise or counterclockwise contour. This edge tracking algorithm is described in greater detail elsewhere.17 Where the edge tracking failed, the operator could guide the software [Fig. 3c]. In Fig. 3d the software has closed the contour and performed an active contour refinement step described below.
Figure 3.
Example of semiautomated segmentation for the first slice of a carpal. In (a) the reader entered a seed point and (b) initiated an edge tracking routine. In (c) the reader made a small edit to guide the edge tracking back to the correct bone margin. In (d) the software closed the contour and performed an active contour refinement step described below. (e) shows the subsequent slice with the segmentation from the previous slice overlaid. (f) is the final segmentation after the active contour step is applied.
Segmentation of subsequent slices
Once the first slice was successfully segmented, the reader instructed the software to proceed to the next adjacent slice. To increase objectivity and speed we implemented a technique that used the correctly segmented contour to guide an automated delineation of the subsequent slice. The correct contours from the previous slice served as an initial estimate of the new segmentation and further refinement of the contour was accomplished by multiple iterations of the active contour algorithm [Figs. 3e, 3f].
Active contour refinement
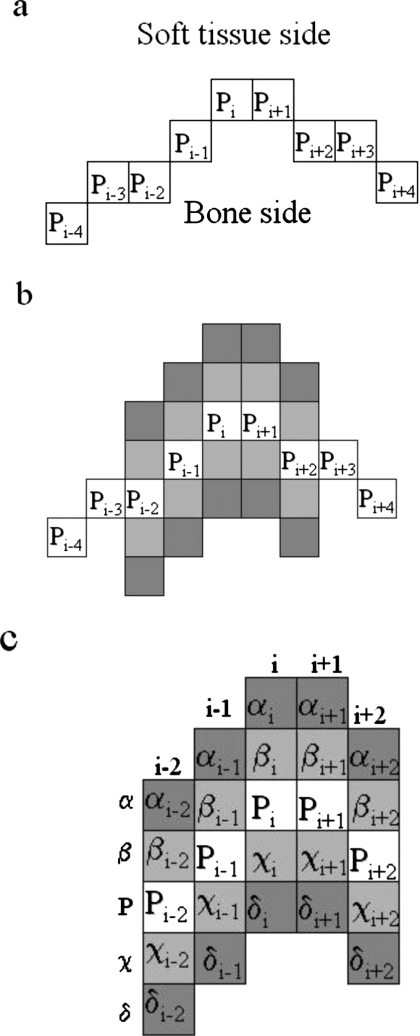
The edge tracking and any reader editing produced a segmentation that required additional refinement to better fit the bone margins. We implemented a simple active contour model that used a gray scale gradient-based cost function to optimize the fit. The cost function was calculated and applied on a pixel-by-pixel basis. The active contour routine is demonstrated in Fig. 4 and described below.
Figure 4.
Illustration of the active contour model algorithm.
For optimal implementation of the technique it was necessary to provide control over several parameters so that the reader could optimize the software for each specific case. Four parameters nmax, ψ, Niter, and fGS, described below, provided substantial algorithm control and could be varied by the reader through the GUI to achieve the best results. The software would then respond by displaying the consequence of the choice on a color-coded contour overlaid on the gray scale image.
Contour preprocessing
We define a contour as a series of pixels, Pi (i=1−N) located at {xi,yi} on a CT slice [Fig. 4a]. Each contour is a closed region of interest and consequently {x1,y1} is adjacent to or near {xN,yN}. Before each application of the active contour model algorithm, the software removed selected pixels from the contour according to the following rule. Starting at a location {xi,yi}, subsequent pixels {i+1,i+2,…} were eliminated from the contour until the distance between a pixel Pj and Pi was greater than two units. This procedure accomplished a degree of contour smoothing, and reduced the potential for “knots” to occur where the contour doubled back on itself creating a second closed loop of pixels.
Cost function
Figures 4b, 4c demonstrate how the cost function is calculated at a given pixel Pi. To improve edge detection, the method calculated gradients by performing an average over a number of pixels, n, adjacent to Pi. n was not fixed but was a function of the local curvature and was calculated according to the following rules:
where κ=2πr∕ψ. r is the radius of the circle defined by the points {xi−3,yi−3}, {xi,yi}, and {xi+3,yi+3}. In the example provided in Figs. 4b, 4c, n=2. ψ, and nmax were parameters that were controlled by the reader.
Gradients were calculated either in the horizontal or vertical directions depending on the relative positions of Pi−n and Pi+n. Three gradient values were calculated
where I denotes a calculation of the gray scale value at a point on the image [Fig. 4c]. The contour point Pi is relocated to the location of the maximum gradient: to χi if G1 is maximum, to Pi if G2 is maximum (does not move), or to βi if G3 is maximum. A single iteration consists of applying the procedure described above to each pixel in the contour. The software can be directed to perform a total Niter iterations for improved edge detection, where Niter is controlled by the user.
Gradient threshold refinement
A common segmentation artifact of the method is demonstrated in Fig. 5. In this example bone surfaces that are oblique to the axial plane cause an abrupt change in the margins from the adjacent slice and the automated segmentation fails. To remedy such cases, the reader could employ a simple gradient threshold refinement algorithm, which eliminated points on the delineated margin that did not fall on a sharp gradient. The software performed a single iteration of the active contour algorithm and calculates G2 at each point of the contour. The values were sorted and a fraction fGS of the points containing the lowest gradient values were discarded from the contour. fGS, a parameter controlled by the reader, typically ranged from 0.05 to 0.2.
Figure 5.
Example of gradient threshold refinement step on a scaphoid carpal. In (a) the carpal margins are sufficiently oblique that the adjacent segmentation fails to provide a useful starting point and the segmentation fails. In (b) the gradient threshold refinement step is applied. In (c) the standard active contour algorithm is employed to refine the contour and produce the final result.
Software validation
The software was validated using multiple scans from two anthropomorphic hand phantoms. Each phantom was scanned three times with an orientation of approximately −15°, 0°, and 15° with respect to the axial direction. A spiral CT protocol provided axial slices with a slice thickness of 0.625 mm and an in-plane isotropic pixel size of 0.195 mm. Scanning with different angles provided a way to test the methodology for repositioning reproducibility. The eight carpal bones of the wrist were segmented using the software described above by two different readers. Reader 1 (J.D.) was a Ph.D medical physicist and reader 2 (M.M.) was a summer intern preparing to enter medical school. Reader 2 segmented the wrist phantoms two times giving a total of 3(angles)×2(phantoms)×2(repeats)=12 segmentations.
In vivo validation
We also performed a validation study of the segmentation software by examining the repositioning reproducibility on five subjects participating in a clinical study of RA. The volumes of all eight carpals for a baseline and 6 month follow-up visits were measured and compared. For these subjects a spiral CT protocol provided axial slices with a slice thickness of 1.0 mm, and an in-plane isotropic pixel size of 0.195 mm.
Reproducibility and reader time
We performed two studies to validate the software. The first study provided a measurement of the reader reproducibility for determining the individual carpal volumes. Inter-reader reproducibility was quantified by calculating the root-mean-square standard deviation (RMSSD) of the carpal volumes between readers 1 and 2. Intrareader reproducibility was determined using the duplicate readings performed by reader 2. The readers also recorded the time to segment each carpal including the isolation step
Simulated erosions
The ultimate goal of this work is to quantify the progression of erosions in subjects with rheumatoid arthritis. An erosion typically occupies a small percentage of the total bone volume, therefore quantifying changes by comparing the total volumes of the baseline and follow-up scans was problematic. Small changes would likely be lost in the measurement noise.
To overcome this problem we used 3D image registration followed by an examination of baseline to follow-up volume differences in a local region where the change would be a larger fraction of the volume. For the purposes of this study we defined the θ=−15° as the “baseline” and the θ=0° or θ=+15° as the “follow-up” scans. Comparisons were made between the θ=−15° and θ=0° acquisitions (Δθ=15 deg) and between the θ=−15° and θ=+15° acquisitions (Δθ=30 deg). The study used six of the eight carpal bones: capitate, hamate, trapezoid, lunate, triquetral, and scaphoid.
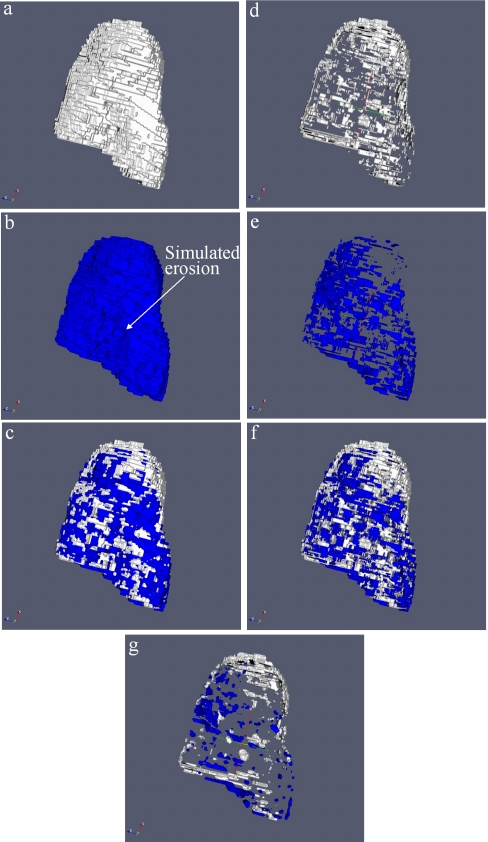
3D binary volumes, created using the segmented images of each carpal bone, were defined as Bbaseline and Bfollow-up [Figs. 6a, 6b]. To mimic the changes due to erosion growth, a simulated erosion was placed on Bfollow-up at a random location on the surface of the bone by removing all material within a radius of the erosion location [Fig. 6b]. The radius was a randomly generated number between 0.2 and 1.0 mm. A gold standard erosion volume VGS was defined as the volume of voxels removed from the follow-up image.
Figure 6.
Illustration of refinement procedure. (a) and (b) show the biniarized Bbaseline and Bfollow-up with the simulated erosion. In (c) the images are spatially registered. (d), (e), and (f) show Bloss (dark voxels), Bgain (light voxels) and both overlaid. In (g) the results of the binary erosion step is shown.
Binary volumes, Bbaseline and Bfollow-up, were then registered using a simple 3D image registration algorithm that minimized the fraction of nonoverlapping voxels [Fig. 6c]. Two additional 3D binary images were defined. Bloss was defined as the image continuing voxels that were filled in Bbaseline but not in Bfollow-up [Fig. 6d]. Bgain was defined as the image continuing voxels that were filled in Bfollow-up but not in Bbaseline [Fig. 6e]. Figure 6f shows Bgain and Bloss overlaid.
Registration algorithm
As an initial step the registration algorithm aligned the geometric centers of the binarized carpals, Bbaseline and Bfollow-up. A cost function was defined as the sum of the number of voxels in Bgain and Bloss and was investigated a function of three variables that determined the relative position, and the three Euler angles that described the relative angle between Bbaseline and Bfollow-up. The procedure determined the values for the six variables that minimized the cost function using standard minimization techniques.
Two additional refinement steps were employed before calculating the final erosion volume.
Binary eroding (definition of Nbin)
A true loss of erosion volume should occupy a large number of connected voxels, while the differences associated with the minor random variations of the segmentation procedure are more random. The goal of the next step was to reduce the amount of this “registration noise” while maintaining the changes associated with true erosion loss. Therefore, the method employed a binary erosion step to the difference images, Bgain and Bloss, designed to reduce the amount of misregistration while maintaining the majority of voxels associated with true bone loss.
A 3D binary eroding filter was applied to Bloss and Bgain. At each occupied voxel in Bloss and Bgain, Nadj was calculated as the number of occupied voxels from the 26 adjacent locations. Nbin was defined by the following rule: all voxels for which Nadj<Nbin were eliminated from the images [Fig. 6g]. It was our hypothesis that image locations, which were part of a large group of connected voxels (true erosion growth), would less likely to be eliminated by this step. One goal of the study was to test this hypothesis and determine the optimal value for Nbin using the segmented carpals and simulated erosions. Prior to analysis we chose Nbin=13 as the default value 13 since this constituted half the number of adjacent voxels.
Constraint to local region (definition of REr)
Calculation of the erosion volume using the full 3D volumes was prone to excessive misregistration noise. Therefore, the method constrained the volume difference calculation to a local region. REr was defined by the following rule: All voxels outside a radius of REr of the erosion location were eliminated before the final volume calculation. The default value for REr was 1.0 mm. We used a priori chosen default values for Nbin and REr but also investigated the effect on erosion volume precision of each variable as part of an optimization analysis.
Calculation of the “erosion” volume, VEr
Based on the assumption that erosion loss occurs over a relatively large (compared to the voxel size) but compact area, a final 3D region growing step was performed to identify the largest group of connected voxels. The final value of VEr was defined as the number of voxels in this group.
RESULTS
Table 1 gives the average inter- and intrareader reproducibility results for all eight carpal bones on both phantoms for the three orientations: −15°, 0°, and 15°. The reader time was less than 5 min per carpal or 40 min per wrist scan. The fourth row of Table 1 provides the in vivo RMSSD results.
Table 1.
Reproducibility results for comparison of total carpal volumes.
| RMSSD (mm3) | Mean volume (mm3) | CoV | |
|---|---|---|---|
| Intrareader | 14.3 | 1629.2 | 0.9 |
| Inter-reader | 22.8 | 1610.0 | 1.4 |
| Repositioning (phantom) | 21.0 | 1629.1 | 1.3 |
| Repositioning (in vivo, N=5) | 44.1 | 1485.3 | 3.0 |
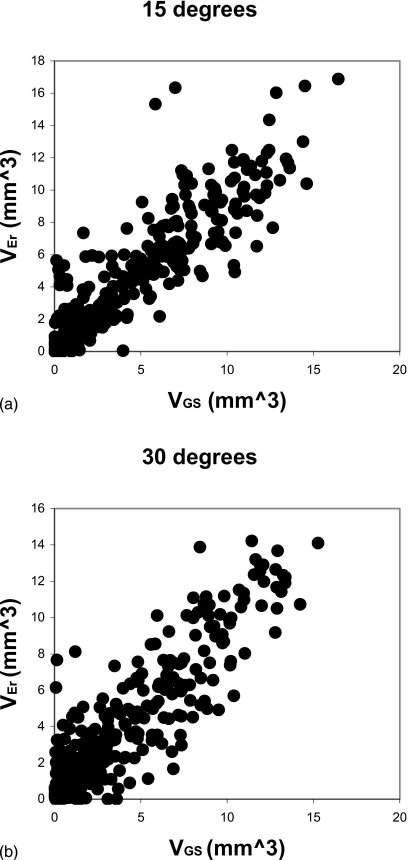
Although the RMSSD was a small percentage of the carpal volume, changes due to erosion growth would most likely be undetectable with this level or error. Therefore, we also investigated 3D registration and calculation of local volume difference to improve the sensitivity to small changes. The results are shown in Fig. 7, a graph of VEr versus VGS for the default values of Nbin=13 and REr=10 mm. The RMSSD values were 1.21 mm3 (Δθ=15°) and 1.18 mm3 (Δθ=30°), a considerable improvement over the total volume measure.
Figure 7.
(a) Graph of VEr vs VGS for Δθ=15 deg. VGS is the gold standard erosion volume that is known exactly from the algorithm that produced the simulated erosion in the follow-up erosion VEr is the erosion calculated by the method after 3D registration of Bbaseline and Bfollow-up. (b) Graph of VEr vs VGS for Δθ=30 deg.
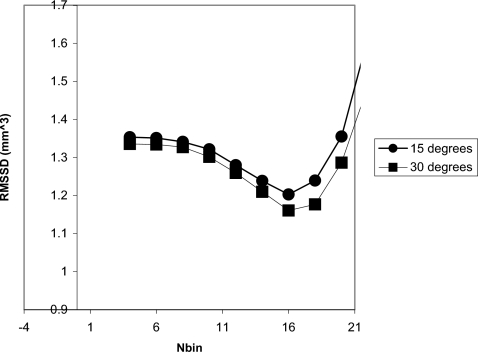
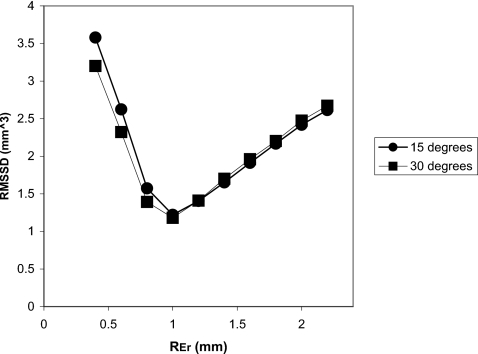
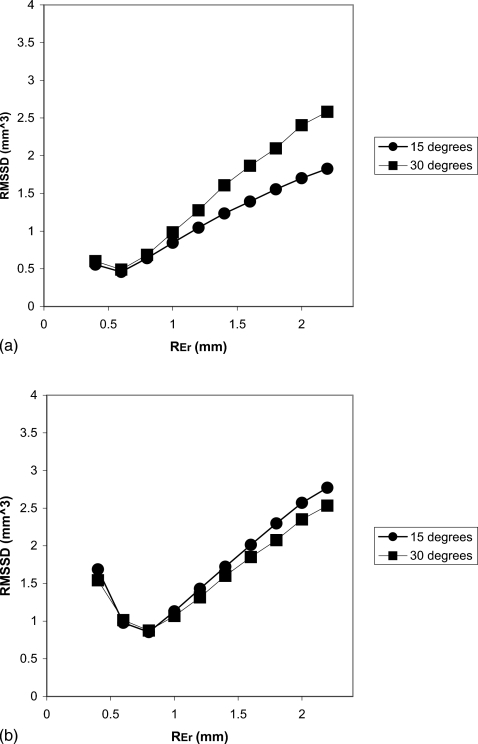
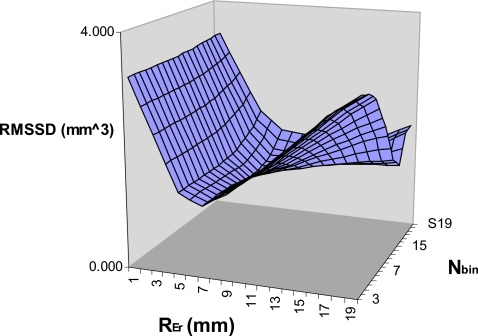
Finally, we performed an optimization study to investigate the dependence of the reproducibility on Nbin and REr. Figure 8, a plot of the RMSSD versus Nbin, demonstrates a local minimum at Nbin=16, indicating the optimal value for the binary eroding parameter. Figure 9 shows the dependence of the precision on REr. A local minimum defining the optimal value occurs at 1.0 mm, which also corresponds to the maximum radius of the simulated erosions. In practice the maximum size of the volume change will be unknown and misestimating the maximum possible change will have an effect on the precision. To better appreciate this effect we have also produced identical graphs for different maximum generated erosion radius values [Figs. 10a, 10b]. Figure 11 is a 3D surface plot of RMSSD (combining the 15° and 30° results) that demonstrates the dependence on Nbin and REr. An optimal value of RMSSD=1.12 mm3 is found at pREr=1.0 mm and Nbin=16.
Figure 8.
Graph of the RMSSD vs Nbin.
Figure 9.
Graph of the RMSSD vs REr (Nbin=13).
Figure 10.
(a) Graph of the RMSSD vs REr for erosions created with a radius less than 0.6 mm (Nbin=13). (b) Graph of the RMSSD vs REr for erosions created with a radius less than 0.8 mm (Nbin=13).
Figure 11.
3D surface plot of the RMSSD vs REr and Nbin.
DISCUSSION
Measurements of erosion progression in patients with RA have generally relied upon semiquantitative scoring systems; no past studies of RA progression have quantified the true erosion size with either radiography or a 3D modality. Therefore, the amount of precision required for our method to be useful is difficult to estimate. We found that the repositioning reproducibility was 21 mm3 (Table 1). Although small as a percentage of the carpal volume, it is large compared to the amount of change that might occur over the relatively short duration of most clinical studies.
The in vivo repositioning reproducibility was larger than for the phantom measurements, however, the patients were imaged with an older protocol that used a 1.0 mm slice thickness as opposed to the 0.625 mm slice thickness that was used for the phantom. An examination in a local region adjacent to indexed erosions revealed no significant change in the erosion volume. This may potentially be due to the short time difference between the baseline and follow-up visits (6 months); study using subjects with a longer follow-up may reveal larger changes.
We chose to quantify erosion volume in a local region where the aggregate effects would not dominate. Local volume comparison was made possible by the rigid-body nature of the carpal bones, which facilitated 3D registration. However, the implication of this approach is that a trained individual is necessary to identify erosion locations on the scans so that the local region can be isolated. In practice this is relatively simple task for a trained reader and can be done quickly using a GUI tool. Using 3D registration and local volume comparison, we measured the RMSSD for the phantom to be on the order of 1−3 mm3, a significant improvement over the measured precision when comparing total volumes. There was only a minor difference between the Δθ=15° and Δθ=30° tests indicating that the method was robust to changes in patient positioning from baseline to follow-up.
A reader time on the order of 1 h per wrist might be prohibitive for a method used for patient management, however, as one component of a clinical study, the cost is not excessive. Additionally the measurements can be made by a less skilled operator at a reduced expense compared to a trained physician. The reader component would likely be a small fraction of the total study cost when considering all the necessary expenditures. The need for a skilled individual to identify the erosions on the CT scans is likely to require a small amount of time compared to what is necessary for segmentation.
Outliers on Fig. 7 are primarily due to misregistration artifacts and generally occurred with simulated erosions that were located on carpal surfaces that are roughly parallel to the axial plane. Since clinical CT systems have nonisotropic voxel shapes, the 3D margins of erosions located on near axial surfaces are not well segmented. This effect may be mitigated by exclusively selecting erosions located on surfaces that are roughly perpendicular to the axial plane. Such a selection criterion would potentially reduce the number of true erosions detected, but may enhance the precision of the technique by eliminating the “noise” due to the outliers.
High resolution cone-beam CT systems are in development in different laboratories.18 These systems are fast and produce high spatial resolution images with near isotropic voxels, therefore 3D image registration of segmented carpals should be significantly more accurate. Additionally, new multislice clinical CT systems offer near isotropic voxel scans at a significantly higher resolution than the system we used for our study. Using an improved CT scanner it may be possible to detect change without indexing erosion locations, but by comparing global volumes.
Figures 910 indicate a significant dependence of the precision on the size of the local region constraint. Our default value of 1.0 mm3 was chosen with prior knowledge of the maximum simulated erosion size, however, in practice, it will be difficult to estimate the correct threshold radius REr. Examination of the figures suggests that it is preferable to overestimate REr since the magnitude of the slope is smaller to the right of the local minimum.
Figures 811 indicate optimal values for Nbin=16 and REr=1.0 mm. These results demonstrate that the default value (Nbin=13) was slightly lower than the optimal value. For future validation and clinical studies we will use Nbin=16, however, for the results given in this article we used Nbin=13 to not bias the results by optimizing and validating the methodology using the same data. There was not sufficient data to perform an independent optimization step before validation.
Whether this method is sufficiently precise to detect changes for each erosion has not yet been tested, however, even a method that cannot detect volume differences for individual erosion will be valuable in research studies. Most current clinical projects are designed to detect progression or nonprogression of joint damage in cohorts of patients. For each subject, our method evaluates 12 carpals each potentially containing multiple erosions. The large number of measurements will help mitigate the effect of lower accuracy. Additionally, the method could also be further developed to measure erosion volumes in the more distal and proximal joints of the hand. The carpometacarpal, proximal interphalangeal, and metacarpophalangeal joints, and distal radius and ulna are common sites of erosions as well.
This tool was developed to assist in a study of RA progression that used CT as well as magnetic resonance imaging (MRI).19 MRI has great potential as an imaging modality for RA since it causes inflammation of the soft tissue which is visible with MRI. However, MRI is not specific for erosions since inflammation can have other causes and MRI does not image the bone directly. An analysis of erosions based on the segmentation of CT scans will be a useful tool to confirm the presence of true erosions on MRI scans and lead to a better understanding of MRI assessment of RA.
In addition to carpal segmentation, there are other potential and actual applications of a semiautomated 3D segmentation technique. While a fully automated software analysis of radiological images is a worthwhile goal, it is rare that perfect segmentation is possible on all cases without some user interaction. Normal anatomical variation inevitably produces examples that a single algorithm cannot anticipate. The semiautomated approach we describe here could serve as a model for other applications that require accurate segmentation for all cases. It should also be possible to apply our method to other anatomical sites and modalities where a reader can be used to guide the segmentation procedure. As an example, we have modified the tool to segment cartilage on knee MRI scans.20
There are several limitations of the study. The carpal registration technique was tested using simulations on two hand phantoms rather than in vivo subjects with real erosions followed longitudinally. In addition to erosions, CT scans of RA patients are likely to have joint narrowing, which can further confound edge detection and decease the level of automation with our method. The likely consequence of applying the segmentation tool to RA patients’ scans is moderately increased reader interaction to correct software failures and leads to a longer user time per scan. For our registration study we used only six of the eight carpal bones; 3D registration of the pisiform and trapezium was not robust due to their symmetrical shape. The simulated erosion shapes were spherical unlike true erosions, which have an irregular shape. We assumed healthy bone as the baseline state while, in practice, studies are also likely to examine changes in diseased subjects who already demonstrate structural changes due to RA. Future studies with in vivo subjects are ongoing and will address these issues.
CONCLUSIONS
We have documented and validated a semiautomated software technique to segment carpal bones on CT scans to assess RA of the wrist. This method shows promise for application in clinical studies of the disease. Future work will involve testing with longitudinal CT scans and data and application to other anatomical sites and modalities such as MRI of the knee.
ACKNOWLEDGMENTS
This work was supported by the Intramural Research Program at NIH∕NIAMS. The authors would also like to thank Dr. Dean Inglis for his help in reviewing the manuscript.
References
- Callahan L. F. and Yelin E. H., in Primer on the Rheumatic Diseases, edited by Klippel J. H. (Arthritis Foundation, Atlanta, 2001), pp. 1–4. [Google Scholar]
- Goronzy J. J. and Weyand C. M., in Primer on the Rheumatic Diseases, edited by Klippel J. H. (William M. Otto, Atlanta, 1997), pp. 155–161. [Google Scholar]
- Lawrence R. C., Helmick C. G., Arnett F. C., Deyo R. A., Felson D. T., Giannini E. H., Heyse S. P., Hirsch R., Hochberg M. C., Hunder G. G., Liang M. H., Pillemer S. R., Steen V. D., and Wolfe F., “Estimates of the prevalence of arthritis and selected musculoskeletal disorders in the United States,” Arthritis Rheum. 41, 778–799 (1998). [DOI] [PubMed] [Google Scholar]
- Yelin E. and Wanke L. A., “An assessment of the annual and long-term direct costs of rheumatoid arthritis: The impact of poor function and functional decline,” Arthritis Rheum. 42, 1209–1218 (1999). [DOI] [PubMed] [Google Scholar]
- Pincus T. and Callahan L. F., “Early mortality in RA predicted by poor clinical status,” Bull. Rheum. Dis. 41, 1–4 (1992). [PubMed] [Google Scholar]
- Matteson E. L., in Primer on the Rheumatic Diseases, edited by Klippel J. H. (Arthritis Foundation, Atlanta, 2001), pp. 225–232. [Google Scholar]
- Vyborny C. J., Giger M. L., and Nishikawa R. M., “Computer-aided detection and diagnosis of breast cancer,” Radiol. Clin. North Am. 38, 725–740 (2000). [DOI] [PubMed] [Google Scholar]
- Cates J. E., Lefohn A. E., and Whitaker R. T., “GIST: An interactive, GPU-based level set segmentation tool for 3D medical images,” Med. Image Anal. 10.1016/j.media.2004.06.022 8, 217–231 (2004). [DOI] [PubMed] [Google Scholar]
- Droske M., Meyer B., Rumpf M., and Schaller C., “An adaptive level set method for interactive segmentation of intracranial tumors,” Neurol. Res. 27, 363–370 (2005). [DOI] [PubMed] [Google Scholar]
- Street E., Hadjiiski L., Sahiner B., Gujar S., Ibrahim M., Mukherji S. K., and Chan H. P., “Automated volume analysis of head and neck lesions on CT scans using 3D level set segmentation,” Med. Phys. 10.1118/1.2794174 34, 4399–4408 (2007). [DOI] [PMC free article] [PubMed] [Google Scholar]
- Mortensen E. N., Morse B. S., Barrett W. A., and Udupa J. K., “Boundary detection via dynamic programming,” Proc. SPIE 10.1117/12.131065 1808, 33–39 (1992). [DOI] [Google Scholar]
- Van Cleynenbreugel J., Kratka D., Berben L., Smet M. H., Marchal G., and Suetens P., “A semiautomatic three-dimensional segmentation method for disarticulation of bone structures on spiral computed tomography images,” J. Digit. Imaging 8, 156–161 (1995). [DOI] [PubMed] [Google Scholar]
- Snel J. G., Venema H. W., Moojen T. M., Ritt J. P., Grimbergen C. A., and den Heeten G. J., “Quantitative in vivo analysis of the kinematics of carpal bones from three-dimensional CT images using a deformable surface model and a three-dimensional matching technique,” Med. Phys. 10.1118/1.1289896 27, 2037–2047 (2000). [DOI] [PubMed] [Google Scholar]
- Snel J. G., Venema H. W., and Grimbergen C. A., “Deformable triangular surfaces using fast 1-D radial Lagrangian dynamics—segmentation of 3-D MR and CT images of the wrist,” IEEE Trans. Med. Imaging 10.1109/TMI.2002.803127 21, 888–903 (2002). [DOI] [PubMed] [Google Scholar]
- Sebastian T. B., Tek H., Crisco J. J., and Kimia B. B., “Segmentation of carpal bones from CT images using skeletally coupled deformable models,” Med. Image Anal. 7, 21–45 (2003). [DOI] [PubMed] [Google Scholar]
- Yao W., Abolmaesumi P., Greenspan M., and Ellis R. E., “An estimation∕correction algorithm for detecting bone edges in CT images,” IEEE Trans. Med. Imaging 10.1109/TMI.2005.850541 24, 997–1010 (2005). [DOI] [PubMed] [Google Scholar]
- Duryea J., Li J., Peterfy C. G., Gordon C., and Genant H. K., “Trainable rule-based algorithm for the measurement of joint space width in digital radiographic images of the knee,” Med. Phys. 10.1118/1.598897 27, 580–591 (2000). [DOI] [PubMed] [Google Scholar]
- Boone J. M., Kwan A. L. A. L., Nelson T. R., Shah N., Burkett G., Seibert J. A., and Lindfors K. K., “Performance assessment of a pendant-geometry CT scanner for breast cancer detection,” Proc. SPIE 10.1117/12.595706 5745, 319–323 (2005). [DOI] [Google Scholar]
- Goldbach-Mansky R., Mahadevan V., Yao L., and Lipsky P. E., “The evaluation of bone damage in rheumatoid arthritis with magnetic resonance imaging,” Clin. Exp. Rheumatol. 21, S50–S53 (2003). [PubMed] [Google Scholar]
- Duryea J., Neumann G., Brem M. H., Koh W., Noorbakhsh F., Jackson R. D., Yu J., Eaton C. B., and Lang P., “Novel fast semi-automated software to segment cartilage for knee MR acquisitions,” Osteoarthritis Cartilage 15, 487–492 (2007). [DOI] [PMC free article] [PubMed] [Google Scholar]


