Abstract
We have previously developed a fast Monte Carlo (MC)-based joint ordered-subset expectation maximization (JOSEM) iterative reconstruction algorithm, MC-JOSEM. A phantom study was performed to compare quantitative imaging performance of MC-JOSEM with that of a triple-energy-window approach (TEW) in which estimated scatter was also included additively within JOSEM, TEW-JOSEM. We acquired high-count projections of a 5.5 cm3 sphere of 111In at different locations in the water-filled torso phantom; high-count projections were then obtained with 111In only in the liver or only in the soft-tissue background compartment, so that we could generate synthetic projections for spheres surrounded by various activity distributions. MC scatter estimates used by MC-JOSEM were computed once after five iterations of TEW-JOSEM. Images of different combinations of liver∕background and sphere∕background activity concentration ratios were reconstructed by both TEW-JOSEM and MC-JOSEM for 40 iterations. For activity estimation in the sphere, MC-JOSEM always produced better relative bias and relative standard deviation than TEW-JOSEM for each sphere location, iteration number, and activity combination. The average relative bias of activity estimates in the sphere for MC-JOSEM after 40 iterations was −6.9%, versus −15.8% for TEW-JOSEM, while the average relative standard deviation of the sphere activity estimates was 16.1% for MC-JOSEM, versus 27.4% for TEW-JOSEM. Additionally, the average relative bias of activity concentration estimates in the liver and the background for MC-JOSEM after 40 iterations was −3.9%, versus −12.2% for TEW-JOSEM, while the average relative standard deviation of these estimates was 2.5% for MC-JOSEM, versus 3.4% for TEW-JOSEM. MC-JOSEM is a promising approach for quantitative activity estimation in 111In SPECT.
Keywords: iterative reconstruction, Monte Carlo simulation, OSEM, 111In SPECT, MC-JOSEM
INTRODUCTION
111In-labeled radiopharmaceuticals have been increasingly used as surrogates for bio-distribution studies of the same compounds labeled with 90Y for radionuclide therapy. Such studies often depend on obtaining quantitative estimates of the concentration of 111In in tumor(s) and in various organs. Unfortunately, however, single photon emission computed tomography (SPECT) images are degraded by statistical noise, photon attenuation, and scatter in the patient, collimator, and detector, as well as by the finite spatial resolution of the collimator and detector, which leads to the so-called “partial volume effect.” 111In images are comprised of primary photons detected at nearly the same energy as they had when they were emitted, as well as scattered photons either detected within the same photopeak energy window or “down scattered” to the lower energy window, e.g., 245 keV photons which scatter such that they lose sufficient energy to be detected ultimately in the 171 keV energy window. These characteristics of 111In imply that compensation for scatter and down scatter are likely to be particularly challenging for this radionuclide.
One energy-based approach that can be used to compensate for scatter and cross talk is the triple-energy window (TEW) method,1 in which the number of scattered photons in a photopeak window is estimated using a linear interpolation of the counts within two adjacent narrow subwindows. The TEW method is not only straightforward to implement and efficient, but it can also account for scatter arising from outside the axial field of view. Ichihara et al.2 showed that this method can be applied to several different radionuclides, and even used to correct for scatter and cross talk when imaging two simultaneously acquired radionuclides. Although the TEW approach can also compensate to some extent for scatter within the collimator, it cannot be used to correct for collimator penetration3 or for coherent scatter within the collimator; this is because the energy of penetrating and coherently scattered photons is unchanged, so any method based solely on energy spectral analysis cannot accommodate these effects. Finally, as also pointed out by Zaidi and Koral,3 the TEW method can lead to noisy estimates of scatter, since few counts are generally detected within narrow (usually 3–6 keV wide) scatter windows.
Published results on quantitative 111In SPECT are fairly limited. A quantitative 111In SPECT study using a simple physical phantom was described by Gilland et al.4 Also, 111In-labeled antibody activity in the livers of beagle dogs was quantified by Leichner et al.5 However, both of these studies relied on analytic reconstruction algorithms which included neither accurate modeling of the emission and detection processes nor stochastic modeling of the projection measurements. Recently, He et al.6 presented a study on quantitative 111In SPECT which made use of both Monte Carlo (MC) simulated data and experimental phantom data. In their approach, scatter compensation was performed by modeling the scatter contribution using the effective source-scatter estimation method,7 in which simulated patient-independent scatter kernels were used to estimate, for each projection view, an effective scatter source which was then attenuated and blurred during projection. The method used approximations to try to deal with nonuniform attenuators and multiple orders of scatter.
Although several approaches have been used to compensate for scatter and cross talk in SPECT imaging of various radionuclides, image quality has not been improved to the fullest possible extent—perhaps in part, because the corrections have often not been performed simultaneously, nor have they been fully integrated within the reconstruction. While the model-based method referenced above6 was shown to perform well, the algorithm depends on an assumption that the object is uniform in the region between the point where a given photon was emitted and the location of its last scatter point; in fact, the authors suggested that a violation of this assumption may have been responsible for some of the larger inaccuracies in organ activity estimates. This limitation of the model-based approach could be circumvented through the use of a MC simulation of all of the systematic physical effects that degrade SPECT projection images, in combination with an appropriate iterative reconstruction algorithm.
131I, another radionuclide used for treatment planning (and for therapy) is also characterized by high levels of down scatter into the principal photopeak energy window. Dewaraja et al.8 have reported on quantitative 131I SPECT, in which scatter estimates were determined using a standard Monte Carlo simulation, and compared with those obtained using the TEW method. These authors found that images reconstructed with Monte Carlo simulation were only slightly superior to those reconstructed with TEW, and that the degree of improvement may not justify the large computational requirement for their Monte Carlo simulation. Despite this conclusion, we believe it is, nevertheless, important to determine whether useful performance gains might be possible by using a Monte Carlo approach for reconstructing 111In SPECT images. It also could be useful to evaluate separately the accuracy and precision of image quantitation using MC-based and TEW-based corrections. Finally, variance reduction approaches can often be used to significantly reduce the computation times required for Monte Carlo-based image reconstruction.
A group at the Utrecht University Medical Center recently developed promising acceleration techniques based on the use of “scatter maps” and convolution forced detection.9, 10, 11 We have extended their research by developing a fast Monte Carlo (MC) simulation method which accurately models all of the physical factors involved in image formation. This algorithm was included within a joint ordered-subsets expectation maximization (JOSEM) approach, denoted MC-JOSEM, in order to compensate simultaneously for scatter and cross talk, as well as for collimator penetration and collimator and detector scatters. We recently applied MC-JOSEM to the case of Monte Carlo simulated 111In data,12 as well as to dual-radionuclide 99mTc∕123I data,13 finding in both cases that MC-JOSEM was superior to OSEM approaches utilizing energy-window-based scatter correction. Our MC-JOSEM software uses accelerated MC techniques to simulate scatter maps for many energy bins simultaneously, including intermediate-energy bins between the two photopeaks of 111In. It also makes use of precomputed point spread functions (PSFs) that included all collimator and detector effects. In our previous tests of this algorithm for 111In SPECT,12 we used only MC-simulated data and we compared the quantitative imaging performance of the MC-JOSEM method to that of a “general spectral” (GS) method which estimated the scatter in each projection pixel by using a linear combination of the pixel values in 18 10-keV-wide energy windows; these scatter estimates were then also used in a joint OSEM iterative procedure (GS-JOSEM). Because most manufacturers’ SPECT systems are not capable of simultaneously recording image data in 18 energy windows, and since list-mode acquisition capability is not widely available, we decided that it would also be important to compare the performance of MC-JOSEM to that of the more conventional TEW-based approach. Furthermore, because MC programs never perfectly simulate all of the systematic effects which may limit the performance of an actual SPECT system, we also decided to evaluate quantitative imaging performance using data from a physical phantom study. Therefore, for the work reported here, we have used the MC-JOSEM algorithm to reconstruct 111In SPECT projection data acquired from a torso phantom using a Siemens e.CAM SPECT system, and have compared the results to those of a TEW-based JOSEM approach, denoted TEW-JOSEM. The TEW-JOSEM algorithm is similar to the MC-JOSEM algorithm except that the scatter contributions, which are added during the forward-projection process in JOSEM, are estimated by TEW instead of by fast MC.
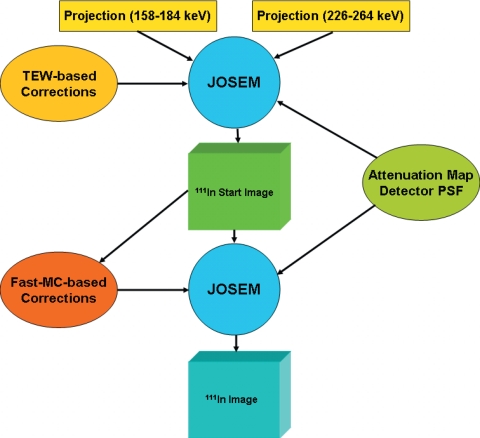
The TEW-JOSEM and MC-JOSEM algorithms we used for reconstructing 111In phantom data are both illustrated in Fig. 1. Two sets of photopeak projections were obtained in two energy windows, 158–184 keV and 226–264 keV; these were first used simultaneously to reconstruct images with TEW-JOSEM, while modeling the attenuation map and the collimator-detector PSF in both the projector and backprojector. Ichihara et al.2 utilized a 24% main photopeak window and 3 keV nonoverlapping scatter windows for TEW when imaging 201Tl, 123I, and 99mTc. For imaging 111In on an e.CAM SPECT system, we decided—based on visual inspection of energy spectra—to continue to use the 15% photopeak windows that are currently used for conventional clinical acquisitions of 111In in our department and in many others. We also decided to increase the width of the scatter windows recommended by Ichihara and colleagues, from 3 to 5 keV, in order to acquire more counts and thereby reduce noise somewhat in the scatter estimates. The TEW method’s scatter estimates were included in the forward projection for each iteration of JOSEM. The reconstructed image obtained after five iterations of TEW-JOSEM was then used by the fast MC as the starting image to obtain scatter and cross talk estimates. This was done in order to rapidly obtain a reasonably accurate starting image that already included some degree of compensation for attenuation and scatter. Finally, for MC-JOSEM, the JOSEM reconstruction was continued, but at each iteration, the same scatter and cross talk estimates obtained once from the fast MC algorithm were used repeatedly during each forward-projection process.
Figure 1.
Flow chart of TEW-JOSEM and MC-JOSM.
METHODS
Data acquisitions
For all phantom acquisitions, we used a dual-detector Siemens e.CAM system in the 180° detector configuration, equipped with medium-energy low-penetration collimators, to acquire the following four list-mode data sets:
-
1.
sphere-air
A 5.5 cm3 sphere of 111In (31.8 MBq) was placed near the center of rotation of the SPECT scanner, and a 15 min scan was acquired.
-
2.
sphere-liver, sphere-spine, sphere-lung
The same sphere was then attached, sequentially, to the liver, the spine, and the left lung compartments of a Data Spectrum torso phantom; for each sphere location, we acquired three half-hour scans. The liver and the background (soft-tissue) compartments were both filled with “cold” water (containing no activity) for each of these acquisitions.
-
3.
liver
We then injected 24.4 MBq of 111In into the liver compartment, and filled the background with “cold” water, before acquiring six half-hour scans with no sphere present.
-
4.
background
Finally, we injected 135.1 MBq of 111In into the background water compartment, and filled the liver with “cold” water, before acquiring 14 one-hour scans. Again, no sphere was present for these acquisitions.
The acquired data sets are summarized in Table 1. Because the projection data from all of the scans within each given data set were added together, the third column of this table only indicates the total acquisition time for each phantom condition. There was no activity in the spine or the lungs for any of the scans. We always used 60 views over 360° and acquired all data in list mode. The phantom was always placed at the same position on the scan table. By placing several marks on the phantom and on the table, we achieved a repositioning accuracy of ±1 mm. The table and gantry positions were also fixed for all scans. The distance from the center of rotation to each detector was fixed at 22.9 cm in order to obtain a circular orbit.
Table 1.
Data sets acquired. The total activity given for each data set is the amount put in the phantom when it was filled. The activity during each scan was slightly less due to radioactive decay. All scans were acquired in list mode with 60 views over 360°.
| Data set | Total activity (MBq) | Acquisition Time (s) |
|---|---|---|
| Sphere-air | 31.8 | 900 |
| Sphere-liver | 31.8 | 5400 |
| Sphere-spine | 31.8 | 5400 |
| Sphere-lung | 31.8 | 5400 |
| Liver | 24.4 | 10 800 |
| Background | 135.1 | 50 400 |
Computed tomography (CT) images of the water-filled phantom were also acquired on a GE PET∕CT scanner. These were later registered to SPECT images of the phantom; the CT bed in the CT image was then segmented and removed from the images, and digitally replaced by CT images of the bed used for the e.CAM system, obtained from Siemens. The resulting composite CT images of the phantom on the Siemens bed were used for attenuation and scatter estimation during the reconstruction.
The list-mode data sets from each phantom condition were first rebinned to obtain projections for two photopeak energy windows: 158–184 and 226–264 keV, and for three TEW energy windows: 153–158, 184–189, and 221–226 keV. No TEW window was needed above the 245 keV photopeak of 111In because there is no higher energy contamination for this radionuclide. The rebinned projection data were all appropriately decay corrected.
We then mimicked four different activity combinations, which are shown in Table II, by using different liver∕background and sphere∕background concentration ratios. For each activity combination, we created two “noise-free” projection data sets: one was a mixture of liver and background data (liver+background) and the other was a mixture of all three sphere data sets, as well as the liver and background data (sphere+liver+background). The projection data for each data set were scaled properly before mixing with other data sets by taking radioactive decay, scan time, and activity (measured by a dose calibrator) into account. An additional scale factor was then applied in order to end up with 10 million total counts within the two photopeak energy windows for the liver+background combination. Finally, we generated 16 independent noise realizations from each “noise-free” sphere+liver+background and liver+background combination of projection data.
Reconstructions
For fast MC simulation of scatter projections, we defined 12 “object energy windows” (OEWs): 122–134, 134–146, 146–158, 158–170, 170–172, 172–184, 184–196, 196–208, 208–220, 220–232, 232–244, and 244–246 keV. We also defined two “detector energy windows” (DEWs), 158–184 and 226–284 keV, for the 171 and 245 keV primary photons, respectively. Our earlier MC-JOSEM publications13 describe how the OEW and DEW are used during the joint iterative reconstruction.
Detector PSFs were simulated separately for a point source in air, and were represented by a five-dimensional array indexed by OEW, DEW, source-to-collimator distance (36 bins from 0.4 to 63.6 cm), and a two-dimensional detector “kernel” (4.78×4.78 mm2 sampling). Each kernel was represented by a 31×31 pixel array; however, only one 16×16 quadrant needed to be stored, owing to symmetry.
The following reconstruction schemes were used in this work:
-
1.
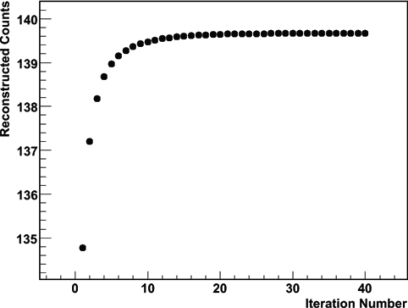
JOSEM was first used to reconstruct the projection data obtained from the sphere-air data. The attenuation within the small sphere was corrected (modeled during forward projection). The total counts reconstructed within a 5 cm spherical volume centered at the sphere were calculated. This number is shown for 40 iterations in Fig. 2. A plateau was reached after about 15 iterations. We used the total counts after 40 iterations to represent the true value of the sphere “activity.” This value was later scaled by the same factors that were used to scale the sphere-liver, sphere-spine, and sphere-lung projection data to mimic different activity combinations (after decay correction and scan time were taken into account).
-
2.
Scatter was first corrected by means of the TEW method using 5-keV-wide upper and lower scatter windows around the 171 keV photopeak window, and a 5-keV-wide lower scatter window below the 245 keV photopeak window. For each noise realization and for the noise-free projection data for each activity combination (both sphere+liver+background and liver+background), 40 iterations of JOSEM were performed. TEW-estimated scatter contributions were added to each estimated primary projection during the forward-projection steps.
-
3.
The fast MC algorithm was used to estimate scatter and cross-talk contributions to both energy windows starting with the reconstructed image from the 5th iteration of TEW-JOSEM. Fifty-million photon histories were generated to estimate scatter contributions for each of the 60 views. Finally, the scatter and cross-talk estimates were used to perform 40 additional iterations of JOSEM for each noise realization, as well as for each noise-free data set. The MC-estimated scatter contributions, which were only calculated once (after five iterations of TEW-JOSEM), were added to the estimates of primary photon projections during the forward-projection step of each subsequent iteration.
Figure 2.
111In reconstructed counts within a 5-cm-radius spherical volume centered on the sphere, vs iteration number for sphere-air data.
For all reconstructions, ten subsets were used with six projections per subset. The reconstructed image volume consisted of 112×112×84, 0.478 cm cubic voxels.
Evaluation
For each iteration of both TEW-JOSEM and MC-JOSEM, a “difference image” was computed by subtracting a liver+background image from the corresponding sphere+liver+background image. For each sphere location, we defined a 5-cm-radius spherical volume (524 cm3) centered at the center of the sphere. The counts within this volume of the difference image were presumed to be from the sphere only. This approach was used to evaluate performance in activity quantitation because neither reconstruction algorithm included a full correction for the so-called partial volume effect. Because the primary goal of the research reported here was to compare the two different methods of compensating for scatter and down scatter, we did not wish to include any additional confounding effects, such as those that might arise from inadequate partial-volume correction—even though we recognize that accurate activity quantitation in clinical practice would eventually, of course, require some form of partial-volume compensation. For each activity combination listed in Table 2, we calculated the relative bias, RBl, and relative standard deviation, RSDl, as:
| (1) |
where is the total counts within the 5-cm-radius spherical volume centered on sphere l (l=1,2,3 for the sphere attached to the liver, the spine, or the lung, respectively) in the difference image obtained from noise-free projection data; tl is the “true” counts from the sphere-air reconstruction; and Varl is the variance calculated from the 16 difference images, reconstructed from the 16 noise realizations. In principle, both the relative bias and the relative standard deviation can be calculated using a number of noise realizations. However, we chose to calculate the relative bias using “noise-free” projection data because a larger number of noise realizations would otherwise be needed in order to compute the relative bias with a high degree of precision (e.g., <2%).
Table 2.
Liver∕background and sphere∕background activity concentration ratios for different activity combinations.
| Combination | Liver∕background | Sphere∕background |
|---|---|---|
| C1 | 3 | 7 |
| C2 | 4 | 5 |
| C3 | 4 | 7 |
| C4 | 3 | 10 |
Additionally, we calculated the relative bias and the relative standard deviation of activity concentration estimates in both the liver and the background. We defined two regions, one in the liver (26.5 cm3) and the other one in the background (288.0 cm3). Each of these two regions was carefully selected so that it was at least 2 cm from the boundary of the corresponding organ. We evaluated two liver+background data sets with two different liver∕background activity concentration ratios: 3.0 and 4.0. For each, the relative bias was calculated from the noise-free reconstructed images using Eq. 1. For this case, since the partial-volume effect was minimal, the activity concentration, , was defined as the ratio between the total counts within the defined region and the total volume of the region (l=1,2 for liver or background, respectively). The “true value,” tl, was calculated as the ratio between the known activity injected into the compartment, measured using a dose calibrator, and the measured volume. This ratio was multiplied by a scaling factor to convert normalized activity concentration to count density. The scaling factor was calculated using the sphere-air measurement, while taking decay correction and acquisition time into account. The relative standard deviation of the organ activity estimates was also calculated from Eq. 1 using the 16 noise realizations.
RESULTS AND DISCUSSION
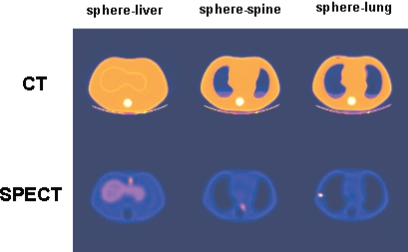
Three reconstructed SPECT slices are shown along with the corresponding registered CT slices in Fig. 3. The SPECT slices were reconstructed from noise-free projections of combination C1 by MC-JOSEM after ten iterations. The left, middle, and right SPECT slices show the spheres attached to the liver, the spine, and the lung, respectively. Although the lungs in the SPECT images appear to be larger than those in the CT images, this is because the lung cavities seen on the CT slices correspond to the actual low-density phantom lungs, whereas the apparent lung cavities on the SPECT slices include an extra layer of “cold” (nonradioactive) plastic surrounding these compartments. In addition, the SPECT display window, which was adjusted to include the full dynamic range of the counts in these SPECT slices, alters the apparent size of the lung regions, making them appear somewhat larger than they are.
Figure 3.
Transverse registered CT and SPECT slices through the sphere at three different locations. From left to right, the sphere was attached to the liver, the spine, and the lung.
A reconstructed transverse slice through the sphere attached to the liver is shown in Fig. 4 at different iteration numbers for one noise realization of the C1 activity combination. As expected, the images became noisier with increasing numbers of iteration for both TEW-JOSEM and MC-JOSEM. At the same iteration number, images reconstructed by MC-JOSEM were always less noisy than those reconstructed by TEW-JOSEM. This observation was confirmed by the quantitative analysis given below.
Figure 4.
A transverse slice through the sphere on the liver reconstructed by TEW-JOSEM and MC-JOSEM at different iteration numbers for one of the C1 noise realizations.
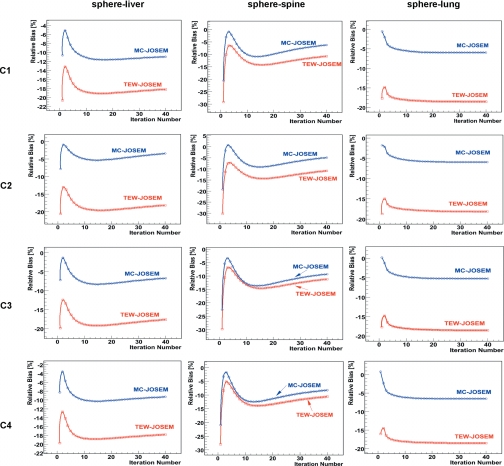
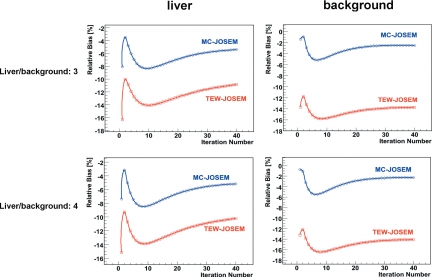
The relative bias of the estimates of sphere activity concentration is shown in Fig. 5 for the three sphere locations and for all activity combinations, C1-4, while Fig. 6 shows the relative bias of these estimates in the liver and the background for two different liver∕background concentration ratios. It may be seen from these plots that there is an early apparent minimum, or small (absolute) value of bias, generally within the first few iterations; this is followed by a worse bias, and subsequently by a slow recovery toward more reasonable bias values. We believe that the observation of a small bias after just a few iterations is serendipitous because it results from a very low-likelihood state. The objective function for the iterative algorithm is the likelihood that the measured projection data are consistent with the underlying statistical model of the data; the reconstruction algorithm attempts to maximize this global likelihood, which continues to increase slowly, even at large numbers of iterations. Also, the number of iterations corresponding to the early apparent minimum-bias of sphere activity estimates varies from region to region (or organ to organ) in the image, making it impossible to define a single, reliable condition to use for establishing “convergence” of the algorithm after just a few iterations. Our decision to stop the algorithm at 40 iterations for this study was based on a combination of convenience and the observation that our results were relatively stable at that point. Beyond that number of iterations, the accuracy of estimates generally continued to increase, while the precision worsened, though both of these metrics were changing very slowly beyond this point. The ultimate decision on where to stop an OSEM-based iterative algorithm generally depends on the details of the imaging application, e.g., the radiopharmaceutical being used, and on other practical considerations, such as the reconstruction time, and whether or not postreconstruction filtering and∕or a partial-volume correction method will be used.
Figure 5.
Relative bias of 111In sphere activity estimates for C1-4.
Figure 6.
Relative bias of 111In activity concentration estimates in the liver and the background.
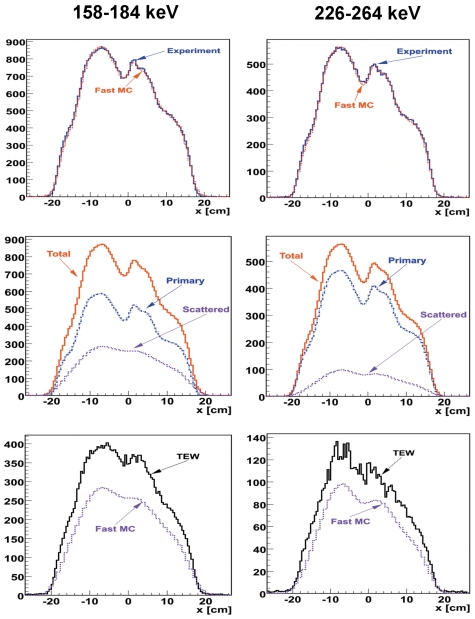
The larger relative bias of activity estimates from TEW-JOSEM, as compared with those from MC-JOSEM, was caused by an overestimation of scatter by TEW, which yielded activity estimates less than the true values. This was consistent with our observations of projection profiles. Figure 7 (top) shows a comparison between measured and fast MC-simulated projection profiles along the transaxial direction, after integrating over an axial range which covers the sphere attached to the liver, for both photopeak energy windows. The same scaling factor was used for both energy windows. An excellent agreement between measured and fast MC-simulated data can be seen. Figure 7 (middle) shows the separate contributions from primary and scattered photons. Figure 7 (bottom) compares profiles of scattered photons in the two In−111 windows estimated by the fast MC method with those estimated by the TEW method, which overestimated the scatter. Additionally, the profiles from TEW appear noisier than those obtained by fast MC, which explains the larger relative standard deviation of TEW-JOSEM, compared to that of MC-JOSEM. TEW scatter estimates are known to be noisy because they are derived from a relatively small number of counts in two narrow energy windows above and below the principal photopeak window. On the other hand, our fast MC program simulates a large number of photon histories and utilizes several different variance-reduction techniques, including convolution-forced detection. It should be pointed out that the total estimated projection profiles from TEW-JOSEM also agreed quite well, on average, with the experimentally measured total profiles; however, the TEW-JOSEM profiles were not included in the top row of Fig. 7 because these were also significantly noisier than the other two profiles, so they would have made it more difficult to visualize the excellent agreement between the MC-JOSEM and experimental profiles.
Figure 7.
Projection profiles at one projection angle from the “noise-free” C1 data. Top: a comparison between the experimental and fast MC profiles; middle: total, primary, and scattered profiles from fast MC; bottom: a comparison between TEW and fast MC scattered profiles. The same scaling factor was used for all the fast MC profiles.
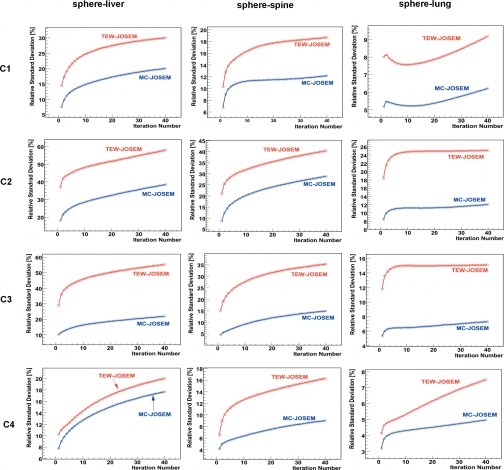
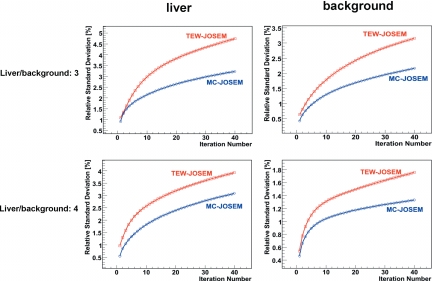
The relative standard deviation of the estimates of sphere activity concentration (Fig. 8) was calculated over all noise realizations for each of the three sphere locations and for all activity combinations, C1-4. Similarly, Fig. 9 shows the relative standard deviation (reproducibility) of activity-concentration estimates in the liver and the background for two different liver∕background concentration ratios. MC-JOSEM consistently yielded lower standard deviation than TEW-JOSEM for all iteration numbers. For both TEW-JOSEM and MC-JOSEM, the relative standard deviation of activity estimates in the sphere increased if the sphere counts decreased or the background counts within the corresponding spherical volume increased. Comparing C1 to C4, the relative standard deviation for C1 was higher because of C1’s lower sphere∕background concentration ratio. Comparing C1 to C3, the relative standard deviation was lower for C1 because of C1’s lower liver∕background concentration ratio. Comparing the three sphere locations for any of the activity combinations, the relative standard deviation was the highest for the liver location, the lowest for the lung position, and intermediate for the spine location. This was consistent with the background counts within the spherical volume, which were the highest for the liver location, lowest for the lung location, and intermediate for the spine location.
Figure 8.
Relative standard deviation of 111In sphere activity estimates for C1–4.
Figure 9.
Relative standard deviation of 111In activity concentration estimates in the liver and the background.
The values of relative bias and relative standard deviation of the estimates of sphere activity concentration, as well as those in the liver and the background after 40 iterations of TEW-JOSEM and MC-JOSEM are shown in Tables III, IV, V, and VI. The range of magnitudes of sphere and organ bias values in this study is fairly consistent with that reported in our earlier study of MC-JOSEM based on MC-simulated 111In data,12 except that the bias values in the present study were all negative, corresponding to a small underestimation of activity concentration, whereas those of the earlier simulation study included both negative and positive values. We believe that this difference is most likely attributable to our use of the GS scatter correction method in the earlier study to obtain the starting image for MC-JOSEM, as opposed to the TEW method used for the research reported here. The GS method generally provides a more accurate scatter correction than TEW, which implies that the initial MC-JOSEM scatter estimates were probably slightly more accurate when based on the GS method, as opposed to the TEW method. However, it is important to point out again in this context that the GS method would be impractical to implement on most commercial SPECT systems, which is the main reason we utilized TEW for this phantom study.
By averaging the results reported in Table 3, 4 over all activity combinations and sphere locations, we have achieved −6.9% bias (−11% to −3.5% range) and 16.1% reproducibility (5.0%–38.4% range) with MC-JOSEM, as compared to −15.8% bias (−18.5% to 10.6% range) and 27.4% reproducibility (7.5%–57.9% range) with TEW-JOSEM. Additionally, by averaging the results in Tables 5, 6 over the liver and the background, we have achieved −3.9% bias (−5.4% to −2.3% range) and 2.5% reproducibility (1.3%–3.2% range) of activity concentration estimates using MC-JOSEM, versus −12.3% bias (−14.1% to −10.2% range) and 3.4% reproducibility (1.8%–4.7% range) for TEW-JOSEM. It is clear that the TEW-JOSEM values of sphere bias in Table 3 are less for the spine sphere than for the other sphere locations. This bias depends in a complicated manner on the average scatter conditions near each sphere, as well as on the shape of the energy spectra seen over all projection angles. We believe that the fraction of scattered photons in the vicinity of the liver sphere is probably higher than that near the spine sphere, since the total activity surrounding the liver sphere is, on average, greater than that surrounding the spine sphere. Based on this consideration, however, there should be an even lower scatter fraction near the lung sphere, which is surrounded by the least activity, and is adjacent to the lowest density region. Since the TEW bias of the spine sphere is less than that of the lung sphere, however, this suggests that the reduced TEW bias of the spine sphere must, instead, be somehow related to the average shape of the energy spectrum in the vicinity of the spine sphere. It seems likely that the shape of this scatter spectrum must satisfy the underlying triangular approximation inherent in the TEW approach better for the spine sphere than for the other spheres.
Table 3.
Relative bias of activity estimates in the sphere for different activity combinations after 40 iterations.
| Sphere-liver | Sphere-spine | Sphere-lung | ||||
|---|---|---|---|---|---|---|
| Combination | TEW-JOSEM | MC-JOSEM | TEW-JOSEM | MC-JOSEM | TEW-JOSEM | MC-JOSEM |
| C1 | −18.2% | −11.0% | −10.8% | −6.3% | −18.5% | −6.0% |
| C2 | −18.2% | −3.5% | −10.9% | −4.9% | −18.2% | −5.9% |
| C3 | −17.6% | −6.7% | −11.2% | −9.3% | −18.5% | −5.2% |
| C4 | −17.9% | −9.3% | −10.6% | −8.3% | −18.5% | −6.6% |
Table 4.
Relative standard deviation of activity estimates in the sphere for different activity combinations after 40 iterations.
| Sphere-liver | Sphere-spine | Sphere-lung | ||||
|---|---|---|---|---|---|---|
| Combination | TEW-JOSEM | MC-JOSEM | TEW-JOSEM | MC-JOSEM | TEW-JOSEM | MC-JOSEM |
| C1 | 30.0% | 20.0% | 18.7% | 12.2% | 9.2% | 6.2% |
| C2 | 57.9% | 38.4% | 40.4% | 28.9% | 25.1% | 12.1% |
| C3 | 55.2% | 21.9% | 33.3% | 15.0% | 15.1% | 7.3% |
| C4 | 20.0% | 17.7% | 16.3% | 9.0% | 7.5% | 5.0% |
Table 5.
Relative bias of activity concentration estimates in the liver and the background for two different liver∕background activity concentration ratios after 40 iterations.
| Liver | Background | |||
|---|---|---|---|---|
| Liver∕background | TEW-JOSEM | MC-JOSEM | TEW-JOSEM | MC-JOSEM |
| 3 | −10.9% | −5.4% | −13.7% | −2.5% |
| 4 | −10.2% | −5.2% | −14.1% | −2.3% |
Table 6.
Relative standard deviation of activity concentration estimates in the liver and the background for two different liver∕background activity concentration ratios after 40 iterations.
| Liver | Background | |||
|---|---|---|---|---|
| Liver∕background | TEW-JOSEM | MC-JOSEM | TEW-JOSEM | MC-JOSEM |
| 3 | 4.7% | 3.2% | 3.2% | 2.2% |
| 4 | 3.9% | 3.1% | 1.8% | 1.3% |
As mentioned in the Introduction, Ichihara et al. (1993) showed that the TEW approach to scatter compensation can be applied to several different radionuclides. Although they did not consider 111In in that paper, they did obtain better accuracy for the other radionuclides (99mTc, 201Tl, and 123I) than we observed for TEW-JOSEM in our study. There were several differences between that study and ours, which probably account for the observed differences. Most importantly, the performance of the TEW method was determined by Ichihara and colleagues using a phantom much simpler in geometry and smaller in size than the torso phantom used in our study. Furthermore, this 20-cm-diam cylindrical phantom did not contain any activity in the background water surrounding the 1-cm-diam. “hot” cylindrical rods, whereas the hot spheres in our torso phantom were surrounded by or adjacent to large regions of two different activity concentrations (“liver” and “soft tissue” backgrounds). These differing conditions all imply that the fraction of scattered photons detected from the cylindrical rods in the Ichihara paper would have been significantly less than that arising from the torso phantom in our study. In addition, Ichihara et al. used narrower scatter windows than those of our study; however, they did not consider the precision or reproducibility of their quantitative results. In an effort to reduce the higher level of noise inherent in TEW scatter estimates, we used wider scatter windows, which would have improved the precision of activity estimates, though perhaps at a cost of somewhat reduced accuracy.
In most regions of the phantom, the bias results of our study were comparable in magnitude to those previously reported by He et al.6 in a quantitative 111In Monte Carlo simulation and physical phantom study, for which their analytic scatter model was used during the iterative reconstruction. In the lung region, however, these authors reported a bias of activity estimates as high as 20%. This was probably caused by the fact that lung is quite nonuniform, while the analytic scatter model assumes a uniform medium. According to He et al.,6 the primary approximation made in this model is that the object is uniform from where the photon is emitted to the last scatter point. Thus it is likely that this model would have most difficulties in regions where nonuniform attenuation is important. This may partly explain the fact that the quantitation in the lungs had the largest errors of all the large organs, for both physical phantom and simulation studies. For MC-JOSEM, the relative bias of the estimates of activity concentration in the sphere attached to the lung was only about 6%. The relative standard deviation of activity concentration in the liver and background using MC-JOSEM ranged from 1.3% to 3.2%, while He et al.6 reported a precision of better than 1%. Although we do not expect a MC-based approach to yield better precision than that of an analytic model-based method, the precision of the MC-JOSEM results could be further improved by increasing the number of simulated photon histories by the fast MC code. In addition, this precision depends on the total number counts within the two photopeaks, which was 10 million in our study, versus ∼17 million in the study of He et al.6
As mentioned in the Introduction, Dewaraja et al.8 have compared for 131I the performance of quantitative SPECT reconstructions—in which scatter estimates were determined using a standard Monte Carlo simulation—to those determined using the TEW method, finding that images reconstructed by Monte Carlo simulation were only slightly superior to those reconstructed with TEW. There are several differences between our study and theirs, some of which may explain this main difference in our conclusions. First, Dewaraja and colleagues used an analytic projector for the primary photons, whereas we used PSFs that were precomputed by MC simulation. Second, their results were not corrected for the partial-volume effect, whereas we circumvented the need for this correction, as discussed in Sec. 2, although we cannot say with certainty what effect this would have, or if it would influence the quantitative performance differently for the TEW versus the MC-based reconstruction. Finally, the best TEW results found by Dewaraja and colleagues required scaling the total scatter estimates up or down, but this scale factor would presumably be object dependent; because it is not clear how to determine what value of this factor should be used routinely for clinical studies, we simply used TEW in its original form, without additional scaling.
The quantitative imaging performance of MC-JOSEM might be improved further by computing one or more additional MC-based scatter estimates at later stages of the iterative procedure—especially since the initial TEW-based estimate, which was used to obtain the starting image for subsequent MC-JOSEM processing, significantly overestimated the scatter contributions to the projections. Dewaraja et al.8 utilized additional MC simulations to continue to refine their initial scatter estimates, finding that two complete MC scatter estimates were generally sufficient. We will investigate this possibility in future work.
CONCLUSIONS
We have used a fast Monte Carlo-based joint OSEM method, MC-JOSEM, to reconstruct SPECT data acquired in a torso phantom experiment. Results obtained from MC-JOSEM were compared with those from triple-energy-window-based JOSEM, TEW-JOSEM. MC-JOSEM consistently yielded better accuracy and precision for activity estimation. The average relative bias (relative standard deviation) of activity estimates in the sphere was −6.9% (16.1%) for MC-JOSEM after 40 iterations, versus −15.8% (27.4%) for TEW-JOSEM. The average relative bias (relative standard deviation) of activity concentration estimates in the liver and background was −3.9% (2.5%) for MC-JOSEM after 40 iterations, versus −12.3% (3.4%) for TEW-JOSEM. The improved performance of MC-JOSEM indicates that it is a promising approach for quantitative activity estimation in 111In SPECT.
ACKNOWLEDGMENTS
We would like to thank Robert E. Zimmerman of Brigham and Women’s Hospital for helping to register the CT map to the SPECT images. We also would like to thank Dr. Mi-Ae Park of Brigham and Women’s Hospital for helping to measure the activity and volume of the sphere phantom. This work was supported by NIH Grant Nos. RO1-EB001989, RO1-EB005876, and RO1-EB000802. All the image reconstructions for this paper were performed on the Linux cluster supported by Neuroimage Analysis Center (NIH Grant No. P41RR013218) at Brigham and Women’s Hospital.
References
- Ogawa K., Harata Y., Ichihara T., Kubo A., and Hashimoto S., “A practical method for position-dependent Compton-scatter correction in single photon emission CT,” IEEE Trans. Med. Imaging 10.1109/42.97591 10, 408–412 (1991). [DOI] [PubMed] [Google Scholar]
- Ichihara T., Ogawa K., Motomura N., Kubo A., and Hashimoto S., “Compton scatter compensation using the triple-energy window method for single- and dual-isotope SPECT,” J. Nucl. Med. 34, 2216–2221 (1993). [PubMed] [Google Scholar]
- Zaidi H. and Koral K. F., “Scatter modeling and compensation in emission tomography,” Eur. J. Nucl. Med. Mol. Imaging 31, 761–782 (2004). [DOI] [PubMed] [Google Scholar]
- Gilland D. R., Jaszczak R. J., Turkington T. G., Greer K. L., and Coleman R. E., “Quantitative SPECT imaging with indium-111,” IEEE Trans. Nucl. Sci. 10.1109/23.289386 38, 761–766 (1991). [DOI] [Google Scholar]
- Leichner P. K., Vriesendorp H. M., Hawkins W. G., Quadri S. M., Yang N., Stinson R. L., Loudenslager D. M., Frankel T. L., Chen X., and Klein J. L., “Quantitative SPECT for indium-111-labeled antibodies in the livers of beagle dogs,” J. Nucl. Med. 32, 1442–1444 (1991). [PubMed] [Google Scholar]
- He B., Du Y., Song X., Segars W. P., and Frey E. C., “A Monte Carlo and physical phantom evaluation of quantitative In−111 SPECT,” Phys. Med. Biol. 50, 4169–4185 (2005). [DOI] [PubMed] [Google Scholar]
- Frey E. C. and Tsui B. M. W., “A new method for modeling the spatially-variant, object-dependent scatter response function in SPECT,” IEEE Nucl. Sci. Symposium, Vol. 2, pp. 1082–1086, 1996. (unpublished).
- Dewaraja Y. K., Lijungberg M., and Fessler J. A., “3-D Monte Carlo-based scatter compensation in quantitative I−131 SPECT reconstruction,” IEEE Trans. Nucl. Sci. 10.1109/TNS.2005.862956 53, 181–188 (2006). [DOI] [PMC free article] [PubMed] [Google Scholar]
- de Jong H. W. A. M. and Beekman F. J., “Rapid SPECT simulation of downscatter in non-uniform media,” Phys. Med. Biol. 10.1088/0031-9155/46/3/301 46, 621–635 (2001). [DOI] [PubMed] [Google Scholar]
- de Jong H. W. A. M., Slijpen E. T. P., and Beekman F. J., “Acceleration of MC SPECT simulation using convolution-based forced detection,” IEEE Trans. Nucl. Sci. 10.1109/23.910833 48, 58–64 (2001). [DOI] [Google Scholar]
- de Jong H. W. A. M., Wang W.-T., Frey E. C., Viergever M. A., and Beekman F. J., “Efficient simulation of SPECT down-scatter including photon interactions with crystal and lead,” Med. Phys. 10.1118/1.1462638 29, 550–560 (2002). [DOI] [PubMed] [Google Scholar]
- Moore S. C., Ouyang J., Park M. A., and El Fakhri G., “Monte Carlo-based compensation for patient and detector scatter and cross talk contamination in In−111 SPECT imaging,” Nucl. Instrum. Methods Phys. Res. A 10.1016/j.nima.2006.08.079 569, 472–476 (2006). [DOI] [Google Scholar]
- Ouyang J., El Fakhri G., and Moore S. C., “Fast Monte Carlo based joint iterative reconstruction for simultaneous 99mTc∕123I SPECT imaging,” Med. Phys. 10.1118/1.2756601 34, 3263–3272 (2007). [DOI] [PubMed] [Google Scholar]


