Abstract
In breast tomosynthesis a rapid sequence of N images is acquired when the x-ray tube sweeps through different angular views with respect to the breast. Since the total dose to the breast is kept the same as that in regular mammography, the exposure used for each image of tomosynthesis is 1∕N. The low dose and high frame rate pose a tremendous challenge to the imaging performance of digital mammography detectors. The purpose of the present work is to investigate the detector performance in different operational modes designed for tomosynthesis acquisition, e.g., binning or full resolution readout, the range of view angles, and the number of views N. A prototype breast tomosynthesis system with a nominal angular range of ±25° was used in our investigation. The system was equipped with an amorphous selenium (a-Se) full field digital mammography detector with pixel size of 85 μm. The detector can be read out in full resolution or 2×1 binning (binning in the tube travel direction). The focal spot blur due to continuous tube travel was measured for different acquisition geometries, and it was found that pixel binning, instead of focal spot blur, dominates the detector modulation transfer function (MTF). The noise power spectrum (NPS) and detective quantum efficiency (DQE) of the detector were measured with the exposure range of 0.4–6 mR, which is relevant to the low dose used in tomosynthesis. It was found that DQE at 0.4 mR is only 20% less than that at highest exposure for both detector readout modes. The detector temporal performance was categorized as lag and ghosting, both of which were measured as a function of x-ray exposure. The first frame lags were 8% and 4%, respectively, for binning and full resolution mode. Ghosting is negligible and independent of the frame rate. The results showed that the detector performance is x-ray quantum noise limited at the low exposures used in each view of tomosynthesis, and the temporal performance at high frame rate (up to 2 frames per second) is adequate for tomosynthesis.
Keywords: flat-panel detectors, amorphous selenium, breast tomosynthesis, MTF, NPS, DQE, lag, ghosting
INTRODUCTION
Breast tomosynthesis is an emerging 3-D imaging technique that provides depth information by acquiring several projection views within a limited angular range.1, 2, 3, 4, 5 It has been implemented by modification of existing mammography gantry and digital detectors, therefore it has the potential of rapid clinical transition. Early clinical studies have shown promising results of improved lesion detection over 2-D projection mammography by removing the obscuring effect of overlapping breast tissue. Since breast tomosynthesis uses a limited angular range, which is insufficient for artifact free reconstruction of the 3-D information, the majority of existing research efforts were devoted to the development and comparison of different reconstruction algorithms.3, 6, 7 Very few investigations have been focused on the effect of acquisition geometry and detector performance. Ren et al. studied the resolution characteristics of a Hologic prototype breast tomosynthesis system equipped with an amorphous selenium (a-Se) digital detector with a pixel size of 70 μm.8 Bissonnette et al. studied the detector performance for the Siemens prototype breast tomosynthesis system and presented the preliminary clinical breast imaging results.9 Both systems employed continuous motion of x-ray tubes during image acquisition to minimize system instability and scan time, and focal spot blur due to tube motion was considered as an important factor for spatial resolution.8 Previously we built a computer simulation platform for breast tomosynthesis to investigate the effects of detector performance and acquisition geometry on image quality.10 The in-plane modulation transfer function (MTF) was calculated from reconstruction of simulated projection images of a tungsten (W) wire, and the results were compared for different acquisition geometry and reconstruction algorithms. It was found that pixel binning is the dominant source of image blur compared to focal spot blur (due to tube motion) and reconstruction filters.
Previously several studies have been performed on the imaging characteristics of a-Se flat-panel detectors for single-view regular mammography.11, 12, 13, 14 The purpose of the present study is to investigate an a-Se digital mammography detector with enhanced performance for breast tomosynthesis. The detector performance was evaluated in the context of tomosynthesis acquisition, which differs from regular mammography in the following aspects: (1) the x-ray exposure per image is 1∕N of that used in regular mammography; (2) the tube travels continuously during x-ray exposure, which causes additional focal spot blur; (3) the images are acquired at much higher frame rate (up to 2 frames per second) and pixel binning is an option to trade resolution for frame rate; and (4) the x rays could enter from a larger oblique angle to the detector surface. Physical properties of the detector were characterized using MTF, noise power spectrum (NPS), and detective quantum efficiency (DQE) at different detector and system operational conditions. The temporal performance was categorized as lag and ghosting and was measured as a function of exposure. It is desirable for the detector performance in tomosynthesis to reach the following criteria: (1) The performance is dominated by x-ray quantum noise at the low exposures used in each view of tomosynthesis. (2) The presampling MTF of the projection images is dominated by the inherent properties of the detector and not by the additional focal spot blur or the oblique entry of x rays experienced in tomosynthesis acquisition. (3) The combined effects of lag and ghosting will not generate noticeable image artifact in a reconstructed tomosynthesis image. How the detector performance parameters measure up to these criteria will be addressed in Sec. 3.
METHODS
System operation
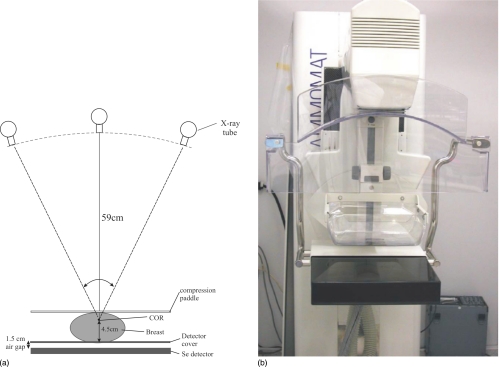
The prototype breast tomosynthesis system (Siemens Mammomat NovationTomo) was modified from a digital mammography unit (Siemens Mammomat NovationDR). (Caution: Investigations device. Limited by U.S. Federal law to investigational use. The information about this product is preliminary. The product is under development and is not commercially available in the US and its future availability cannot be ensured.) As shown in Fig. 1, the breast is compressed above a stationary a-Se full field digital mammography detector. The center of rotation (COR) of the x-ray tube is 4.5 cm above the detector carbon fiber surface, which is ∼1.5 cm above the surface of the a-Se layer. The source to imager (a-Se surface) distance (SID) is 65 cm, the same as that in regular mammography. The a-Se detector has a dimension of 24×30 cm2 and a pixel pitch of 85 μm, resulting in an image size of 2816×3584. The detector can be read out with full resolution or 2×1 binning (with binning in the tube travel direction), which shortens the image readout time by 50%. The readout times for each frame were 0.6 and 0.3 s, respectively, for full resolution and 2×1 pixel binning modes. The detector was operated in a repeated “integrate and read” sequence, with a signal integration window of 0.2 s between subsequent detector readout. The detector binning was accomplished by reading two adjacent gate lines at the same time. The x-ray tube travels continuously in an arc within a nominal angular range of ±25°, and x-ray pulses are generated within the integration window of the detector for each frame. The actual angular position of the x-ray tube at the beginning of radiation exposure for each view was measured with an inclinometer mounted in the tube housing (MicroStrain, Inc., VT), which measures the tilt angle of the x-ray tube column with respect to gravity. The number of views in each acquisition can be varied from 11 to 49. The x-ray tube had nominal focal spot sizes of 0.1 and 0.3 mm, and target material choices of molybdenum (Mo) and W. The target∕filter combination of W∕rhodium (Rh) with nominal Rh filter thickness of 50 μm was chosen for all our measurement because, compared to the Mo target, it delivers harder x-ray spectrum at higher tube current, which allows for shorter x-ray exposure time and higher dose efficiency for tomosynthesis.15, 16 Our previous theoretical calculation showed that the optimal kVp for an average breast thickness of 4 cm is ∼28 kVp with W∕Rh combination.16 Hence this spectrum was used for all our measurements of NPS and DQE. During the experiment, a 3.95 cm Lucite block was inserted into the tube output to mimic the attenuation of a breast with average thickness. Although the x-ray attenuation coefficient of Lucite is not equivalent to that of 50∕50 breast tissue, it is readily available and close to the attenuation of 40∕60 (fat∕glandular) breast at the mean energy (19.2 keV) of the x-ray spectrum used in our measurement. The x-ray exposure, given in mR∕mAs, was measured using a Keithley dosimeter (model 35050 A) and an ion chamber (model 35050 B).
Figure 1.
(a) Geometry of the prototype breast tomosynthesis system. (b) A photograph of the prototype tomosynthesis system used in our investigation.
Table 1 shows examples of the image acquisition modes available on the prototype system. They differ in detector resolution (binning or full resolution), number of views, gantry travel speed, and whether an offset image is acquired between two subsequent x-ray images. The abbreviated name we have chosen for each acquisition mode has the following meanings: “x” refers to x-ray frames only; “xb” refers to offset frame acquired between subsequent x rays; the number refers to the number of views for each scan; and “bin” means the detector was operated in binning mode. The modes with “zero” in the front mean that the gantry rotation was disabled during the acquisition of the image sequence. These modes were usually used during physics investigation of the detector performance.
Table 1.
Detector acquisition modes used in the present investigation.
| Imaging geometry | Detector operational mode | Scan time | |||
|---|---|---|---|---|---|
| Mode name and angular range | No. of views | Dark frame between x rays | Pixel binning | Gantry speed (cm∕s) | Scan time (s) |
| x25:±20° | 25 | No | No | 2.4 | 20.8 |
| x25bin:±21° | 25 | No | Yes | 3.9 | 12.7 |
| x19:±21° | 19 | No | No | 3.1 | 15.8 |
| Zero xb25:0° | 25 | Yes | No | 0 | 46.5 |
| Zero x25bin:0° | 25 | No | Yes | 0 | 12.7 |
Modulation transfer function (MTF)
In breast tomosynthesis, three factors affect the spatial resolution of the projection images: (1) inherent detector resolution, (2) focal spot blur due to the motion of the x-ray tube, and (3) the oblique entry of x rays. The inherent resolution of a-Se detectors is determined mainly by the pixel pitch. In regular mammography, the size of the focal spot (nominally 0.1 and 0.3 mm) rarely causes degradation of spatial resolution because there is very little magnification. In most tomosynthesis systems, however, the x-ray tube travels continuously during x-ray exposure (for stability of the gantry) and causes significant increase in the effective focal spot. The effective focal spot size is proportional to the product of the gantry travel speed and the x-ray exposure time for each view, which varies with dose and imaging geometry. Since detector binning is in the tube travel direction, its effect on spatial resolution should be compared with that due to focal spot motion (FSM).
The presampling MTF of the detector was measured with the slanted slit method described by Fujita et al.17 The slit phantom (Nuclear Associate, NY) with 10 μm width was placed on top of the detector cover and centered with respect to the left and right edges of the detector. The direction of the slit was oriented with a small angle (2°–3°) from the gate-line or the data-line of the detector. The exact angle of the slit orientation was determined from the slit image by fitting the pixels with maximum intensity of each line (which indicates the intersection point of the slit) with a straight line. The x-ray exposure (to the detector) used for acquiring each slit image was 104 mR. To include the effect of focal spot blur (FSB), the images were acquired with tube motion in two modes: “x25bin” and “x19,” where the gantry speed (shown in Table 1) is the largest for pixel binning and full resolution modes, respectively. The exposure time per view was ∼164 ms, resulting in FSMs of 6.4 and 5.2 mm, respectively, for x25bin and x19. Since the radiation at oblique angles was cut off by the narrow slit, only the central view of the tomosynthesis acquisition was used to determine the detector MTF with FSM. It is important to note that the maximum exposure time of 164 ms per view was used for the acquisition of slit images to minimize the effect of noise on the determination of an oversampled line spread function (LSF). In addition, the tails of the measured LSF were fitted with an exponential decay function to further reduce noise before taking a Fourier transform to obtain the presampling MTF. In tomosynthesis scans of an average breast thickness, the exposure time is typically 1∕5 of what was used. Hence the effect of FSM in our measurements was the worst case scenario. With a given tomosynthesis geometry and an object plane of interest, which determine the magnification factor, the effect of FSM on the presampling MTF at the detector plane can be easily calculated after scaling the FSM distance by the magnification factor.10 The calculated results were compared to the measured presampling MTF with the FSM.
Another factor affecting the MTF in tomosynthesis is the oblique entry of x rays, which has been studied previously for a-Se flat-panel detectors.18, 19, 20, 21 In our prototype system, the detector remains stationary while the x-ray tube rotates around the COR. A maximum tube angle of 20° corresponds to oblique entry angles of 18° and 30°, respectively, for the center and far edge of the detector. Using the method described in Ref. 21, the MTF due to oblique entry of x rays was calculated. The MTF due to oblique angle was also measured by the slanted-edge technique.22, 23, 24 A 250 μm thick W edge was placed in the center of the detector close to the chest wall side. The images were acquired at two tube column angles (with respect to the surface of the detector) of 0° and 23°, which correspond to detector x-ray entry angles of 0° and 21°, respectively, according to the system geometry shown in Fig. 1a. The edge images were used to calculate the edge spread function (ESF), the derivative of which formed the LSF. The MTF was obtained by Fourier transform of the LSF. The additional blur due to oblique entry of x rays was obtained by dividing the MTF at angle θ by that at angle 0°:
| (1) |
X-ray sensitivity and noise power spectrum (NPS)
NPS was measured for x-ray exposures ranging from 0.4 to 5.7 mR in both binning and full resolution modes. Two imaging modes without gantry motion were used: “Zero x25bin” and “Zero xb25.” To minimize the effect of lag on NPS measurements, only the first image from each tomosynthesis acquisition was used for the calculation. Offset and gain correction was applied to each image, and a uniform area with 512×512 pixels at the center of the chest wall side of the detector was chosen as the region of interest (ROI). The x-ray response of the detector at each exposure was calculated by averaging the pixel values in the ROI. The pixel x-ray sensitivity k was determined from the linear fitting of the pixel response versus exposure curve. Each ROI image was then divided into 16 subimages, each with 128×128 pixels. Two tomosynthesis sequences were acquired at each exposure, hence 32 realizations of NPS were generated. The two-dimensional (2-D) NPS was then calculated from the mean-subtracted subimages using25
| (2) |
where ⟨ ⟩ represents the ensemble average, Nx and Ny are the number of elements in the x and y directions, respectively, and dx and dy are the pixel pitch in each direction (both are 85 μm in our case). In pixel binning mode the detector generates duplicated values for neighboring pixels in the binning direction such that the image has the same dimension as in the full resolution mode. For NPS analysis, the duplicated values (every other pixel in the binning direction) were removed before the NPS calculation, resulting in an effective dx=170 μm and 16 realizations with Nx=128. The 1-D NPS representing the central slice of the 2-D NPS was estimated from the 2-D NPS. Since the central slices (i.e., fx=0 or fy=0) of the 2-D NPS usually contain spikes due to fixed pattern noise of the system, they were omitted in the computation of 1-D NPS. Instead, a thick slice with four NPS lines (corresponding to the frequency range of 0.09–0.38 cycles∕mm) on either side of the central axes was used to generate the 1-D NPS curve. For each data point with frequency (u,v) in the thick slice, the frequency value was computed as and binned to the nearest frequency data point on the NPS axes to obtain 1-D NPS in both directions.
Detective quantum efficiency (DQE)
From the presampling MTF and the NPS, the DQE of the detector at each exposure was calculated using26
| (3) |
where q0 is the incident x-ray quanta per unit area (in quanta mm−2), and k is the pixel response of detector at a given exposure (in ADU∕mR). The presampling MTF curve was interpolated to the same frequency data points as the NPS curves. The x-ray spectrum used in our NPS measurements (28 kVp W∕Rh with 3.95 cm Lucite) was modeled using Boone’s parametrization method,27, 28 from which the value for q0 was calculated as 5.83×10⁴ photons∕mm2∕mR.
Temporal performance: Lag and ghosting
Due to the rapid image acquisition required for tomosynthesis, temporal performance of the detector plays an important role. Lag and ghosting of the a-Se flat-panel detector was investigated as a function of x-ray exposures and detector operational modes used in tomosynthesis.
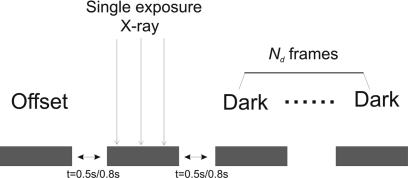
Lag is the carry-over of image charge generated by previous x-ray exposures into subsequent image frames and manifested as changes in dark images, i.e., readout of the detector without an x-ray exposure. It was measured with the detector operated in either full resolution or binning mode, with corresponding time intervals between subsequent images of 0.8 and 0.5 s, respectively. The measurement was performed without gantry motion. The x-ray exposures chosen for the lag measurement are relevant to tomosynthesis acquisition. We assumed that the total dose for a tomosynthesis scan is equivalent to a single-view regular mammogram, which is ∼1.6 mGy for a 4 cm breast with average density according to a national survey of digital mammography.29 Although it has been suggested in the past that one mediolateral oblique (MLO) view is perhaps sufficient for tomosynthesis, more recent study has shown that imaging in both craniocaudal (CC) and MLO positions is desirable for optimal lesion visualization.30 With the spectrum used in our experiment (28 kVp W∕Rh), a glandular dose of 1.6 mGy corresponds to a mean detector exposure behind the breast of ∼30 mR, i.e., ∼1.2 mR per view with 25 views. Under the same exposure condition, the detector exposure for areas outside the breast is ∼455 mR in regular mammography and ∼18.2 mR per view in tomosynthesis. The image acquisition sequence for the measurement of lag is shown in Fig. 2, where an offset image was acquired before a single x-ray exposure, which ranged from 0.5 to 15 mR. After the x-ray frame, Nd=25 dark images were acquired. The x-ray and trailing dark images were corrected by subtracting the offset frame acquired before the x-ray exposure. The full x-ray signal and residual signal were computed using a 400×400 pixel ROI within the radiation field. Lag was quantified as the ratio between the residual signal in each dark frame and the full x-ray signal and was examined as a function of time at different exposure levels. Ghosting, i.e., change in x-ray sensitivity as a result of radiation exposure, in a-Se flat-panel detectors is dominated by the effect of electrons captured in deep traps in the bulk. These trapped electrons change the x-ray sensitivity of a-Se with two mechanisms: (1) modify the electric field distribution in the bulk of a-Se, which affects the x-ray-to-charge conversion gain, and (2) recombine with x-ray generated free holes, which reduce the x-ray sensitivity.31, 32 Ghosting can also be caused by charge trapping at the interface of the detector,33 e.g., in the gap between pixel electrodes. These trapped charges will increase the effective fill factor34 and increase the x-ray sensitivity of subsequent frames.
Figure 2.
Diagram showing the image sequence used in lag measurement: An offset image was acquired before x-ray exposure, and Nd image frames were acquired after a single x-ray exposure. The x-ray exposure varied from 0.5 to 15 mR. The time intervals between subsequent image views are 0.5 and 0.8 s, respectively, for binning and full resolution modes.
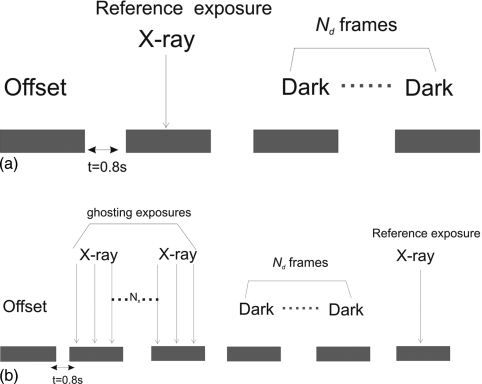
In tomosynthesis, ghosting will most likely cause an artifact near the edge of the breast, where the detector could receive raw exposure in one view and behind the breast in the next. The image acquisition sequence used in our ghosting measurement is shown in Fig. 3. All images were acquired with full detector resolution and no gantry motion. The reference x-ray sensitivity (without ghosting) was first established using exposures comparable to that received by the detector behind the breast per view (0.4–5 mR). The ghosting dose ranged from 10 mR to 1 R and was 17–170 times the reference exposure. Due to the limited x-ray integration time in tomosynthesis (0.2 s), the maximum detector exposure that can be delivered per view was 0.1 R. Therefore, several (Nx) consecutive exposures were made to achieve the total ghosting exposure. Since ghosting is a long term effect, the “ghosted” x-ray sensitivity at the same reference exposure was measured several frames (Nd>10) after the ghosting dose was delivered so that the effect of lag was minimized. All the x-ray images were corrected for offset and gain non-uniformity. Ghosting was quantified as the ratio between the “ghosted” sensitivity and the reference sensitivity and was examined as a function of ghosting exposure.
Figure 3.
Diagram for ghosting measurement; x-ray sensitivity was measured at a reference exposure before (a) and after (b) ghosting exposures. The exposure for ghosting ranged from 10 to 1000 mR. Ghosting is quantified as ratio of sensitivity at reference exposure before and after ghosting.
RESULTS AND DISCUSSION
MTF
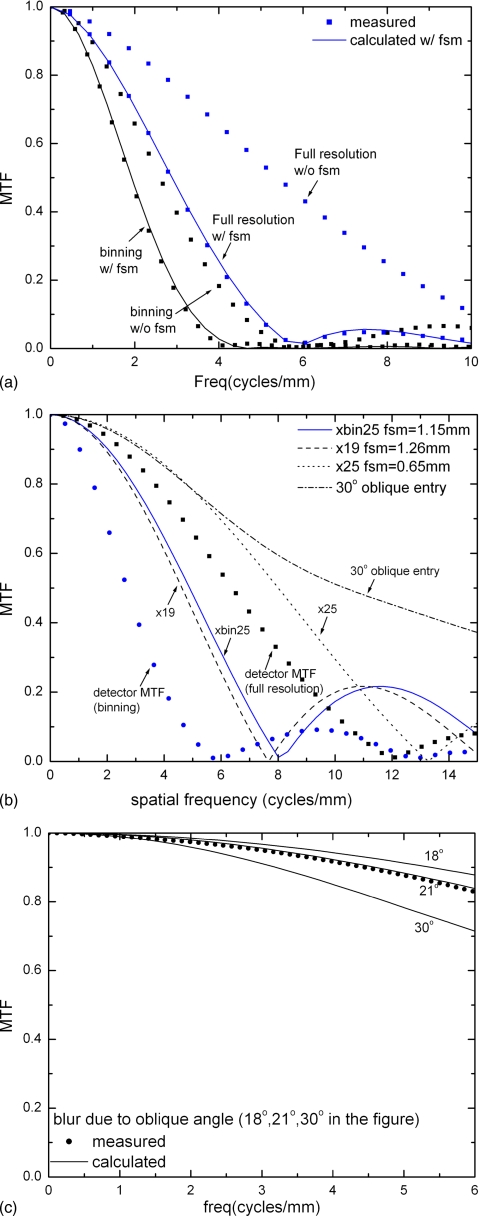
Figure 4a shows the presampling MTF with and without pixel binning. The MTF shown is in the data-line (binning) direction, and the effect of binning on the first zero of the presampling MTF is clearly seen. Also shown in Fig. 4a is the measured presampling MTF with gantry motion. The measured presampling MTF with FSM agrees well with calculation. The effect of FSM, however, increases with the distance of the object from the detector surface due to magnification. Figure 4b shows the calculated presampling MTF due to FSM for an object plane that is ∼4 cm from the detector surface. The detector presampling MTF without FSM in the full resolution and binning modes are shown in the same graph for comparison. The total exposure, which is 28 kVp and 144 mAs with W∕Rh target∕filter combination, corresponds to the glandular dose of 1.7 mGy for a 4 cm breast with average composition. Three imaging modes with total scan time of 20 s or less were chosen. The FSMs are 1.15, 1.26, and 0.65 mm, respectively, for the imaging modes of x25bin, x19, and x25. It shows that the blur due to FSM is dominant for mode x19 and comparable to the detector inherent MTF for mode x25. We can predict that for full resolution mode with fewer number of views (<19), which results in faster gantry travel, FSB will be the dominant factor for presampling MTF. In binning mode (x25bin), the aperture function is the dominant source of blur.
Figure 4.
(a) Presampling MTF measured from the system; (b) a comparison of MTF due to detector inherent resolution, focal spot blur, and oblique entry angle; and (c) calculated and measured MTF due to oblique x-ray entry alone.
The blur due to oblique x-ray entry alone is shown in Fig. 4c. The measured result at 21° agrees well with that from theoretical calculation. Also plotted in the same graph are the calculated results for the range of oblique angles (18°–30°) expected for our tomosynthesis geometry. In the worst case of 30°, which corresponds to the far side of the detector with the x-ray tube column at the maximum angle, the blur due to oblique x-ray entry causes MTF to decrease by 28% at fNY (5.88 cycles∕mm). This calculated MTF is added to the graph in Fig. 4b for comparison with other factors. It shows that FSB or pixel binning is the dominant effect of blur in tomosynthesis image acquisition.
The practical advantage of pixel binning is to shorten scan time. When binning is performed in the scan direction, its effect on image blur should be compared with FSB. Even with full resolution readout, the MTF in the scan direction is degraded by FSB due to continuous tube motion. Therefore, the relative degradation of MTF due to pixel binning is not as severe as in regular mammography with stationary gantry, or in a step-and-shoot tomosynthesis system. Whether binning mode should be used in tomosynthesis depends ultimately on its impact on the detectability of objects, most notably microcalcifications. This topic is beyond the scope of the present investigation, which focuses on the detector performance in different image acquisition modes.
X-ray sensitivity
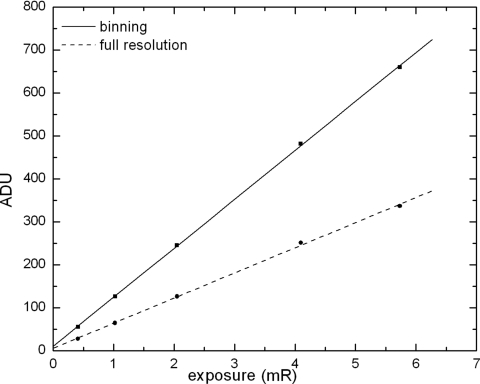
Figure 5 shows the pixel response, in analog-to-digital units (ADU), measured as a function of x-ray exposure in both full resolution and pixel binning modes. The pixel x-ray sensitivity was determined from the linear fitting of the measurements, and results were 58.5 and 114 ADU∕mR, respectively, for full resolution and binning modes. The sensitivity in binning mode is approximately twice that with full resolution, which is to be expected from the doubling of effective pixel size in the binning direction.
Figure 5.
Pixel response of the detector in full resolution and binning modes as a function of x-ray exposure. Measured data are shown with symbols and linear fitting shown with straight lines. ADU∕mR=58.5 for full resolution and 114 for binning mode.
NPS
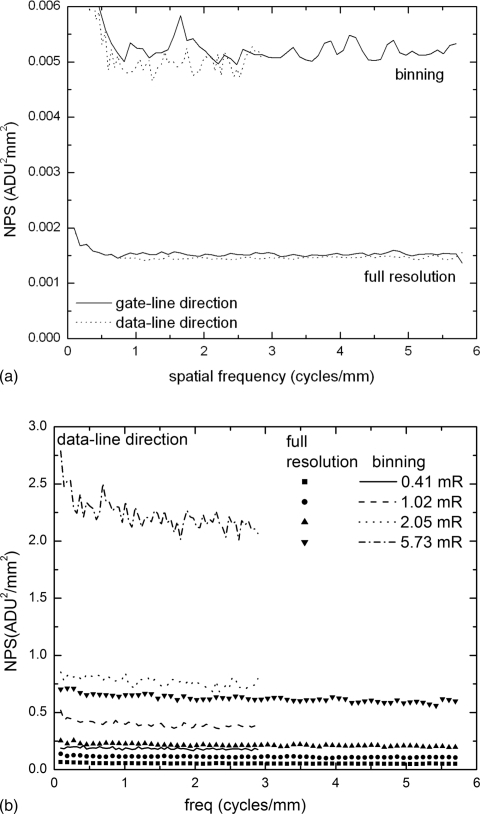
Figure 6a shows the dark NPS of the detector measured without x-ray exposure. The NPS(0), which was estimated from extrapolation of the NPS curve to zero frequency, for binning mode is approximately 3.5 times that for full resolution mode. However, since the fNY in the data-line direction (binning direction) is reduced to one-half due to binning, the integrated NPS, which is equal to the pixel variance , in binning mode is ∼1.7 times that in full resolution mode. Since charge amplifier noise is independent of pixel binning, the fact that almost doubled with binning means that other sources of electronic noise, e.g., pixel reset noise and gate-line correlated noise,35 that scale with pixel pinning make significant contributions.
Figure 6.
(a) Measured electronic noise NPS (in orthogonal directions of the detector) in both full resolution and pixel binning modes; (b) NPS at different detector exposures for both modes. For clarity, only NPS in the data-line (binning) direction is shown. The Nyquist frequencies fNY of NPS are 5.88 and 2.94 cycles∕mm, respectively, for full resolution and binning modes.
Figure 6b shows the measured NPS in the data-line (binning) direction at different detector exposures in both full resolution and binning modes. The NPS is essentially white throughout the frequency range. This is consistent with our previous theoretical investigation.36 The NPS(0) in binning mode at high exposures, e.g., 6 mR where the effect of electronic noise is negligible, is approximately four times that for full resolution mode, which means that the integrated NPS (pixel variance ) doubles with pixel binning. This is consistent with the scaling of x-ray quantum noise with pixel size. At the low exposure of 0.4 mR, the contribution of electronic noise to the total NPS is <10 % for both modes. This indicated that the system is essentially x-ray quantum noise limited for tomosynthesis imaging.
DQE
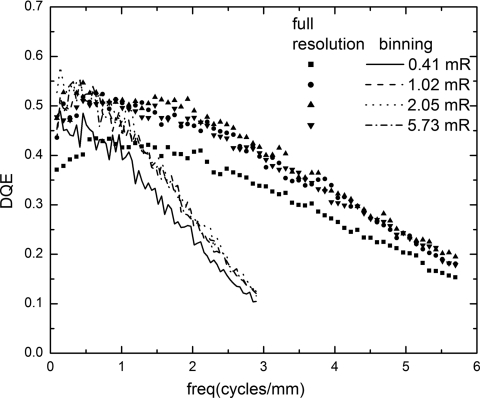
The DQE determined from Eq. 3 is plotted as a function of spatial frequency and exposure for both modes in Fig. 7. There is a noticeable decrease in DQE for spatial frequencies of f<0.5 cycles∕mm, which is due to a corresponding increase in NPS in the same frequency range. This phenomenon was investigated previously and attributed to the image correction algorithms, which introduced additional noise at low spatial frequencies.36 The DQE(f) essentially follows the shape of MTF2(f) because there is very little spatial correlation in the measured NPS. Hence the DQE (f) in binning mode drops more rapidly as spatial frequency increases. At the lowest exposure of 0.41 mR used in the measurements, the extrapolated value for DQE(0) drops from the maximum value of ∼0.58 to 0.5 due to the degradation effect of electronic noise. The DQE(0) for the two modes are essentially the same because the degradation effect of electronic noise is comparable, as shown in Fig. 6a.
Figure 7.
Measured detector DQE at different exposures in full resolution and binning modes. Individual symbols are used for the results in full resolution mode, and lines are used for the binning mode.
Lag and ghosting
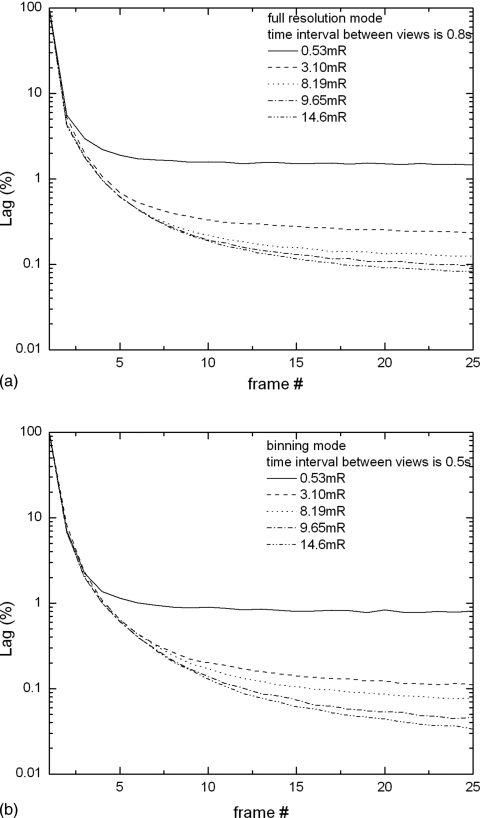
The results of lag measurements plotted as a function of frame number are shown in Figs. 8a, 8b, respectively, for the full resolution and binning modes. Figure 8a shows that with full resolution readout (frame interval of 0.8 s), the first frame lag of ∼4%–5% is relatively independent of x-ray exposure. After the second frame, the relative percentage of lag starts to show an inverse dependence on exposure. This is because two mechanisms contribute to lag in a-Se: (1) detrapping of charge from shallow traps, which is proportional to x-ray signal, and (2) the increase in charge injection from the positive bias electrode due to an increase in electric field at this interface as a result of electrons captured in deep traps in the bulk. The first mechanism is dominant for the first frame lag, hence the residual signal exhibits a constant fraction of the x-ray signal. The second mechanism is dominant for the remainder of the lag measurements. Since the increase in charge injection depends on the nature of metal contact (barrier height) and blocking layers, it is not expected to be directly proportional to exposure, but rather reaching a steady state with time that is independent of exposure. Hence its relative effect on lag is less at higher exposures.
Figure 8.
Lag as a function of frame number measured at different detector exposures for (a) full resolution and (b) binning mode.
Shown in Fig. 8b are the measurements of lag with 2×1 pixel binning. Due to the shorter time interval (0.5 s) between frames, the first frame lag of 8%−9% is almost twice that with full resolution readout. After the second frame, the lag is <3 % and is essentially at the same level as that with full resolution readout. This is consistent with the second lag mechanism being dominant. From Fig. 8 we can conclude that the xb modes listed in Table 1, where a dark frame is acquired between subsequent exposures and used for offset correction, would not be beneficial to image quality because (1) the dark frame would overestimate the contribution of lag and result in an overcorrection and (2) the correction will double the electronic noise power in the final image and increase the degradation effect of electronic noise at the low exposures used in tomosynthesis. It has been shown in cone-beam CT that temporal image persistence on the order of ∼5 % will not result in significant image artifact.37, 38 Since the reconstructed images in tomosynthesis suffer from inaccuracy due to incomplete sampling,39 the effect of temporal artifact is expected to be less critical compared to CBCT. Possible strategies for minimizing the effect of lag would be to discard the dark frame acquired between x-ray frames and use the xb modes just to increase the time interval between two subsequent x-ray frames. However, this is at the cost of increased scan time and its associated risks of patient motion. Since the quality of reconstructed images is susceptible to artifact introduced by patient motion, to decrease the scan time becomes more important. Therefore, for patient imaging, the modes without additional dark frame acquisition are more desirable.
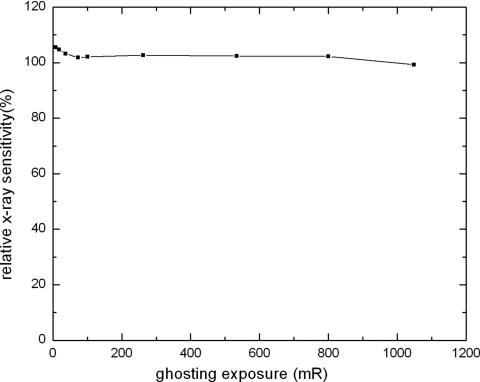
Figure 9 shows the results of ghosting measurements, where the normalized x-ray sensitivity is plotted as a function of ghosting dose. It shows that ghosting causes a slight increase in x-ray sensitivity for the dose range used in our investigation. The sensitivity increases by 4% after a single exposure of 10.0 mR. This means that the first mechanism for ghosting (Sec. 2E), i.e., change in x ray to charge conversion gain as a result of trapped electrons in the bulk, was dominant. This observation was consistent with our previous investigation using electroded a-Se samples (without TFT readout).32 The electrons captured in deep traps cause an increase in the electric field at the x-ray entrance side (positively biased) of the a-Se layer, where the majority of the x rays are absorbed due to the relatively low x-ray energy used in mammography. Therefore, the first ghosting mechanism leads to an increase in x-ray sensitivity. Part of the increase in sensitivity can also be due to charge trapping between pixel electrodes,31 which causes an increase in effective fill-factor.
Figure 9.
Ghosting measurement, quantified as sensitivity at reference exposure as a function of ghosting exposure.
Also shown in Fig. 9 is that as the ghosting dose increases, the relative x-ray sensitivity decreases. The relative sensitivity decreases to 99% after a ghosting exposure of 1 R. This indicates that the second mechanism, i.e., the recombination of trapped electrons with free holes, becomes more significant with increase in dose and eventually dominates ghosting. It should be noted that trapped charge due to irradiation cannot be cleared between tomosynthesis views, hence the maximum ghosting dose that is relevant to tomosynthesis is the total raw exposure to detector during the entire scan. Between subsequent tomosynthesis scans, the trapped charge can be cleared in the same fashion as that used in regular mammography. Previous ghosting measurements of a-Se detectors showed that with ghosting clearance procedures between subsequent exposures, the change in x-ray sensitivity is ∼0.2 % with ghosting dose of >3 R.36, 40
CONCLUSIONS
The imaging performance of an a-Se flat-panel detector in a prototype breast tomosynthesis system was fully characterized. The spatial frequency dependent metrics depend on both the inherent properties of the a-Se detector and the imaging geometry. It was found that for view numbers of 25 or above, the dominant source of blur is pixel aperture function. For fewer views with faster gantry travel, the blur due to focal spot motion becomes dominant. The detector performance is essentially x-ray quantum noise limited down to an exposure level of 0.4 mR. The temporal performance of the detector was quantified for the frame rates and exposure range expected for tomosynthesis and was expected not to degrade the reconstructed image quality.
ACKNOWLEDGMENTS
The authors gratefully acknowledge financial support from the NIH (Grant No. 1 R01 EB002655), the U.S. Army Breast Cancer Research Program (Grant No. W81XWH-04-1-0554), and Siemens AG. The authors thank J. A. Segui, D. Li, and Y. Hu for assistance with the experiments and A. R. Lubinsky for proofreading the manuscript. The authors also thank P. Warmoes from Anrad Corp. and Dr. T. Mertelmeier and Dr. J. Ludwig from Siemens AG for helpful discussions.
References
- Niklason L. T. et al. , “Digital tomosynthesis in breast imaging,” Radiology 205, 399–406 (1997). [DOI] [PubMed] [Google Scholar]
- Dobbins J. T. and Godfrey D. J., “Digital x-ray tomosynthesis: Current state of the art and clinical potential,” Phys. Med. Biol. 10.1088/0031-9155/48/19/R01 48, R65–R106 (2003). [DOI] [PubMed] [Google Scholar]
- Wu T. et al. , “A comparison of reconstruction algorithms for breast tomosynthesis,” Med. Phys. 10.1118/1.1786692 31, 2636–2647 (2004). [DOI] [PubMed] [Google Scholar]
- Smith A., “Full-field breast tomosynthesis,” Radiol. Manage. 27, 25–31 (2005). [PubMed] [Google Scholar]
- Chen Y., Lo J. Y., and J. T.DobbinsIII, “Impulse response analysis for several digital tomosynthesis mammography reconstruction algorithms,” Proc. SPIE 10.1117/12.595684 5745, 541–549 (2005). [DOI] [Google Scholar]
- Suryanarayanan S. et al. , “Evaluation of linear and nonlinear tomosynthetic reconstruction methods in digital mammography,” Acad. Radiol. 8, 219–224 (2001). [DOI] [PubMed] [Google Scholar]
- Mertelmeier T., Orman J., Haerer W., and Dudam M. K., “Optimizing filtered backprojection reconstruction for a breast tomosynthesis prototype device,” Proc. SPIE 10.1117/12.651380 6142, 61420F (2006). [DOI] [Google Scholar]
- Ren B. et al. , “Design and performance of the prototype full field breast tomosynthesis system with selenium based flat panel detector,” Proc. SPIE 10.1117/12.595833 5745, 550–561 (2005). [DOI] [Google Scholar]
- Bissonnette M. et al. , “Digital breast tomosynthesis using an amorphous selenium flat panel detector,” Proc. SPIE 10.1117/12.601622 5745, 529–540 (2005). [DOI] [Google Scholar]
- Zhou J., Zhao B., and Zhao W., “A computer simulation platform for the optimization of a breast tomosynthesis system,” Med. Phys. 10.1118/1.2558160 34, 1098–1109 (2007). [DOI] [PubMed] [Google Scholar]
- Saunders J. R. S., Samei E., Jesneck J. L., and Lo J. Y., “Physical characterization of a prototype selenium-based full field digital mammography detector,” Med. Phys. 10.1118/1.1855033 32, 588–599 (2005). [DOI] [PubMed] [Google Scholar]
- Lazzari B. et al. , “Physical characteristics of a clinical prototype for full-field digital mamography with an a-Se flat-panel detector,” Proc. SPIE 10.1117/12.479989 5030, 656–666 (2003). [DOI] [Google Scholar]
- Jesneck J. L. et al. , “Detector evaluation of a prototype amorphous selenium-based full field digital mammography system,” Proc. SPIE 10.1117/12.596087 5745, 478–485 (2005). [DOI] [Google Scholar]
- Yorker J. G. et al. , “Characterization of a full-field digital mammography detector based on direct x-ray conversion in selenium,” Proc. SPIE 10.1117/12.465568 4682, 21–29 (2002). [DOI] [Google Scholar]
- Flynn M., Dodge C., Peck D., and Swinford A., “Optimal radiographic techniques for digital mammograms obtained with an amorphous selenium detector,” Proc. SPIE 10.1117/12.480486 5030, 147–156 (2003). [DOI] [Google Scholar]
- Zhao W., Deych R., and Dolazzab E., “Optimization of operational conditions for direct digital mammography detectors for digital tomosynthesis,” Proc. SPIE 10.1117/12.597301 5745, 1272–1281 (2005). [DOI] [Google Scholar]
- Fujita H., Tsai D., Itoh T., Doi K., Morishata J., Uedo K., and Ohtsuka A., “A simple method for determining the modulation transfer function in digital radiography,” IEEE Trans. Med. Imaging 10.1109/42.126908 11, 34–39 (1992). [DOI] [PubMed] [Google Scholar]
- Zhao W. and Rowlands J. A., “Digital radiology using active matrix readout of amorphous selenium: Theoretical analysis of detective quantum efficiency,” Med. Phys. 10.1118/1.598097 24, 1819–1833 (1997). [DOI] [PubMed] [Google Scholar]
- Mainprize J. G. et al. , “Resolution at oblique incidence angles of a flat panel imager for breast tomosynthesis,” Med. Phys. 10.1118/1.2241994 33, 3159–3164 (2006). [DOI] [PubMed] [Google Scholar]
- Hajdok G. et al. , “Signal and noise transfer properties of photoelectric interactions in diagnostic x-ray imaging detectors,” Med. Phys. 10.1118/1.2336507 33, 3601–3620 (2006). [DOI] [PubMed] [Google Scholar]
- Que W. and Rowlands J. A., “X-ray imaging using amorphous selenium: Inherent spatial resolution,” Med. Phys. 10.1118/1.597471 22, 365–374 (1995). [DOI] [PubMed] [Google Scholar]
- Samei E., Flynn M. J., and Reimann D. A., “A method for measuring the presampled MTF of digital radiographic systems using an edge test device,” Med. Phys. 10.1118/1.598165 25, 102–113 (1998). [DOI] [PubMed] [Google Scholar]
- Carton A. -K. et al. , “Validation of MTF measurement for digital mammography quality control,” Med. Phys. 10.1118/1.1921667 32, 1684–1695 (2005). [DOI] [PubMed] [Google Scholar]
- Maidment A. D. A. and Albert M., “Conditioning data for calculation of the modulation transfer function,” Med. Phys. 10.1118/1.1534111 30, 248–253 (2003). [DOI] [PubMed] [Google Scholar]
- J. T.DobbinsIII et al. , “DQE(f) of four generations of computed radiography acquisition devices,” Med. Phys. 10.1118/1.597627 22, 1581–1593 (1995). [DOI] [PubMed] [Google Scholar]
- Dainty J. C. and Shaw R., Image Science, Principle, Analysis and Evaluation of Photographic-type Imaging Processing (Academic, New York, 1974). [Google Scholar]
- Boone J., “Spectral modeling and compilation of quantum fluence in radiography and mammography,” Proc. SPIE 10.1117/12.317063 3336, 592–601 (1998). [DOI] [Google Scholar]
- Boone J. M., Fewell T. R., and Jennings R. J., “Molybdenum, rhodium, and tungsten anode spectral models using interpolating polynomials with application to mammography,” Med. Phys. 10.1118/1.598100 24, 1863 (1997). [DOI] [PubMed] [Google Scholar]
- Bloomquist A. K. et al. , “Quality control for digital mammography in the ACRIN DMIST trial: Part I,” Med. Phys. 10.1118/1.2163407 33, 719–736 (2006). [DOI] [PubMed] [Google Scholar]
- Rafferty E. A., “Digital mammography: novel applications,” Radiol. Clin. North Am. 10.1016/j.rcl.2007.06.005 45, 831–843 (2007). [DOI] [PubMed] [Google Scholar]
- Zhao W., DeCrescenzo G., and Rowlands J. A., “Investigation of lag and ghosting in amorphous selenium flat-panel x-ray detectors,” Proc. SPIE 10.1117/12.465557 4682, 9–19 (2002). [DOI] [Google Scholar]
- Zhao B. and Zhao W., “Temporal performance of amorphous selenium mammography detectors,” Med. Phys. 10.1118/1.1827791 32, 128–136 (2005). [DOI] [PubMed] [Google Scholar]
- Zhao W. et al. , “Ghosting caused by bulk charge trapping in direct conversion flat-panel detectors using amorphous selenium,” Med. Phys. 10.1118/1.1843353 32, 488–500 (2005). [DOI] [PubMed] [Google Scholar]
- Pang G., Zhao W., and Rowlands J. A., “Digital radiology using active matrix readout of amorphous selenium: Geometrical and effective fill factors,” Med. Phys. 10.1118/1.598344 25, 1636–1646 (1998). [DOI] [PubMed] [Google Scholar]
- Weisfield R. L. and Bennett N. R., “Electronic noise analysis of a 127-mu m pixel TFT/photodiode array,” Proc. SPIE 10.1117/12.430955 4320, 209–218 (2001). [DOI] [Google Scholar]
- Zhao B. and Zhao W., “Characterization of a direct full-field flat-panel digital mammography detector,” Proc. SPIE 10.1117/12.480388 5030, 157–167 (2003). [DOI] [Google Scholar]
- Siewerdsen J. H. and Jaffray D. A., “A ghost story: Spatio-temporal response characteristics of an indirect-detection flat-panel imager,” Med. Phys. 10.1118/1.598657 26, 1624–1641 (1999). [DOI] [PubMed] [Google Scholar]
- Siewerdsen J. H. and Jaffray D. A., “Cone-beam computed tomography with a flat-panel imager: Effects of image lag,” Med. Phys. 10.1118/1.598803 26, 2635–2647 (1999). [DOI] [PubMed] [Google Scholar]
- Wu T., Moore R. H., and Kopans D. B., “Voting strategy for artifact reduction in digital breast tomosynthesis,” Med. Phys. 10.1118/1.2207127 33, 2461–2471 (2006). [DOI] [PubMed] [Google Scholar]
- Loustauneau V. et al. , “Imaging performance of a clinical selenium flat-panel detector for advanced applications in full-field digital mammography,” Proc. SPIE 10.1117/12.484075 5030, 1010–1020 (2003). [DOI] [Google Scholar]


