Abstract
Acoustic radiation force impulse imaging is an elastography method developed for ultrasound imaging that maps displacements produced by focused ultrasound pulses systematically applied to different locations. The resulting images are “stiffness weighted” and yield information about local mechanical tissue properties. Here, the feasibility of magnetic resonance acoustic radiation force imaging (MR-ARFI) was tested. Quasistatic MR elastography was used to measure focal displacements using a one-dimensional MRI pulse sequence. A 1.63 or 1.5 MHz transducer supplied ultrasound pulses which were triggered by the magnetic resonance imaging hardware to occur before a displacement-encoding gradient. Displacements in and around the focus were mapped in a tissue-mimicking phantom and in an ex vivo bovine kidney. They were readily observed and increased linearly with acoustic power in the phantom (R2=0.99). At higher acoustic power levels, the displacement substantially increased and was associated with irreversible changes in the phantom. At these levels, transverse displacement components could also be detected. Displacements in the kidney were also observed and increased after thermal ablation. While the measurements need validation, the authors have demonstrated the feasibility of detecting small displacements induced by low-power ultrasound pulses using an efficient magnetic resonance imaging pulse sequence that is compatible with tracking of a dynamically steered ultrasound focal spot, and that the displacement increases with acoustic power. MR-ARFI has potential for elastography or to guide ultrasound therapies that use low-power pulsed ultrasound exposures, such as drug delivery.
Keywords: elastography, MRI, ultrasound, therapeutic ultrasound, drug delivery
INTRODUCTION
Elastography and sonoelasticity techniques using ultrasound and magnetic resonance imaging (MRI) methods have shown promise in characterizing tissue.1, 2, 3, 4, 5, 6, 7 These techniques exploit differences in mechanical tissue properties between normal and diseased tissues. Standard elastography methods measure tissue motion or displacement resulting from compression or vibration produced by a plate or other device acting at the tissue surface. These measurements are achieved using Doppler or cross-correlation techniques in ultrasound imaging and motion-encoding or displacement-encoding gradients in MRI. Making certain assumptions about the tissue properties and the boundary conditions, one can use this displacement information to create maps of different tissue properties, such as the Young’s modulus.
A number of researchers have investigated alternative elastography approaches that employ one or more focused ultrasound beams to provide a local source of tissue displacement.8, 9, 10, 11, 12, 13, 14, 15, 16, 17 These methods take advantage of radiation force that produces a displacement at the focus on the order of a few microns. This local displacement in the longitudinal direction or the shear waves that propagate radially away from the focus as the tissue is pushed can then be mapped and related to mechanical tissue properties. The use of local displacement have some advantages over standard elastography methods, such as being able to produce larger displacements at deep tissue locations and reducing the effects of distant tissue boundaries.
One relatively straightforward use of focused ultrasound as a source of local displacement is so-called acoustic radiation force impulse (ARFI) imaging.10, 11 In this method, the longitudinal tissue displacement at the ultrasound focus is measured using cross-correlation methods with ultrasound imaging. By systematically steering the focal zone to different points in the tissue, which can be done in near real time using the imaging probe itself as the focused ultrasound source, maps can be made of the local tissue displacement. These displacement maps are “stiffness weighted” and are used to identify regions with different local mechanical tissue properties.
Being able to map the focal displacement during short ultrasound pulses has another potential use beyond elastography. A large number of researchers have investigated the use of ultrasound to enhance or facilitate the targeted delivery of drugs and genes.18, 19 One issue that has not received much attention to date for these applications is how to monitor and guide these procedures. Significant effort has gone into developing MRI methods to monitor focused ultrasound for thermal therapies,20 and these methods could be used in some situations to monitor drug or gene delivery if the exposures heat the tissue.21, 22 However, it is more common that the pulsed exposures (sonications) barely heat the tissue or do not produce any measurable heating at all. Mapping the displacement during pulsed ultrasound using ARFI may provide a means to localize the focal point and perhaps evaluate whether sufficient energy is being delivered to the tissue. There are currently no available means for such localization or monitoring for such ultrasound pulses. We are interested in particular in developing a method to monitor nonthermal ultrasound therapies in the brain,23, 24 where ultrasound imaging-based methods may be difficult to due the high frequencies used in ultrasound imaging and the presence of the skull. Such therapies in the brain can be applied at low frequencies suitable for transcranial sonication.24
The purpose of this study was therefore to develop a MRI-based method similar to ultrasound imaging-based ARFI imaging that can be used to create displacement maps resulting from ultrasound pulses applied dynamically to different tissue locations via an electronically steered focal point. As measurements at many focal locations will be necessary, a method is required that can acquire data efficiently—ideally with one displacement measurement per magnetic resonance (MR) wave form acquisition. In addition, since only single ultrasound pulses may be applied at each tissue location, approaches that depend on multiple acquisitions acquired during cyclic tissue motion to estimate the displacement6 are not appropriate for this goal. In this study, feasibility experiments were performed in tissue mimicking phantoms and in ex vivo tissue samples to demonstrate that small focal displacements induced by low-power ultrasound pulses can be detected and related to the ultrasound parameters.
METHODS
MR-ARFI
The approach used, magnetic resonance acoustic radiation force imaging (MR-ARFI), utilizes several components and concepts that have been described previously: ARFI imaging,10, 11 quasistatic MR elastography (MRE) measurements,25 and a line scan MRI pulse sequence originally developed for diffusion imaging.26 It differs from most previous MRI investigations that have mapped displacements induced focused ultrasound pulses9, 16, 17, 27 in that the pulses are applied so that the tissue or phantom material at the focus is presumed to be stationary during the encoding gradients instead of assuming cyclic motion, and it only requires one ultrasound pulse for each acquisition instead of multiple pulses applied with different delays with respect to the encoding gradients. Essentially, it uses the localized radiation force at the ultrasound beam’s focus as a source for the quasistatic displacements in a one-dimensional version of the MR elastography technique proposed by Plewes et al.,25 while others9, 16, 17, 27 have used this radiation force as a localized shear wave source for the dynamic MRE approach described by Muthupillai et al.6 MR-ARFI differs from ultrasound imaging-based ARFI imaging methods in that it measures the steady-state displacement at the end of a relatively long ultrasound pulse instead of the peak displacement occurring during a short ultrasound pulse. Based on previous experimental and simulation studies, we expect that several milliseconds (ms) are needed for the tissue to reach its maximal displacement (saturation), depending on the tissue properties.10, 11, 28
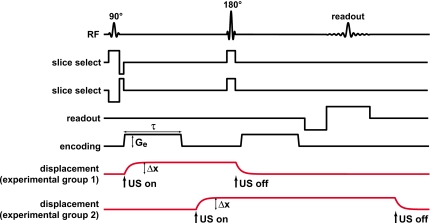
Figure 1 diagrams the MR pulse sequence used and the assumed tissue displacement profile as a function of time at the focus due to the ultrasound pulse. A line scan sequence was selected so that one displacement measurement was acquired with each MR wave form. Such single-shot data acquisition may also be possible using a more standard two-dimensional MR acquisition instead of a line scan implementation. However, due to the sequential single-shot acquisition of columns of data with single spin echoes, line scan provides certain advantages over other techniques that use two-dimensional single-shot Fourier encoding and∕or gradient echoes. In particular, susceptibility artifacts and motion artifacts are inherently reduced with a line scan. Moreover, ghosting artifacts due to irregular motion during a scan are completely absent due to the single-shot nature of the sequence.
Figure 1.
(a) MRI pulse sequence diagram and assumed displacement of the phantom or tissue at the focus for the different experimental groups. For the first group of experiments, a 42 ms ultrasound pulse began concurrently with the first displacement-encoding gradient and ended immediately after the second slice select gradient. In the second group, the second encoding gradient was used to encode the displacement. This scheme avoided error caused by motion during the encoding gradients but required a longer (75 ms) ultrasound pulse. Assuming that the displacement at the focus due to radiation force was static during the encoding gradients, the phase difference of the MR signal between two acquisitions with opposite encoding polarities was simply proportional to the focal displacement induced by radiation force (Δx) multiplied by the displacement-encoding gradient strength (Ge) and the duration (τ). (U.S.: ultrasound.)
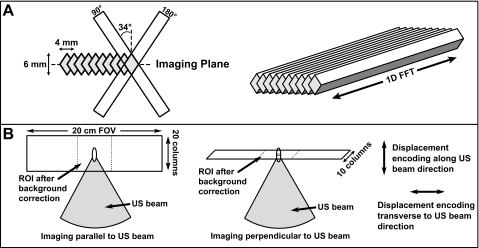
The sequence uses a 90°–180° pair of radio frequency (RF) pulses to select two slices inclined by approximately 34° from the normal of the plane to be imaged (Fig. 2). A spin echo from the column defined by the intersection of the slices occurs at the TE of the sequence. A frequency encoding gradient was applied along the column direction during readout, producing a one-dimensional array of data with each acquisition. Multiple columns were acquired in succession in to produce a two-dimensional image. The columns were inclined with respect to the normal of the image plane so that the slice-select gradients did not saturate the other columns that were to be imaged. The particular angle employed (approximately 34°) was determined by the particular voxel dimensions tested.
Figure 2.
Line scan acquisition. (a) Two slice select gradients were applied to select a column. Applying a gradient along the column direction during readout resulted in a one-dimensional array of data with each acquisition. To avoid saturation of neighboring regions by the slice-select gradients, their orientation was rotated approximately 34 ° with respect to the normal to the imaging plane. This particular angle was selected based on the geometry of the columns. As implemented, approximately 75% of the signal arises from a 3×2 mm region in the center of each column. Two-dimensional images were created by tiling these columns into a plane. (b) The orientation of the imaging plane and the direction of the displacement encoding could be selected by the user. Separate tests were performed with them either parallel or perpendicular to the direction of the ultrasound beam. In all tests, the columns were oriented perpendicular to the ultrasound beam direction. (U.S.: ultrasound.)
Displacement-encoding gradients were applied between the 90° and 180° RF pulses and between the 180° RF pulse and the signal readout. For these experiments, the encoding gradient strength (Ge) was 28 mT∕m and its length (τ) was 23 ms. The time between the start of the two encoding gradients was 44 ms. Subtraction of two acquisitions was necessary to remove background phase variations caused by magnetic field inhomogeneities. It also subtracted off any phase error resulting from displacement which was present during a slice select gradient. These two acquisitions were obtained with encoding gradients applied with opposite polarity to double the sensitivity to displacement. Assuming that the tissue was static during the encoding gradients, the displacement (Δx) could be estimated from the phase difference between these two acquisitions (Δϕ) with the following simple relationship:25
where γ is the gyromagnetic ratio (γ∕2π=42.58 MHz∕T). With the Ge and τ values used, the sensitivity of the sequence was 3 μm∕rad. The above expression assumes rectangular gradients. Trapezoidal gradients were used, but given their fast rise time (0.37 ms as implemented here), this assumption would result in negligible error.
Two sets of experiments were performed. In experimental group 1, the first encoding gradient was used to encode the displacement at the focus. Here, each 42 ms ultrasound pulse was applied approximately concurrently with the beginning of the first encoding gradient and ended immediately before the second. For these experiments, some error was introduced to the displacement estimates using the simple relation above because the tissue or phantom material at the focus was moving during the start of each encoding gradient. After analyzing the results from that study, the experiments were repeated with a scheme designed to avoid this error but that required longer ultrasound pulses. In those experiments the second encoding gradient was used to encode the displacement by delaying the ultrasound pulse so that it started between the two encoding gradients. The tissue or phantom material had approximately 17 ms to reach its maximum displacement before the encoding occurred. A longer ultrasound pulse duration of 75 ms was used to maintain this maximum displacement until the end of the sequence.
During each experiment, the ultrasound transducer remained at one location and 10 or 20 lines were acquired to generate maps of the displaced region at and around the focal spot induced by the pulsed sonications. The time between two acquisitions of a particular line (the TR of the sequence) was 1000 or 2000 ms for cases when 10 or 20 lines were acquired, respectively. This long TR was selected to reduce T1 weighting to maximize the signal-to-noise ratio. A relatively long TE of 87 ms was also selected to have a long encoding gradient that minimized the effects of any residual motion that may have occurred during the beginning of the encoding gradients. The time between acquisitions of the different lines was 253 ms when 10 lines were acquired and 267 ms when 20 lines were acquired. Additional image parameters included: slice thickness: 3mm, frequency encode matrix: 256 over a 20 cm field of view in the line direction, voxel dimension (slice×column width×frequency encode direction):3×2×0.8 mm, bandwidth: ±3.9 kHz. Five data pairs were acquired (five with positive encoding, five with negative encoding). During each acquisition, the sequence acquires two sets of data. In experimental group 1, the default performance of the sequence was used where the second acquisition had no encoding gradients, and these data were not used. In experimental group 2, encoding was employed during the second acquisition, thereby doubling the number of signal averages without increasing the total scan time. The signal averages were acquired by performing all of the acquisitions with positive encoding directions and then all of the acquisitions with negative encoding.
The MRI was programmed to reconstruct magnitude, real, and imaginary images, which were used with a complex image subtraction20 to create the phase-difference images. Artifacts in the phase-difference images (see below) were removed by fitting regions in each line where no displacement occurred on either side of the displaced region to polynomials of different orders ranging from 1 to 3. The order that had the minimum error was selected. A line extrapolated into the displaced region based on this fit was then subtracted off. The use of polynomials of different orders was inspired by previous work that utilized MRI phase-difference data in different contexts.29, 30 Note that our correction scheme was not explicitly validated, other than confirming that when no ultrasound was applied that no apparent displacement was detected and confirming that the displacement profiles appeared symmetric about the ultrasound beam direction.
Experimental apparatus
The focused ultrasound beam was generated by a spherically curved, air-backed transducer. In experimental group 1, a 16 element phased-array transducer (diameter∕radius of curvature: 10∕8 cm; frequency: 1.63 MHz) driven by a multichannel amplifier system31 (both constructed in-house) was used. Except where noted, the individual elements of the transducer were driven in phase, so it produced an ultrasound field of a single-element transducer. Due to logistical considerations, it was not possible to test the scheme used in experimental group 2 with this device. Instead, a 1.5 MHz single channel transducer with the same geometry was used. It was driven by a function generator (model 396, Fluke, Everett, WA) and RF amplifier (model 240L, E and I, Rochester, NY). RF power was monitored using a power meter (Agilent, model E4419B, Santa Clara, CA) and dual directional coupler (model C5498–10, Werlatone, Brewster, NY).
The transducers were characterized in a water tank using methods described earlier.32 Briefly, their efficiencies were measured using a force balance (absorbing target attached to a digital scale (AE200, Mettler, Toledo, OH). Pressure measurements were performed with a calibrated membrane hydrophone (spot diameter 0.5 mm, GEC-Marconi Research Centre, Chelmsford, UK). Estimates of the pressure amplitude at higher power levels were extrapolated from low-power measurements. The acoustic power range used in experimental group 1 (0.36–28.8 W) corresponded to peak negative pressure amplitudes of 0.9–8.1 MPa in water. The range used in group two (0.34–11.0 W) corresponded to 1.8–10.2 MPa. The full width at half maximum focal width∕length in water were approximately 1.0∕4.6 mm for the 1.63 MHz transducer used in experimental group 1 and 1.0∕4.8 mm for the 1.5 MHz transducer used in group 2. These values were measured in scans of the acoustic intensity distribution that used a 0.075 mm diameter needle hydrophone (0.2 mm step size).
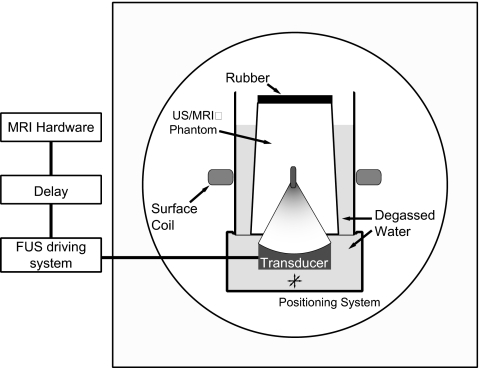
The transducer was attached to a manually operated MRI-compatible positioning system and was submerged in a tank of degassed water. At the top of this tank was mounted an acoustically transparent thin plastic membrane upon which another cylindrical water tank was placed. The bottom of this second tank was also a thin plastic membrane. A layer of degassed water between the two tanks ensured acoustic coupling. The phantom or tissue sample was placed in the second tank, and the whole apparatus was placed in a 1.5 T clinical MRI unit (GE Healthcare, Milwaukee, WI). An 18 cm diameter receive-only surface coil (GE Healthcare, Milwaukee, WI) was placed around the second tank at the focal depth of the transducer for image acquisition. Figure 3 shows a schematic of the experimental setup.
Figure 3.
Experimental setup.
The ultrasound amplifier system was triggered by the MRI hardware. The trigger occurred at the beginning of the first slice select gradient. The trigger for the ultrasound system was delayed using a function generator (model 395, Wavetek, San Diego, CA) so the ultrasound pulse began at the appropriate time in the MRI pulse sequence. One ultrasound pulse was acquired for every line acquisition (i.e., every 253 ms when 10 lines were acquired, 267 ms when 20 lines were acquired) resulting in a duty cycle of 16% or 17% for experimental group 1 and 28% or 30% for experimental group 2.
Sonications were performed in a silicone tissue mimicking phantom (RTV6166, General Electric Co., Waterford, NY). This material comes in two parts that produces different properties depending on the mix ratio. In these experiments, the A∕B components were mixed with a 30∕70 ratio, which yielded the following properties: density: 1100 kg∕m3, sound speed: 1050 m∕s: attenuation: 3.45 Np∕m/MHz, Young’s modulus: 15.3 kPa.33, 34 While this phantom provided mechanical tissue properties similar to tissue, note that its speed of sound differed significantly from water and tissue and resulted in the focal plane being shifted several centimeters (cm) deeper in the phantom than it would in water or tissue. The phantom was poured into a cylindrical cup (height, diameter: approximately 12, 10 cm). Rubber lined the bottom of the cup to avoid reflections.
Experiments and data analysis
The focal point was targeted at a depth of 5 cm into the phantom in experimental group 1, and 4 cm in experimental group 2. The displacement as a function of acoustic power was investigated in experiments consisting of 70 sonications in experiment group 1 with acoustic power ranging from 0.36 to 28.8 W and 72 sonications in experiment group two with acoustic power levels ranging from 0.34 to 11 W. Approximately half of the sonications were imaged in a plane parallel to the direction of the ultrasound beam propagation, with the others imaged perpendicular to this direction in the focal plane. Nine cases were also imaged in each experimental group with no ultrasound applied to measure the noise level in the images and to confirm that the correction scheme correctly removed background phase variations. In these experiments, the direction of the encoding gradients was oriented parallel to the direction of the ultrasound beam Additional experiments were performed to evaluate the transverse component of the displacement (28 sonications) and to investigate sonications performed using different phased array patterns (four sonications, experimental group 1 only). The phased array was cut in 16 pie-shaped elements.35 It operates in different “modes,” which produce multiple foci arranged in a ring distributed around the axis of the ultrasound beam. The diameter of the ring increases for larger modes; “mode 2” and “mode 4” sonication were tested. Head-to-head comparisons of the different pulsing schemes used in the two experimental groups were made with the equipment used in experimental group two.
Experiments were also performed in an ex vivo bovine kidney acquired at a grocery store and submerged in degassed water. Thirty sets of MR-ARFI data were acquired (acoustic power: 3 W) in ten locations in four samples to test the feasibility of visualizing and measuring displacements in tissue. In each location, the measurements were repeated before and after thermal ablation produced by high-power sonication. During these ablation sonications, the temperature rise was measured with MR thermometry.36 A peak temperature of at least 65 °C was reached in these sonications based on the thermometry and the kidney temperature, which was monitored with a thermocouple. The MR-ARFI measurements occurred after the tissue cooled back to its base line value.
The temperature rise that was produced by the MR-ARFI ultrasound pulses themselves was also estimated. For these estimations, the temperature rise as a function of time measured using MR thermometry during sonications applied with continuous wave exposures was scaled based on the time-averaged acoustic power used for the MR-ARFI pulses. Such scaling is appropriate for linear ultrasound propagation, and was justified here since nonlinear propagation did not contribute significantly to the temperature rise for the sharply focused transducers, ultrasonic frequencies, and acoustic intensities employed.37 The peak temperature rise as a function of time was measured in a 3×3 voxel region in the temperature maps centered at the focal point during the continuous-wave sonications. Such measurements were not possible in the silicone phantom since the proton resonant frequency of silicone is not temperature sensitive.
All data analysis was performed using MATLAB (version 7.0, The Mathworks, Natick, MA). Statistical analysis included calculations of means and standard deviations, least-squares linear regression and calculation of correlation coefficients. Comparison of the mean displacements before and after thermal ablation in kidney in a 7×3 voxel (5.4×6 mm) region of interest (ROI) centered on the focal region were made using a paired two-tailed student’s t test. This ROI was selected to cover the entire region where displacement was observed. The displacement measurements made in images acquired parallel to the direction of the ultrasound beam were compared to those made in images acquired perpendicular to this direction in the focal plane using an unpaired student’s t test.
RESULTS
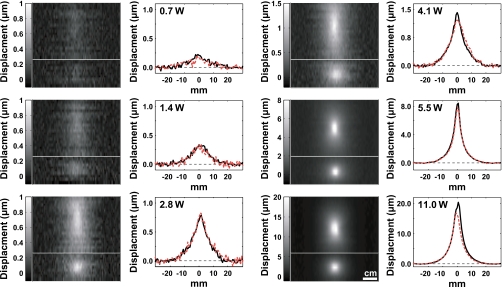
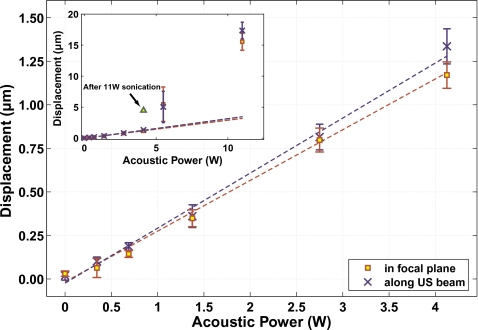
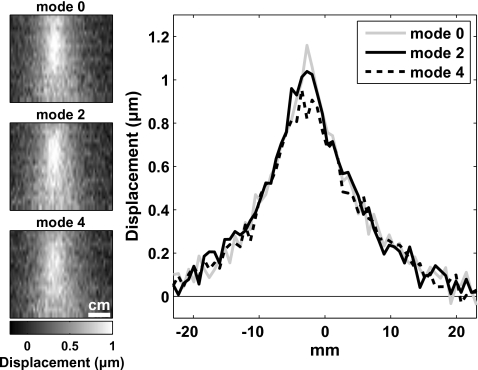
Focal displacements in the silicone phantom could be detected and quantified for all power levels tested for both experimental groups. Examples are shown in Fig. 4 from experimental group 2. The focal zone is observed as expected for exposures in a uniform medium: an elongated spot when imaging along the direction of the ultrasound beam (top images in Fig. 4), and a round spot when imaging perpendicular to this direction in the focal plane (bottom images in Fig. 4). Measurements made in the images acquired along these two directions were not significantly different from each other (P>0.05). For all but the two highest power levels tested in each experimental group, a linear dependence of the displacement as a function of the acoustic power was observed (Fig. 5). Regression of this data yielded slopes of 0.12±0.01 μm∕W and 0.31±0.01 μm∕W for experimental groups 1 and 2, respectively (R2=0.99 in both cases). For experimental group 1, there was a nonzero y intercept to this regression of 0.36±0.03 μm. This offset was not observed for group 2; the y intercept of the regression for this group was −0.05±0.03 μm. When the two pulsing schemes were compared head-to-head, the apparent displacements measured with the scheme used in experimental group two were 30% larger. Changing the phased array pattern had a small effect on the shape of the displaced region, and the higher modes produced only slightly less displacement (Fig. 6), even though the average peak intensity at the focus was reduced.
Figure 4.
MR-ARFI examples showing displacement at and around the focal spot in the silicone phantom during ultrasound pulses at different acoustic power levels from experimental group 2. Images and plots acquired along the direction of the ultrasound beam (solid lines) and perpendicular to it in the focal plane (dotted lines) are shown. The top image in each pair was oriented along the direction of the ultrasound beam. The bottom image in each pair was acquired perpendicular to this direction in the focal plane. The direction of the displacement-encoding gradients was parallel to the direction of the ultrasound beam. The average of three lines is shown in the plots.
Figure 5.
Measurements of the focal displacement as a function of the acoustic power during sonication in the silicone phantom from experimental group 2. At the five lowest powers tested, a linear dependence was observed. Inset: At the two highest powers tested, a large increase in displacement was observed, which was correlated with changes in the phantom that were seen after the experiments. Sonicating at 4.1 W after these higher power sonications yielded a larger displacement than previous sonications at this power. Dotted lines show linear regression of the data at the different imaging orientations (R2=0.99 for both).
Figure 6.
MR-ARFI during sonications in the phantom using different phased array patterns. With “mode 0,” all the phased array elements were in phase. In mode 2 and mode 4, multiple focal spots were produced in the shape of a ring around the axis of the ultrasound beam. At the higher modes, the distribution was less sharp and produced only slightly less displacement for the same acoustic power (5.7 W). The images are oriented parallel to the direction of the ultrasound beam. The displacement encoding is also in this direction. The average of three lines is shown in the plots.
The linearity of the displacement as a function of acoustic power broke down at higher power levels. A large increase in displacement was observed for the two highest power levels tested (see inset in Fig. 5). This increase was associated with visible changes in the phantom which were observed after the experiments. Sonicating at a lower power level after these changes were induced resulted in increased displacement.
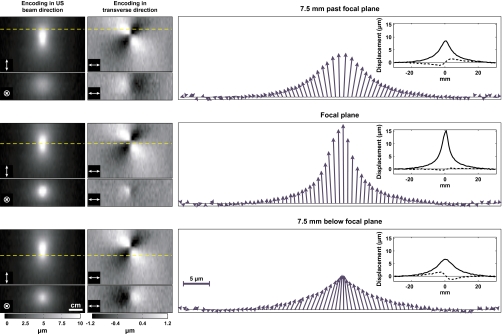
At these high acoustic power levels, small transverse displacements could also be detected by applying the encoding in a direction perpendicular to the direction of the ultrasound beam propagation (Fig. 7). Below the focal plane (closer to the transducer), this transverse displacement was directed inward toward the axis of the beam propagation. In regions more distant from the focal plane, it was directed away from this axis. The transverse component was small compared to the displacement along the direction of the beam. For example, the maximum measured transverse displacement was 2 μm in the cases in Fig. 7, only 13% of the maximum longitudinal displacement of 15.2 μm.
Figure 7.
MR-ARFI in the silicone phantom with the displacement encoding oriented in the direction of the ultrasound beam propagation and in a transverse direction for sonication at 29 W, from experimental group 1. Left: Images of the displacement with encoding in the different directions. The top images in each pair were oriented parallel to the beam direction; those at the bottom were perpendicular to this direction and at three different depths. The dotted lines indicate the depth location of the plane used in the plots on the right and in the images oriented perpendicular to the ultrasound beam direction. The direction of the encoding gradients is shown in the bottom left corner of each image. Right: Vectors showing the combined longitudinal and transverse displacement components at the three different depths. Below the focal plane, the transverse component was directed inward; behind the focal plane it was directed outward. The insets show the two data sets from which the vectors were created, with dotted lines plotted for the transverse component.
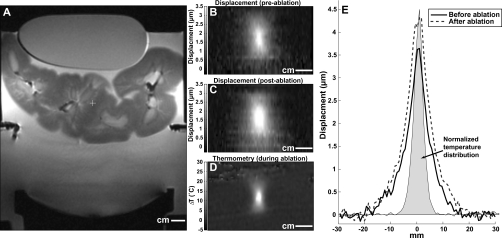
Displacements could also be mapped in the kidney samples. Examples acquired before and after focused ultrasound thermal ablation are shown in Fig. 8. After ablation, the displacement at the focus increased by a small amount. For experimental group 2, the mean displacement for the five sonications in the kidney sample before and after thermal ablation was 3.0±0.4 and 3.8±0.8 μm, respectively, a 27% increase which was statistically significant (P<0.01). A similar increase (1.7±0.4 versus 2.1±0.5 μm, P<0.05) was observed for sonications in experimental group 1. The shape of the region that was displaced by the preablation sonication was similar to the heating distribution, but the width of the region that was moved by the radiation force appeared to be wider than the zone that was heated. As was the case with the phantom experiments, the measurements in the kidney with imaging along the direction of the ultrasound beam were not significantly different (P<0.05) than those made perpendicular to this direction.
Figure 8.
MR-ARFI in an ex vivo kidney sample. (a) T2-weighted image showing the sample, and the transducer. An acoustically absorbent phantom was placed on top of the sample to hold it in place. (B) and (C) Maps of the displacement during two sonications applied before (b) and after (c) focused ultrasound thermal ablation. (D) MR temperature image acquired during ablation. (E) Plots showing displacement in the focal plane before and after ablation. The average of three lines is shown in this plot. The normalized spatial distribution of the temperature rise at peak temperature rise during ablation is also shown. The peak temperature rise achieved during this sonication was 31 °C.
The temperature rise at the focus for pulsing with the parameters used for MR-ARFI estimated by MR thermometry during continuous-wave sonications was approximately 0.2 °C for experimental group 1 and 0.5 °C for experimental group 2 after 5.3 s (the approximate time needed apply ultrasound pulses at one location with a repetition frequency of 3.7–4.0 Hz with 20 signal averages). These temperature values were on the order of the standard deviation in nonheated regions in the temperature maps (±0.50 °C) and were below 1 °C, which is considered to be the maximum safe temperature elevation for ultrasound imaging exposure.38, 39
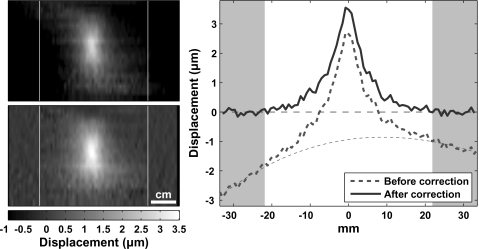
The artifact correction scheme worked well in both the phantom and in the tissue samples. An example of the phase difference before and after this correction is shown in Fig. 9. MR-ARFI acquired with no ultrasound showed no apparent displacement. The average standard deviation in regions of interest in these images was ±0.09 μm and ±0.07 μm for experimental groups 1 (five signal averages) and 2 (ten signal averages), respectively. In the kidney (with ten signal averages), this value was ±0.18 μm.
Figure 9.
Artifacts in the imaging. To remove the artifacts, in each line of the phase-difference images, regions to the left and right were selected where it was assumed that no displacement occurred. These regions were fit to polynomials of different orders. The order that produced the least error was then selected. Based on this fit, the artifact in the displaced segment was estimated and subtracted away. Left: MR-ARFI before (a) and after (b) artifact correction. (c) plots of the displacement at the focal depth before and after this correction. Dotted line indicates the fit of the data in the shaded regions and the extrapolation into the focal zone where displacement occurred. The image orientation is parallel to the direction of the ultrasound beam. The displacement encoding is also in this direction.
DISCUSSION
This work demonstrates the feasibility of visualizing small focal displacements induced during low-power ultrasound pulses in a tissue-mimicking phantom and in ex vivo tissue samples using an efficient acquisition that can be used to map rapidly the displacement at numerous tissue locations. It also showed that the estimated displacements were proportional to the applied acoustic power as expected for linear, plane-wave ultrasound propagation16, 40 and that in some situations the transverse component of the displacement can be mapped. This technique has potential uses for elastography and for guiding and monitoring therapies based on pulsed ultrasound exposures, such as targeted drug delivery.18, 19
These results are similar in some respects with those described by Wu et al., who used a focused ultrasound beam pulsed at a repetition rate of 50–300 Hz as a source for shear waves in experiments in phantoms and ex vivo tissue samples.16 They also observed a linear relationship between longitudinal displacement estimates at the focal spot and the acoustic power and could detect small displacements. However, their measurements used multiple acquisitions at different phase offsets between the ultrasound pulses and encoding gradients to estimate the focal displacement and required 128 repetitions to allow for phase encoding, although in later studies they have also investigated a one-dimensional acquisition.17, 27 Also, sinusoidal motion was assumed at the focus in those studies. This will not be the case and could lead to errors, as the displacement at the focus will increase initially for several ms and then perhaps saturate during the ultrasound pulse, followed by exponential decay afterwards.11 In contrast, with the approach used in MR-ARFI, the displacement at each point is sampled rapidly, and the only requirement necessary for accurate displacement measurements is that the encoding occurs after the tissue has reached the saturation point.
This approach was selected to allow for measurements similar to those employed in ultrasound imaging-based ARFI imaging and to track the focal coordinate and perhaps evaluate the energy deposition during ultrasound-based drug delivery. As implemented here, multiple lines were acquired with the ultrasound focus fixed at a single location, resulting in two-dimensional maps of the displacement at and around the focal spot. With a phased array transducer one could dynamically steer the focus to different locations, following the position of each line acquisition to systematically map the displacement at every desired point. With such an implementation, one could acquire the lines more rapidly while maintaining a safe time-averaged intensity at each focal spot, as the ultrasound pulse repetition frequency at any location would be drastically reduced. MRI-compatible focused ultrasound devices already exist in the clinic with capabilities that could be used for such acquisitions.41
To fully reach such a goal, the sequence should be further optimized to improve its sensitivity in order to avoid the need for signal averaging. Here, a heavily T2-weighted sequence was used which may have decreased the signal-to-noise ratio of the imaging and reduced the effectiveness of using such long encoding gradients. If a trigger for the ultrasound pulse were applied before each MR acquisition, the displacement at the focus could still reach saturation even with very short encoding times.
It would also be desirable to reduce or eliminate the phase artifacts that we observed in the imaging. The source of these artifacts is unknown, but could be related to vibration of the MRI unit and the experimental apparatus due to the rapidly switching gradients, or perhaps eddy currents. Indeed, ripples were evident on the surface of the water tank used in the experiments during encoding, suggesting the vibration produced by the MRI sequence may be significant. If it is related to vibration, using a velocity-compensated bipolar encoding gradients and modified ultrasound pulsing may be helpful in reducing the sensitivity to motion that is not synchronous with the encoding gradients. Such a strategy has been tested42 and appears to remove the artifacts, suggesting that such asynchronous vibration could be the source. These artifacts were the likely source for the small offsets evident between some of the lines that make up the displacement images in Fig. 4. Future work will need to be done to validate the displacement measurements and the correction scheme used to correct for background phase variations. The correction scheme may prove more difficult in more complex situations than the homogeneous phantom and tissue samples tested here. Another strategy to improve the overall sensitivity and reduce the need for signal averaging would be to enlarge the focal region to achieve a larger average displacement across the voxel to avoid partial volume effects, which likely occurred in this study. The effectiveness of such an approach is evident from the results with the phased array, which showed a similar displacement with a lower peak intensity when multiple foci were created. This was also evident from comparing experimental groups 1 and 2. The transducer used in experimental group 2 was more tightly focused than experimental group 1, probably because of flaws introduced when dicing the 1.63 MHz into a phased array. Because of these differences, only the two lowest power levels tested in the phantom group two would be within Food and Drug Administration guidelines for ultrasound imaging (mechanical index less than 1.9),38 while the four lowest power levels tested in group 1 would be within these limits. Alternative potential means to enlarge the focal volume would be to use lower frequency ultrasound or by changing the transducer geometry. Volume averaging may explain why our displacement measurements were somewhat lower than might be expected based on previous work done with ARFI imaging using ultrasound measurements.11, 43 In all cases, at least one voxel dimension was 2 or more times as large as the ultrasound beam width. However, since the displacement field will be larger than the ultrasound beam profile, this effect should be somewhat mitigated. Indeed, differences between measurements made in the different imaging orientations were not significant as one might expect because of volume averaging. Other reasons the measurements may be lower than might be expected could include our use of a lower ultrasound frequency than the previous studies or perhaps differences between measuring transient displacements (in ultrasound imaging-based ARFI imaging) and steady-state displacements (in MR-ARFI). During the initial push, the displacement may be larger due to the inertial response of the tissue in the focal zone. Here, the measurements were acquired after this response.
If the MRI pulse sequence or ultrasound application can be further optimized to increase the sensitivity of the sequence, it may be possible to measure the focal displacement of an individual ultrasound pulse by referencing the measurement to a prior one acquired without ultrasound. One may be able to use the method to ensure that a sufficient exposure level is achieved during ultrasound drug delivery by experimentally relating the displacement to the amount of drug delivered. This may be possible at least in normal tissue where one may expect the mechanical tissue properties to not vary widely. One may also be able to estimate the time constant that describes the tissue relaxation to its initial position after the completion of the ultrasound pulse. One could first acquire measurements of the peak displacement as was done here, and then acquire a second measurement using a short encoding time where the ultrasound pulse ends immediately before the start of the encoding gradient so that the tissue relaxation is encoded. Assuming exponential decay, one could potentially use these two measurements to estimate the decay rate. This could be advantageous as the relaxation rate would be independent of the tissue properties along the ultrasound beam path. Improved sensitivity may also allow use of measurements of the transverse components of the displacement. Here, that was only possible for the higher power levels tested where irreversible changes had occurred in our phantom. In some situations, however, such as perhaps for detecting small calcifications, they may be detectable at safe exposure levels. Such imaging may also be of interest in validating models of radiation force in different situations.
Another potential use of this method may also be for augmenting thermal imaging during ablation27, 44 or in evaluating tissue response afterwards.15, 45, 46 In our tests in the kidney, the estimated displacement was larger after thermal ablation. This was somewhat surprising, as one would expect from previous work that the displacement be smaller after coagulation since the tissue becomes stiffer after thermal coagulation.17, 46 It is possible that the entire lesion was being pushed by the ultrasound beam at the impedance mismatch at the bottom edge of the lesion. Indeed, others have shown an increase in displacement in some cases where small thermal lesions were produced using standard MR elastography techniques.17
This work is not the first to use focused ultrasound as a source for MRI-based elastography. In addition to the studies discussed above,16, 17, 27 Sinkus et al. recently presented preliminary data using an approach similar in many ways to MR-ARFI to guide high-power focused ultrasound thermal ablation.47 Also, in one of the first tests of MRI-based elastography, Sarvazyan et al. used focused ultrasound as a local source for shear waves, which were detected using a line scan sequence similar to that used in this work.9
In conclusion, an approach was tested that uses the localized radiation force produced by focused ultrasound pulses as a source for quasistatic displacements, which were measured using a one-dimensional version of an MRE technique described earlier.25 The method appeared sensitive to small (micron-scale) focal displacements in feasibility experiments in tissue-mimicking phantoms and ex vivo kidney samples. The displacement increased linearly with applied acoustic power in the phantoms, and irreversible changes in the phantom and thermal coagulation in the tissue samples resulted in an increased displacement. In some cases, transverse components of the displacement could also be detected.
ACKNOWLEDGMENTS
This work was supported by NIH Grant Nos. U41 RR019703 and R01 EB006867.
References
- Krouskop T. A., Dougherty D. R., and Vinson F. S., “A pulsed Doppler ultrasonic system for making noninvasive measurements of the mechanical properties of soft tissue,” J. Rehabil. Res. Dev. 10.1682/JRRD.1987.07.0001 24, 1–8 (1987). [DOI] [PubMed] [Google Scholar]
- Lerner R. M., Huang S. R., and Parker K. J., “‘Sonoelasticity’ images derived from ultrasound signals in mechanically vibrated tissues,” Ultrasound Med. Biol. 10.1016/0301-5629(90)90002-T 16, 231–239 (1990). [DOI] [PubMed] [Google Scholar]
- Ophir J., Cespedes I., Ponnekanti H., Yazdi Y., and Li X., “Elastography: A quantitative method for imaging the elasticity of biological tissues,” Ultrason. Imaging 10.1016/0161-7346(91)90079-W 13, 111–134 (1991). [DOI] [PubMed] [Google Scholar]
- Cespedes I., Ophir J., Ponnekanti H., and Maklad N., “Elastography: elasticity imaging using ultrasound with application to muscle and breast in vivo,” Ultrason. Imaging 10.1006/uimg.1993.1007 15, 73–88 (1993). [DOI] [PubMed] [Google Scholar]
- O’Donnell M., Skovoroda A. R., Shapo B. M., and Emelianov S. Y., “Internal displacement and strain imaging using ultrasonic speckle tracking,” IEEE Trans. Ultrason. Ferroelectr. Freq. Control 10.1109/58.285465 41, 314–325 (1994). [DOI] [Google Scholar]
- Muthupillai R., Lomas D. J., Rossman P. J., Greenleaf J. F., Manduca A., and Ehman R. L., “Magnetic resonance elastography by direct visualization of propagating acoustic strain waves,” Science 10.1126/science.7569924 269, 1854–1857 (1995). [DOI] [PubMed] [Google Scholar]
- Krouskop T. A., Wheeler T. M., Kallel F., Garra B. S., and Hall T., “Elastic moduli of breast and prostate tissues under compression,” Ultrason. Imaging 20, 260–274 (1998). [DOI] [PubMed] [Google Scholar]
- Sugimoto T., Ueha S., and Itoh K., “Tissue hardness measurement using the radiation force of focused ultrasound,” Proceedings of the Ultrasonics Symposium, 1990, pp. 1377–1380 (unpublished).
- Sarvazyan A. P., Rudenko O. V., Swanson S. D., Fowlkes J. B., and Emelianov S. Y., “Shear wave elasticity imaging: A new ultrasonic technology of medical diagnostics,” Ultrasound Med. Biol. 10.1016/S0301-5629(98)00110-0 24, 1419–1435 (1998). [DOI] [PubMed] [Google Scholar]
- Walker W. F., Fernandez F. J., and Negron L. A., “A method of imaging viscoelastic parameters with acoustic radiation force,” Phys. Med. Biol. 10.1088/0031-9155/45/6/303 45, 1437–1447 (2000). [DOI] [PubMed] [Google Scholar]
- Nightingale K. R., Palmeri M. L., Nightingale R. W., and Trahey G. E., “On the feasibility of remote palpation using acoustic radiation force,” J. Acoust. Soc. Am. 10.1121/1.1378344 110, 625–634 (2001). [DOI] [PubMed] [Google Scholar]
- Fatemi M. and Greenleaf J. F., “Ultrasound-stimulated vibro-acoustic spectrography,” Science 10.1126/science.280.5360.82 280, 82–85 (1998). [DOI] [PubMed] [Google Scholar]
- Bercoff J., Tanter M., and Fink M., “Supersonic shear imaging: a new technique for soft tissue elasticity mapping,” IEEE Trans. Ultrason. Ferroelectr. Freq. Control 10.1109/TUFFC.2004.1295425 51, 396–409 (2004). [DOI] [PubMed] [Google Scholar]
- Konofagou E. E. and Hynynen K., “Localized harmonic motion imaging: Theory, simulations and experiments,” Ultrasound Med. Biol. 10.1016/S0301-5629(03)00953-0 29, 1405–1413 (2003). [DOI] [PubMed] [Google Scholar]
- Lizzi F. L., Muratore R., Deng C. X., Ketterling J. A., Alam S. K., Mikaelian S., and Kalisz A., “Radiation-force technique to monitor lesions during ultrasonic therapy,” Ultrasound Med. Biol. 10.1016/S0301-5629(03)01052-4 29, 1593–1605 (2003). [DOI] [PubMed] [Google Scholar]
- Wu T., Felmlee J. P., Greenleaf J. F., Riederer S. J., and Ehman R. L., “MR imaging of shear waves generated by focused ultrasound,” Magn. Reson. Med. 43, 111–115 (2000). [DOI] [PubMed] [Google Scholar]
- Le Y., Glaser K., Romano A., Manduca A., Lai J., Roberts L. R., Primak S., Ehman R., and Felmlee J. P., “Study of shear wave displacement change measured by 1D MRE during focused ultrasound treatment: Preliminary study,” Proceedings of the 5th International Society on Therapeutic Ultrasound, 2005, pp. 186–190.
- Tachibana K. and Tachibana S., “The use of ultrasound for drug delivery,” Echocardiography 18, 323–328 (2001). [DOI] [PubMed] [Google Scholar]
- Mitragotri S., “Healing sound: the use of ultrasound in drug delivery and other therapeutic applications,” Nat. Rev. Drug Discov. 4, 255–260 (2005). [DOI] [PubMed] [Google Scholar]
- Chung A. H., Hynynen K., Colucci V., Oshio K., Cline H. E., and Jolesz F. A., “Optimization of spoiled gradient-echo phase imaging for in vivo localization of a focused ultrasound beam,” Magn. Reson. Med. 10.1002/mrm.1910360513 36, 745–752 (1996). [DOI] [PubMed] [Google Scholar]
- Madio D. P., van Gelderen P., DesPres D., Olson A. W., de Zwart J. A., Fawcett T. W., Holbrook N. J., Mandel M., and Moonen C. T., “On the feasibility of MRI-guided focused ultrasound for local induction of gene expression,” J. Magn. Reson. Imaging 8, 101–104 (1998). [DOI] [PubMed] [Google Scholar]
- Ponce A. M., Viglianti B. L., Yu D., Yarmolenko P. S., Michelich C. R., Woo J., Bally M. B., and Dewhirst M. W., “Magnetic resonance imaging of temperature-sensitive liposome release: Drug dose painting and antitumor effects,” J. Natl. Cancer Inst. 99, 53–63 (2007). [DOI] [PubMed] [Google Scholar]
- Alexandrov A. V., Molina C. A., Grotta J. C., Garami Z., Ford S. R., Alvarez-Sabin J., Montaner J., Saqqur M., Demchuk A. M., Moye L. A., Hill M. D., and Wojner A. W., “Ultrasound-enhanced systemic thrombolysis for acute ischemic stroke,” N. Engl. J. Med. 351, 2170–2178 (2004). [DOI] [PubMed] [Google Scholar]
- Hynynen K., McDannold N., Vykhodtseva N., Raymond S., Weissleder R., Jolesz F. A., and Sheikov N., “Focal disruption of the blood-brain barrier due to 260-kHz ultrasound bursts: a method for molecular imaging and targeted drug delivery,” J. Neurosurg. 105, 445–454 (2006). [DOI] [PubMed] [Google Scholar]
- Plewes D. B., Betty I., Urchuk S. N., and Soutar I., “Visualizing tissue compliance with MR imaging,” J. Magn. Reson. Imaging 5, 733–738 (1995). [DOI] [PubMed] [Google Scholar]
- Gudbjartsson H., Maier S. E., Mulkern R. V., Morocz I. A., Patz S., and Jolesz F. A., “Line scan diffusion imaging,” Magn. Reson. Med. 10.1002/mrm.1910360403 36, 509–519 (1996). [DOI] [PubMed] [Google Scholar]
- Yuan L., Glaser K. J., Rouviere O., Gorny K. R., Chen S., Manduca A., Ehman R. L., and Felmlee J. P., “Preliminary assessment of one-dimensional MR elastography for use in monitoring focused ultrasound therapy,” Phys. Med. Biol. 10.1088/0031-9155/52/19/012 52, 5909–5919 (2007). [DOI] [PubMed] [Google Scholar]
- Viola F. and Walker W. F., “Radiation force imaging of viscoelastic properties with reduced artifacts,” IEEE Trans. Ultrason. Ferroelectr. Freq. Control 50, 736–742 (2003). [DOI] [PubMed] [Google Scholar]
- Rieke V., Vigen K. K., Sommer G., Daniel B. L., Pauly J. M., and Butts K., “Referenceless PRF shift thermometry,” Magn. Reson. Med. 10.1002/mrm.20090 51, 1223–1231 (2004). [DOI] [PubMed] [Google Scholar]
- Bernstein M. A., Zhou X. J., Polzin J. A., King K. F., Ganin A., Pelc N. J., and Glover G. H., “Concomitant gradient terms in phase contrast MR: analysis and correction,” Magn. Reson. Med. 10.1002/mrm.1910390218 39, 300–308 (1998). [DOI] [PubMed] [Google Scholar]
- Daum D. R., Buchanan M. T., Fjield T., and Hynynen K., “Design and evaluation of a feedback based phased array system for ultrasound surgery,” IEEE Trans. Ultrason. Ferroelectr. Freq. Control 10.1109/58.660153 45, 431–438 (1998). [DOI] [PubMed] [Google Scholar]
- Hynynen K., Freund W. R., Cline H. E., Chung A. H., Watkins R. D., Vetro J. P., and Jolesz F. A., “A clinical, noninvasive, MR imaging-monitored ultrasound surgery method,” Radiographics 16, 185–195 (1996). [DOI] [PubMed] [Google Scholar]
- Ottensmeyer M., Ph.D. thesis∕dissertation, Massachusetts Institute of Technology, 2001. [Google Scholar]
- Thierman J., Ph.D. thesis∕dissertation, Massachusetts Institute of Technology, 2004. [Google Scholar]
- Cain C. A. and Umemura S. -I., “Concentric-ring and sector-vortex phased-array applicators for ultrasound hyperthermia,” IEEE Trans. Microwave Theory Tech. 10.1109/TMTT.1986.1133390 34, 542–551 (1986). [DOI] [Google Scholar]
- Ishihara Y., Calderon A., Watanabe H., Okamoto K., Suzuki Y., and Kuroda K., “A precise and fast temperature mapping using water proton chemical shift,” Magn. Reson. Med. 10.1002/mrm.1910340606 34, 814–823 (1995). [DOI] [PubMed] [Google Scholar]
- Hynynen K., “The role of nonlinear ultrasound propagation during hyperthermia treatments,” Med. Phys. 10.1118/1.596626 18, 1156–1163 (1991). [DOI] [PubMed] [Google Scholar]
- Center for Devices and Radiological Health 510(k) Guide for Measuring and Reporting Acoustic Output of Diagnostic Ultrasound Medical Devices (U.S. Department of Health and Human Services, Bethesda, MD, 1983, Rev. 1993, 1994). [Google Scholar]
- NCRP Report 113: Exposure Criteria for Medical Diagnostic Ultrasound: I. Criteria Based on Thermal Mechanisms (National Council on Radiation Protection and Measurements, Bethesda, MD, 1992). [Google Scholar]
- Torr G. R., “The acoustic radiation force,” Am. J. Phys. 10.1119/1.13625 52, 402–408 (1984). [DOI] [Google Scholar]
- Tempany C. M., Stewart E. A., McDannold N., Quade B. J., Jolesz F. A., and Hynynen K., “MR Imaging-guided focused ultrasound surgery of uterine leiomyomas: a feasibility study,” Radiology 10.1148/radiol.2271020395 226, 897–905 (2003). [DOI] [PubMed] [Google Scholar]
- Chen J., Watkins R., and Butts Pauly K., “MR acoustic radiation force imaging: comparison of encoding gradients,” Proceedings of the 16th Scientific Meeting, International Society for Magnetic Resonance in Medicine, Toronto, ON, 2008, p. 1240.
- Nightingale K., Soo M. S., Nightingale R., and Trahey G., “Acoustic radiation force impulse imaging: In vivo demonstration of clinical feasibility,” Ultrasound Med. Biol. 10.1016/S0301-5629(01)00499-9 28, 227–235 (2002). [DOI] [PubMed] [Google Scholar]
- Le Y., Glaser K., Rouviere O., Ehman R., and Felmlee J. P., “Feasibility of simultaneous temperature and tissue stiffness detection by MRE,” Magn. Reson. Med. 10.1002/mrm.20801 55, 700–705 (2006). [DOI] [PubMed] [Google Scholar]
- Stafford R. J., Kallel F., Price R. E., Cromeens D. M., Krouskop T. A., Hazle J. D., and Ophir J., “Elastographic imaging of thermal lesions in soft tissue: A preliminary study in vitro,” Ultrasound Med. Biol. 10.1016/S0301-5629(98)00099-4 24, 1449–1458 (1998). [DOI] [PubMed] [Google Scholar]
- Wu T., Felmlee J. P., Greenleaf J. F., Riederer S. J., and Ehman R. L., “Assessment of thermal tissue ablation with MR elastography,” Magn. Reson. Med. 45, 80–87 (2001). [DOI] [PubMed] [Google Scholar]
- Sinkus R., Tanter M., Aubry J. F., and Fink M., “Potential of 3-dimensional MR-elastography for monitoring of HIFU treatments,” IEEE Ultrasonics Symposium (Abstract book), 2006, p. 233.


