Abstract
The authors developed a transmission-dispersion model to estimate dispersion in blood sampling systems and to calculate dispersion-free input functions needed for kinetic analysis. Transport of molecules through catheters was considered in two parts: a central part with convective transmission of molecules and a stagnant layer that molecules may enter and leave. The authors measured dispersion caused by automatic and manual blood sampling using three PET tracers that distribute differently in blood (C15O, H215O, and 11C-methylglucose). For manual sampling, dispersion was negligible. For the automated sampling procedure, characteristic parameters were calibrated for each tracer, and subsequently used in calculating dispersion-free input functions following real bolus injections. This led to shapes of dispersion-free input functions Ci(t) that had sharper peaks than the measured Co(t), and the authors quantified the effect of correcting for dispersion before kinetic modeling. The transmission-dispersion model quantitatively takes apart effects of transmission and dispersion, it has transparent noise properties associated with each component, and it does not require deconvolution to calculate dispersion-free input functions. Once characteristic parameters are estimated, input functions can be corrected before applying kinetic models. This allows bias-free estimation of kinetic parameters such as blood flow.
Keywords: blood sampling, input function, dispersion, kinetic modeling, catheter
INTRODUCTION
Catheter dispersion introduces errors in the measurement of the rapid dynamics of blood time-activity curves and in the parameters estimated by subsequent kinetic modeling. After intravenous bolus injections, tracer concentration gradients in blood are high and rapidly varying. Blood time-activity curves (TAC) have a steep increase and decrease followed by a slower approach toward a quasi-steady level. During the early dynamic phase, tracer kinetic methods allow estimation of fast blood-tissue exchange parameters by use of dynamic PET∕SPECT data or multiple indicator dilution data. Quantitative kinetic analysis requires the tissue activity derived from the dynamic PET scan as well as accurate measurement of the tracer inlet TAC to the tissue (input function). When estimating the kinetic parameters, it is assumed that the measured input function and the true input function are identical. Any discrepancies between their shapes may bias the parameter estimates.
Input functions may be derived from dynamic PET data by image analysis,1, 2 but the accepted gold standard is invasive arterial blood sampling, which is anyway needed for radioligand studies requiring metabolite analysis. Arterial blood samples are taken either manually, or by automated blood sampling devices for discrete sampling,3 or continuous sampling.4, 5, 6 At our PET facility, experienced technicians can withdraw manual blood samples by syringes every 3–5 s correctly time stamped within 0.5–1.0 s. However, automated systems are preferred because of better reproducibility, higher time resolution, less workload, and less radiation burden to the staff. In either case, the invasive methods involve withdrawal of blood through a catheter. Therefore, the measured blood TACs will be distorted compared to the original blood TACs at the sampling site, and dispersion effects must be corrected to allow bias-free kinetic parameter estimation.
Measured blood TACs are dispersed and delayed due to several factors depending on the measurement procedure, e.g., inhomogeneous velocity fields and sticking to the external tubing of blood sampling devices. Therefore, a sharp tracer bolus in a blood vessel will be attenuated when arriving at the detector through the external tubing. Additionally, we may need correction for dispersion and delay effects occurring internally in blood vessels from the sampling site to the organ of interest. The importance of correcting delay and dispersion effects, e.g., when quantifying cerebral blood flow by labeled water H215O,7 have been acknowledged for some time: without correction for dispersion, estimates of cerebral blood flow are too high and depend on data acquisition time. A commonly used method describes dispersion by an implicit monoexponential deconvolution built into the kinetic model.8, 9 Various other models of catheter dispersion have been proposed,10, 11, 12, 13 but they share with the monoexponential model the difficulty of numerical deconvolution10, 14, 15 of the sampled data in order to remove catheter distortion and estimate the original time course of blood activity.
In the present article, we develop a transmission-dispersion model which combines convective transmission and dispersion of the activity profile in such a way that the original input function can be calculated from data without numerical deconvolution. We measured the dispersion of manual and automatic blood sampling as the response to known square functions using three different tracers, and we used the transmission-dispersion model to characterize of catheter dispersion. In addition, we show favorable features of the transmission-dispersion model: it quantitatively takes apart effects of transmission and dispersion, and it has transparent noise properties associated with each component. Finally, we use it to calculate dispersion-free input functions after in vivo bolus injections, and we demonstrate the importance of correcting for dispersion before kinetic modeling.
MATERIALS AND METHODS
Experimental setup
The study procedure was approved by the Danish National Ethics Committee for Animal Research. A 40-kg pig was anesthetized by injection of 20 mL of midazolam (Dormicum; Roche) (5 mg∕mL) and 12 mL of ketamine (Ketalar; Pfizer) (50 mg∕mL) followed by intravenous infusion of a mixture of midazolam (10 mL∕h), ketamine (10 mL∕h), and isotone saline (30 mL∕h). Every 4 h, the pig received an analgesic injection of 0.5-mg fentanyl. The pig was ventilated with air containing 40% oxygen using a Servo 900 respirator (Siemens-Elema). The pig was placed on its back, and a catheter was placed in the caval vein via the right femoral vein for infusions. A catheter was placed into the aorta via the right femoral artery for blood sampling. Oxygen saturation and pH in arterial blood samples were measured every hour and were adjusted toward >98% and 7.45, respectively, by changing the amount of air delivered from the respirator. The pig was covered and placed on a thermostatically controlled heat blanket set to keep the body temperature between 38.5 and 39.5 °C.
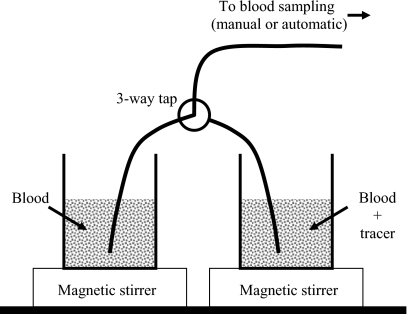
Before tracer administration, a large blood sample (50 mL) was withdrawn and put into a beaker placed on a magnetic stirrer. 1 min after tracer infusion, a second blood sample (50 mL) was withdrawn and put into another beaker placed on a magnetic stirrer. In this way, one beaker was filled with blood without tracer, and another beaker was filled with tracer naturally incorporated in blood. This was done for 500 MBq [15O]carbon monoxide C15O inhalation (N=4), 500 MBq [15O]water H215O i.v. injection (N=4), and 300 MBq [11C]methylglucose 11C-MG i.v. injection (N=2). The beakers were used to make a square step function as illustrated on Fig. 1. Square functions were realized by starting sampling from the tracer-free beaker; then quickly switching to the tracer beaker using the three-way tap; and finally around 90 s later, quickly switching back to the tracer-free beaker and continue sampling for 60 s. The switching procedure was fast and introduced no air bubbles in the catheters. The beakers with blood were open to air during the series of measurements, but this exposure to air did not lead to systematic effects over the time course of the experiments.
Figure 1.
Experimental setup. Two beakers of blood, one containing labeled tracer, are placed on magnetic stirrers. A small three-way tap allows quick shifts of blood sampling from one beaker to another. Blood was sampled simultaneously by manual withdrawal and by the automated sampler through two separate and identical lines (only one is shown). Catheter lengths were 380 mm from beaker up to the points of manual sampling or automatic detection.
For both manual and automated blood sampling, blood was withdrawn through a 1.65-mm inner diameter PVC tubing (S50-HL; Tygon), which was 380 mm long and included three-way tap. The two identical blood sampling lines had a total volume of 1 mL. Manual blood samples of each 1 mL were collected every 5 s for 3 min from the experimental setup (Fig. 1). Blood radioactivity concentrations were measured using a well counter (Packard Instruments Co.). Simultaneously, blood was sampled through a second parallel catheter (Fig. 1) using an automated blood sampler (Allogg AB). The automated blood sampler consists of a bismuth germinate detector attached to a photomultiplier tube in lead housing, a peristaltic pump, a waste unit, and a PC. The detector crystal is exposed to around 50-mm tube (0.1 mL). With the automated sampler, blood was withdrawn with a maximum flow of 7 mL∕min, and activity concentrations were measured every 0.5 s. All blood activity concentrations were decay corrected to the start of tracer administration. For each tracer injection, one square function was measured manually and three square functions were measured by automatic sampling. Catheters were flushed with isotonic saline between measurements to avoid clotting. Finally, in a separate experiment using only H215O, we measured a step function at three different flow settings: 3, 5, and 7 mL∕min.
Transmission-dispersion model
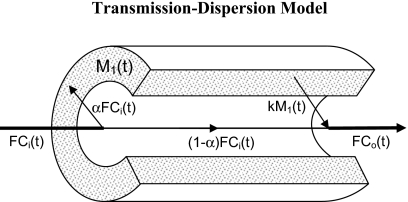
In terms of the transmission-dispersion model, a molecule that travels through a catheter may either undergo undisturbed convective transmission or it may interact with the catheter by sticking to the wall. Figure 2 illustrates the two ways of transport through a catheter: (a) a central part with convective transmission of molecules and (b) a peripheral stagnant layer that molecules may enter and leave. In terms of model parameters, a central fraction (1−α) is transmitted convectively through the catheter, and a fraction, α, is taken up by a stagnant layer compartment, M1(t), and released into the outflow, Co(t), according to a rate constant, k. Intuitively, α refers to the fraction of molecules that interacts with the catheter, and k refers to the stickiness of the catheter wall. The catheter flow is F, the catheter volume is V, and the central fraction (1−α) of molecules has a convective transit time through the catheter, T=(V−Vs)∕F, where the volume, Vs of the stagnant layer is negligible, Vs⪡V, so that T≈V∕F. For automated blood sampling devices, T is a known parameter estimated directly by using the dimensions of the catheter and the flow setting. For manual blood sampling, the catheter flow is usually high and T may be negligible.
Figure 2.
The transmission-dispersion model visualized on a cross section of a catheter. Blood concentrations entering and leaving the catheter are denoted Ci(t) and Co(t), respectively. The fraction α of tracer entering the catheter is taken up by a stagnant layer M1(t) on the inner surface of the catheter, and later released into the bloodstream at the rate k. The fraction (1−α) flows undisturbed through the catheter with convective flow F. For time delays, see text.
When the TAC at the catheter inlet is denoted by Ci(t), and activity in the stagnant layer compartment is denoted by M1(t),
| (1) |
Here and below a dot denotes differentiation with respect to time. The TAC at the catheter outlet Co(t) consists of a throughput and a release from the compartment
| (2) |
The throughput TAC and the release from the compartment are delayed by a transit time T compared to the inlet TAC. The delay in M1(t) ensures that convective transport of tracer is faster than the passage through the stagnant layer compartment as discussed by Goresky and Johnson.16 The model operates between two extremes: α=0 (pure dispersion-free convection) where the resulting outlet will be identical to the inlet except for a time delay equal to the transit time T; and α=1 (pure passage through the stagnant layer) where the resulting outlet will be equal to the washout from a compartment.
Equations 1, 2 describe the outlet TAC from the sampling catheter, Co(t), in terms of the inlet TAC to the catheter, Ci(t). By measuring the response Co(t) to known step functions in Ci(t), the characteristic parameters, α and k, of blood sampling devices can be calibrated by nonlinear regression to data. The required equations for a step function inlet are presented in Appendix A. Knowing the characteristic parameters, we are able to invert the problem. We want to calculate Ci(t) that we need for bias-free kinetic analysis of dynamic PET data. The operational equation, derived in Appendix B, is
| (3) |
The inversion leading to Eq. 3 is possible because of the convective throughput part (0≤α<1). In the absence of the throughput component (α=1), this solution fails and inversion would require numerical deconvolution.
Parameter estimation and statistical criterion
Model parameters were estimated, using a Levenberg–Marquardt method, by minimizing the weighted residual sum of squares (WRSS). Plots of weighted residuals against time were examined for systematic errors. Identifiability of the model parameters were examined using sensitivity functions
where Ci(t) is the model solution and p is the model parameter, i.e., α or k. Mathematical independence of the model parameters is demonstrated by the fact that no sensitivity function is proportional to or reciprocal of another. We use sensitivity functions that are individually scaled in order to emphasize the shapes and possible correlations. Consequently, our sensitivity plots allow easy evaluation of the time scale within which the parameters are identified, but evaluation of absolute sensitivities is obscured.
In comparisons of models, it is important to take into account that the best model fitted to the data is not necessarily the model producing the smallest WRSS. The addition of more parameters in general decreases the WRSS. We therefore identified the statistically favorable model on the basis of the Akaike information criterion (AIC) that included penalty functions proportional to the number of parameters in the model.17
RESULTS
Measurement of square functions
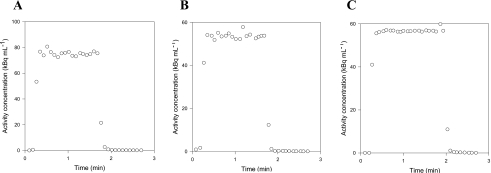
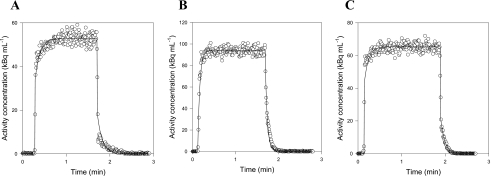
We characterize our blood sampling system by measuring its response, Co(t), to known square functions, Ci(t), generated by our experimental setup. Manual and automatic measurements were made with three tracers having different properties: C15O bound to the red blood cells, diffusible H215O, and 11C-MG that does not enter porcine red blood cells.31 For manual blood sampling, the measured responses to step functions are shown in Figs. 3a, 3b, 3c. For all tracers, the measurements differ from step functions by only two data points, one on the rising part and one on the falling part. As the sampling volume and the total catheter volume are similar, the two intermediate points may be a mixture of blood from the two beakers. Even a completely dispersion-free sampling system would measure such intermediate points. Thus, our manual 1-mL blood sampling procedure was not disturbed by catheter dispersion effects. In contrast, the detector of automated blood sampling system is exposed to radiation from a detection volume of only 0.1 mL during each measurement. With a catheter flow of 7 mL∕min, the blood in the detection volume is completely replaced every second. Thus, with automated measurements every 0.5 s, no more than two points on each edge of the measured response to a square can be contributed to a volume effect. Figures 4a, 4b, 4c show clear catheter dispersion effects that extend for numerous measurements. Thus, correction of catheter dispersion is necessary for the automated blood sampling system.
Figure 3.
Square functions measured by manual sampling: (a) C15O data, (b) H215O data, and (c) 11C-MG data. In all cases, only two points, i.e., one point on the rising edge and one point on the falling edge, differentiate the measurements from a square function.
Figure 4.
Examples of square function measured by automatic sampling and fitted using the transmission-dispersion model (white circles are measurements, lines are best fits): (a) C15O data, (b) H215O data, and (c) 11C-MG data.
Characteristic parameters for the automatic blood sampling system
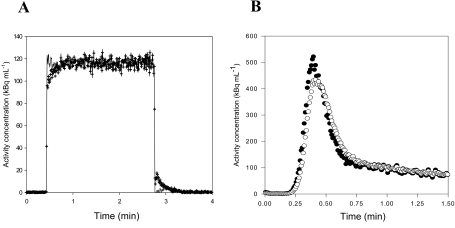
Step functions were fitted using the transmission-dispersion model. For each tracer, Figs. 4a, 4b, 4c show automatic measurements of square functions with the corresponding best fit of the transmission-dispersion model using Eq. A5. Fits made using a monoexponential model8, 9 were visually identical, and the models were equally good judged by the AIC values. Thus, the two models describe the measured dispersion equally well. It is for correction of dispersion that the benefit of using the transmission-dispersion model becomes evident, and input functions can be corrected for dispersion using Eq. 3 and the estimated characteristic parameters. Figure 5a shows an example of a measured square function and the dispersion-corrected measurements that recover the original square function. Figure 5b shows automated arterial blood sampling following in vivo bolus injection of 15H2O and the corresponding dispersion-corrected input function calculated using Eq. 3 and parameters from Table 1. The tracer, pump, and tubing arrangement used for the in vivo bolus injection experiments was identical to that used in the calibration experiments [Figs. 4a, 4b].
Figure 5.
Two examples of measured and dispersion-free blood TACs. (a) A measured square function (crosses) using the experimental setup in Fig. 1. The measurements are corrected for dispersion using the transmission-dispersion model (solid line), and the shape of the original square function is recovered. (b) Measured and dispersion-free blood TACs after an in vivo bolus injection of H215O [open circles are Co(t), closed circles are Ci(t)]. Data are shown up to 1 min where the effect of dispersion is most pronounced. The in vivo data were acquired for a project where we develop new models to estimate the hepatic perfusion (Ref. 31).
Table 1.
Parameter estimates and statistical criterion for automated blood sampling of three tracers using the transmission-dispersion model. Results are given as mean ± standard deviation (N=12 for C15O and H215O, and N=6 for 11C-MG).
| Parameter | [15O]carbon monoxide | [15O]water | [11C]methylglucose |
|---|---|---|---|
| k (min−1) | 10±5 | 17±5 | 15±7 |
| α (no unit) | 0.44±0.16 | 0.54±0.17 | 0.50±0.16 |
Model simulations
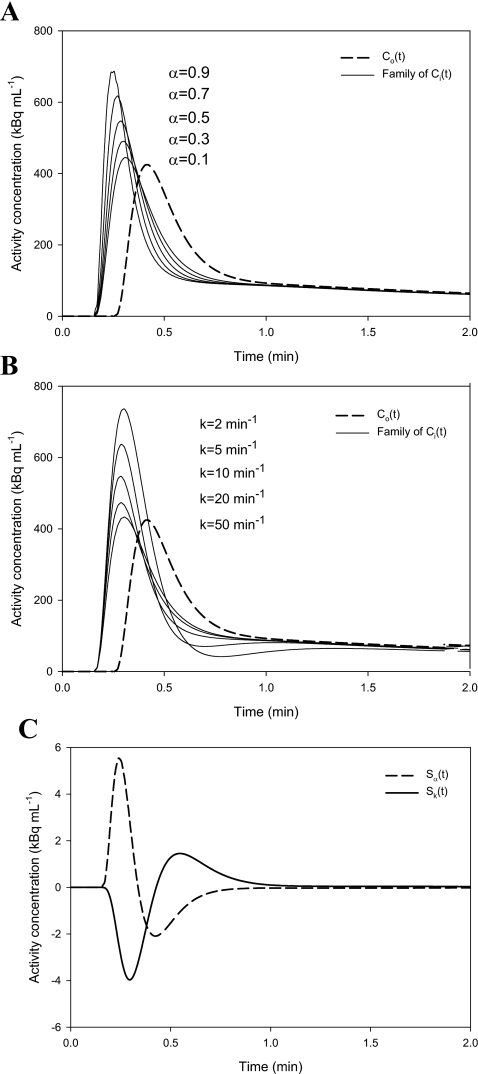
A realistic noise-free case of Co(t) was made by fitting a series of exponentials to an arterial blood TAC measured by our automatic blood sampler, and the noise-free Co(t) is used for simulations illustrating properties of the transmission-dispersion model. Sets of reasonable values of T, α, and k were chosen, and families of Ci(t) were generated parameterized by α and k. Figures 6a, 6b show the modulation of Ci(t) by α and k. The sensitivity plot [Fig. 6c] reveals some correlation between α and k, but both parameters can be fitted since they are sensitive at different time scales, e.g., the peak for Sk appears later and is broader than that for Sα. The correlation coefficient for the curves in Fig. 6c is −0.62, and the correlation between α and k is less pronounced for smaller k values, i.e., when substance is slowly released from the stagnant layer.
Figure 6.
Simulations illustrating Co(t) and the modulation of Ci(t) for reasonable values of T, k, and α. (a) Dashed line is a noise-free Co(t) and solid lines are a family of Ci(t)s parameterized by α: T=0.1 min, k=10 min−1, and α=[0.1,0.3,0.5,0.7,0.9]. Larger αs lead to more dynamic Ci(t)s. (b) Dashed line is a noise-free Co(t) and solid lines are a family of Ci(t) parameterized by k: T=0.1 min, k=[2.0,5.0,10.0,20.0,50.0] min−1, and α=0.5. Larger ks lead to less dynamic Ci(t)s. (c) Time course of scaled sensitivity functions: dashed line is Sα(t) and solid line is Sk(t) using T=0.1 min, k=10 min−1, and α=0.5.
Noise properties of dispersion-free blood TACs
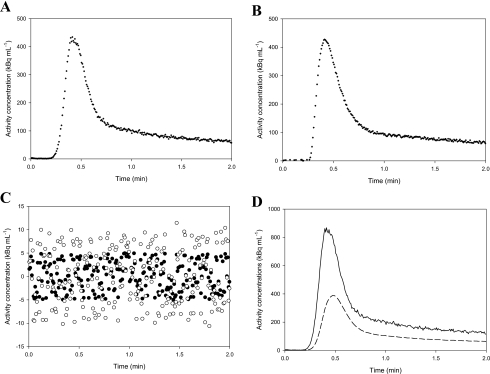
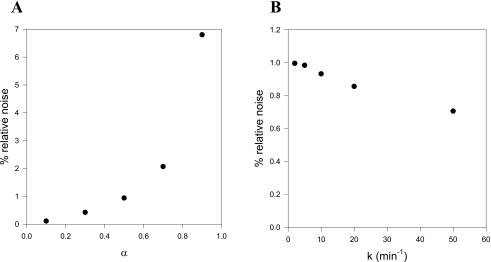
Noise properties of the calculated dispersion-free blood TACs are examined by simulations. Figure 7a shows a measured Co(t), and Fig. 7b shows a simulated noisy TAC, , calculated as follows: a noise-free TAC, , is calculated by fitting a series of exponentials to the Co(t) in Fig. 7a; then a constant level of random noise is added (standard deviation=5 kBq mL−1). This simple noise model is seen to resemble real data when comparing the real Co(t) to the simulated . Dispersion-free and are calculated from Eq. 3 using the characteristic parameters α=0.5 and k=10.0 min−1. The dispersion-free input function has an increased noise level compared to the noise in the original measurements . However, no bias (systematic errors) introduced by the dispersion correction is seen when inspecting plots of the residuals [Fig. 7c]. For reasonable values of α=0.5 and k=10 min−1, noise is mainly propagated by the throughput component in Eq. 3 amplifying the noise in Co(t) by 1∕(1−α). The different noise contributions from the two components are evident from Fig. 7d showing the two terms as functions of time. Figure 8 shows the noise level in as function of α and k. Clearly, large αs tend to increase thenoise level in the dispersion-free Ci(t), whereas the noise level is less sensitive to k. As α approaches unity, the operational equation [Eq. 3] gradually fails to describe the data because of the increased noise.
Figure 7.
Illustration of the noise propagation using the transmission-dispersion model. (a) A noisy blood TAC, Co(t), measured by the automatic blood sampler. (b) A simulated noisy blood TAC, , calculated by fitting a series of exponentials to the measured blood TAC and adding a constant level of random noise. (c) Residuals: black circles show the noise in the simulated , white circles show the noise in the corresponding when calculated using k=10 min−1 and α=0.5. (d) The two contributions to : The solid line is the contribution from the throughput, and the dashed line is the contribution from the washout from the stagnant layer.
Figure 8.
(a) Relative increase in noise level as function of α. (b) Relative increase in noise level as function of k.
Kinetic analysis using dispersed blood TACs
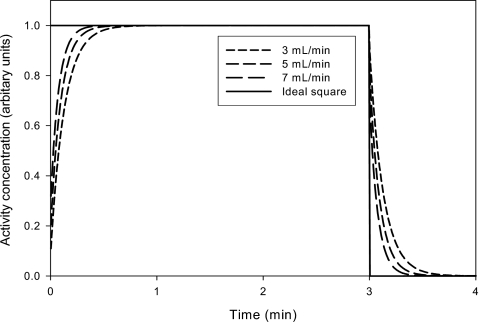
Using the same beaker setup with H215O, we measured a square function at three different catheter flows (Fig. 9). As expected, dispersion was more pronounced at lower catheter flows. When fitting the three dispersed curves, the results were: [α=0.9,k=8 min−1]@3 ml∕min, [α=0.8,k=10 min−1]@5 ml∕min, and [α=0.7,k=13 min−1]@7 ml∕min.
Figure 9.
Step functions were measured in the same beaker setup with H215O using three different flow setting on the automatic sampler. Clearly, a lower catheter flow causes more dispersion on the measure step function.
Now, we simulated the effect of ignoring dispersion-correction in the kinetic analysis of H215O flow studies by PET. The three parameter sets were then used to simulate the effect of using dispersion-corrected input functions using the measured (dispersed) input function from Fig. 7a. The three dispersion-corrected input functions were used to generate three simulated PET TAC using a one-tissue compartment model with parameter values K1=0.5 mL mL−1 min−1, k2=0.6 min−1, and V0=0.05 mL mL−1.
Then, the three simulated PET TACs were fitted using the one-tissue compartment model and the original measured (dispersed) input function. When all parameters were fitted, K1 was underestimated by 7%–15%, and V0 was overestimated by 66%–139%. When V0 was fixed at 0.05 mL mL−1 and only K1 and k2 were fitted, K1 was overestimated by 5%–11%. The fits using a free V0 were better than the fits using a fixed V0 judged by the AIC. In all cases, the parameters were more biased when using the more dispersed input functions.
Finally, we examined the kinetic parameters resulting from the use of an incorrect dispersion correction, i.e., the effect of correcting for dispersion using incorrect parameter values, α and k. We used the previously simulated TACs and considered two cases: undercorrection—fitting the simulated PET TAC (@3 mL∕min) using a dispersion-corrected (@7 mL∕min) input function, and overcorrection—fitting the simulated PET TAC (@7 mL∕min) using a dispersion-corrected (@3 mL∕min) input function. When V0 was fixed at 0.05 mL mL−1 and only K1 and k2 were fitted, undercorrection caused K1 to be overestimated by 6% (as compared to 11% overestimation without correction), whereas overcorrection caused K1 to be underestimated by 7% (as compared to 5% overestimation without correction). Thus, undercorrection is better than no correction, whereas overcorrection could worsen the bias on the kinetic parameter estimates.
DISCUSSION
Use of kinetic analyses to quantify fast physiologic processes by PET requires that both the input function and the tissue TACs are correct. PET tissue TACs are known to be affected by partial volume effects (PVE), which cause small regions with high tracer uptake to be imaged as having an artificially low activity concentration due to limited resolution of contemporary PET cameras [4–5 mm full width at half maximum (FWHM)]. Consequently, PET scanners are developed that has better spatial resolution—either by a trend toward scanners with more and smaller crystals (e.g., Siemens HRRT with 2.5 mm FWHM) or by improved reconstruction techniques that includes time-of-flight or point-spread-function information. In addition, PVE correction algorithms are developed and the importance of applying PVE corrections are broadly acknowledged both for tracer kinetic studies and for tumor imaging.18, 19 This development toward more accurate PET tissue TACs makes an accurate dispersion-corrected input function essential for kinetic modeling.
We present a transmission-dispersion model that allows calculation of the original delay and dispersion-free input function Ci(t) using the dispersed measurements Co(t). In the mathematical formulation, the introduction of a convectively transmitted component made the inversion leading to the equation for Ci(t) possible (see Appendix B). In the limit of no throughput component [α→1 in Eq. 3], the transmission-dispersion model approaches the monoexponential model. Toward this theoretical limit, the noise increases dramatically in Ci(t) as seen in Fig. 8a; and at the limit (α=1), Eq. 3 becomes invalid and calculation of Ci(t) will require deconvolution. For real data, however, this problem is not met: by automatic sampling procedures using all three tracers, we find reasonable values of α around 0.5 (Table 1). Our estimated parameters were always within ranges with acceptable noise propagation as seen from Fig. 8. Furthermore, Fig. 7c shows that the transmission-dispersion model causes no systematic errors on Ci(t) when correcting noisy measurements Co(t), and Fig. 7d shows the noise contributions from the transmitted and dispersed components. In a few cases, however, there was a tendency that the fits deviated slightly around the edges of the measured square function as in Fig. 4. This could be caused by an imperfectly generated square function, a model that does not account for all details of the transport, or the fitting process.
Noisy input functions are known to bias parameters estimated by kinetic modeling.20, 21 It is therefore a positive aspect of the transmission-dispersion model that it does not introduce bias (Fig. 7) and has transparent noise properties (Fig. 8). For existing models including the monoexponential model, the measured Co(t) needs to be deconvoluted numerically to calculate Ci(t). Numerical deconvolution is ill conditioned with problems related to noise and negativity.5, 15, 22 Several noise-reducing regularization techniques have been applied,10, 14, 15 but deconvolution techniques are generally avoided. Instead, existing methods use an implicit deconvolution by building the dispersion corrections into the one-tissue compartment model assuming that the measured input function have been convolved by a monoexponential kernel.8, 9 Implicit deconvolution may be less noise sensitive than explicit deconvolution,22 but as dispersion-free input curves never appear explicitly, corrections for the true activity in the blood are ignored. In addition, it may be troublesome (if at all possible) to build the standard correction into more complex compartment models and noncompartment models. Using the transmission-dispersion model, dispersion-corrected blood input functions can be explicitly calculated (and corrected for hematocrit and metabolites if needed) after data acquisition and before applying the kinetic model. Thus, only the dispersion-corrected blood time-activity curves need to be considered in subsequent kinetic analyses—this adds clarity to the analysis workflow. Moreover, the separation of input correction and kinetic modeling allows inclusion of blood volume terms and allows use of dispersion-free input curves in any kinetic model.
For tracers that equilibrates slowly, dispersion of input functions is not critical when estimating steady-state parameters by linear analyses such as those published by Logan23 or Gjedde–Patlak.24, 25 In contrast, a dispersion-free input function is needed when estimating fast blood-tissue exchange parameters such as blood flow,7, 8, 26 and even small dispersion effects may be more important for more detailed physiologic schemes than for standard compartment modeling that lacks physiologic realism in the description of the early tracer distribution after bolus injection.27 We demonstrated effects of using a dispersed input function [Fig. 7a] when estimating blood flow using the one-tissue compartment model. The model was applied both a floating or fixed volume component (V0). Depending on the model configuration, the blood flow was underestimated by 7%–15% (free V0) or overestimated by up to 5%–11% (fixed V0). The dependence of the model configuration illustrates the consequence of ignoring dispersion correction. With the dispersion-free input function, both model configurations would produce the same result for all parameters, but when the input function is dispersed then other parameters compensate for the erroneous input function and the flow estimate gets both biased and dependent on the model configuration. The interaction between parameters was even more obscured when a free time-delay parameter was incorporated in the fit (data not shown). We believe that these problems should be avoided by applying a dispersion correction before the kinetic analysis.
Effects of catheter dispersion are a complex function of many factors, e.g., material, inner diameter, length, and withdrawal flow, and therefore each research facility should estimate the characteristic parameters, α and k, for their particular experimental setup. Adaptation of characteristic parameters measured at another research facility, or those from this article, could lead to under- or overcorrection as demonstrated in Sec. 3E. Particularly, it is important to estimate a set of characteristic parameters for each tracer, since other tracers could interact more strongly with the tube material than those examined in this article. Catheter dispersion also depends on the fluid and tracer. Blood has a higher viscosity than water solutions,6 and the flow profile in blood can be different from that of water depending on the hemodynamic flow properties in a sampling catheter. In addition, components of the blood may stick to the catheter. Therefore, characteristics of the blood sampling device must be measured in blood. We used three PET tracers with different transport properties: C15O transported by red blood cells and used to estimate blood flow and blood volume,26 H215O transported by plasma and red blood cells and used to estimate blood flow,7 and 11C-MG transported by plasma in pigs, which is a substrate for the glucose transporters.28, 29 We found no measurable dispersion (Fig. 3) using manual blood sampling possibly due to the high catheter flow caused by rapid withdrawal of large blood portions through a relatively small catheter volume. In contrast, the automatic blood sampling system produced substantial dispersion (Fig. 4) due to a moderate catheter flow, where more tracer molecules interact with the catheter. Thus, only the automatic sampling system was characterized using the transmission-dispersion model. The results showed significant variation depending on flow, but only little variation depending on the three tracers that we used. Estimates of α tended to be low for 15CO born by red blood cells that would mainly travels centrally and away from the catheter walls during laminar flow, but this observation was not statistically significant. This means that the distribution of tracer in plasma and blood was of minor importance for the dispersion, which may be explained by the nonlaminar catheter flow that is associated with the pulsatile flow produced by the peristaltic pump. Automated blood sampling systems with a laminar catheter flow may show more tracer-dependent dispersion.
In this article, we address distortions caused by external blood sampling systems. Besides dispersion, the blood sampling catheters cause an external delay. For manual sampling, the flow is high in the catheter and the external delay in the sampling catheter may be ignored. For the automated sampler, the delay is calculated as T=V∕F, where V is the volume of the catheter (up to the detector) and F is the preset catheter flow. Therefore, accurate corrections for external delay are made by inserting the appropriate value into Eq. 3. Alternatively, T could be estimated from the square function data, but we found that the calculated T=V∕F worked very well. In addition to external distortions, dispersion and delay effects occurring internally in blood vessels need a special correction if the path length from the injection site to the target organ differs from the path length from the injection site to the sampling site. Internal distortions are less controllable as they may vary between human subjects and their physiologic states. Depending on the specific experimental setup, a correction for internal delay may be important for kinetic analyses of dynamic PET data.30 Internal delay is corrected by shifting the time axis of the input function to synchronize it to the time axis of the PET TAC. The necessary time shift can be estimated: before fitting, using the slope method,4 during fitting, using a time-delay parameter incorporated in the kinetic model,9 or directly using mass conservation in cases where blood flow is known or estimated.26 Internal dispersion occurring in blood vessels may be evaluated by relating arterial TACs measured upstream with arterial TACs measured downstream by using the transmission-dispersion model.
CONCLUSIONS
We developed a transmission-dispersion model to estimate dispersion in blood sampling systems and to calculate dispersion-free input functions needed for kinetic analysis of physiologic data. The model quantitatively takes apart effects of transmission and dispersion, it has transparent noise properties associated with each component, and it does not require deconvolution to calculate dispersion-free input functions. Once characteristic parameters are calibrated for the combination of tracer and sampling procedure, input functions can be corrected before applying kinetic models. This allows bias-free estimation of kinetic parameters.
ACKNOWLEDGMENTS
This study was supported by grants from the Aarhus University Hospital Research Initiative, The Danish Medical Research Council Grant No. 22-02-0337, and NIH Grant No. R01-DK-074419. The authors thank the staff at Aarhus PET Center for excellent assistance during the blood sampling experiments; in particular Jens Kristian Graverholt and Søren B. Hansen for expertise on the automated blood sampling device, and Aage K. Olsen responsible for animal experiments.
APPENDIX A: TRANSMISSION-DISPERSION EQUATIONS FOR ESTIMATING CHARACTERISTIC PARAMETERS USING STEP FUNCTION INPUTS
Consider an infusion step-up function
| (A1) |
where C is a constant activity concentration. Substitution into Eq. 1 and using M1(0)=0 yields
Shifting with a transit time T and inserting into Eq. 1, the outflow following a step-up function is
| (A2) |
Similarly, an operational equation for a step-down function
| (A3) |
is obtained by substitution into Eq. 2 and by using M1(0)=C,
with the corresponding expression for the outflow following a step-down function
| (A4) |
An expression for a rectangular input function (infusion start at t=0, and infusion length ΔTinf) are obtained by considering Eqs. A2, A4. For an infusion time long compared to the characteristic time of the system, i.e., e−kΔTinf⪡1,
| (A5) |
Because of the large values of kΔTinf (see Table 1 and Figs. 34) this approximation was sufficient for our purpose.
APPENDIX B: TRANSMISSION-DISPERSION EQUATIONS FOR CALCULATING DISPERSION-FREE INPUT FUNCTIONS
After time-shifting Eq. 2, t→t+T, the equations describing the transmission-dispersion system are
| (B1) |
| (B2) |
with M1(0)=0, and Ci(t<0)=0. Eliminate Ci(t) from Eqs. B1, B2,
for 0≤α<1. By rearrangement,
and integration,
From Eq. B2, we get
| (B3) |
which is Eq. 3. This is also the solution of an equivalent integral equation obtained by eliminating M1(t) from Eqs. 1, 2, in which Co(t) is given and Ci(t) is unknown. In the presence of convective transmission (0<α<1) the equation is inhomogeneous. The solution in Eq. 3 [Eq. B3] fails when the inhomogeneity is lost as α approaches unity. Then the remaining homogenous equation describing pure dispersion requires numerical deconvolution, as do all catheter dispersion models published so far.8, 10, 11
References
- van der Weerdt A. P., Klein L. J., Boellaard R., Visser C. A., Visser F. C., and Lammertsma A. A., “Image-derived input functions for determination of MRGlu in cardiac (18)F-FDG PET scans,” J. Nucl. Med. 42, 1622–1629 (2001). [PubMed] [Google Scholar]
- Keiding S., Munk O. L., Schiott K. M., and Hansen S. B., “Dynamic 2-[18F]fluoro-2-deoxy-D-glucose positron emission tomography of liver tumours without blood sampling,” Eur. J. Nucl. Med. 27, 407–412 (2000). [DOI] [PubMed] [Google Scholar]
- Graham M. M. and Lewellen B. L., “High-speed automated discrete blood sampling for positron emission tomography,” J. Nucl. Med. 34, 1357–1360 (1993). [PubMed] [Google Scholar]
- Kanno I., Iida H., Miura S., Murakami M., Takahashi K., Sasaki H., Inugami A., Shishido F., and Uemura K., “A system for cerebral blood flow measurement using an H215O autoradiographic method and positron emission tomography,” J. Cereb. Blood Flow Metab. 7, 143–153 (1987). [DOI] [PubMed] [Google Scholar]
- Votaw J. R. and Shulman S. D., “Performance evaluation of the Pico-Count flow-through detector for use in cerebral blood flow PET studies,” J. Nucl. Med. 39, 509–515 (1998). [PubMed] [Google Scholar]
- Boellaard R., van Lingen A., van Balen S. C., Hoving B. G., and Lammertsma A. A., “Characteristics of a new fully programmable blood sampling device for monitoring blood radioactivity during PET,” Eur. J. Nucl. Med. 28, 81–89 (2001). [DOI] [PubMed] [Google Scholar]
- Ohta S., Meyer E., Fujita H., Reutens D. C., Evans A., and Gjedde A., “Cerebral [15O]water clearance in humans determined by PET: I. Theory and normal values,” J. Cereb. Blood Flow Metab. 10.1097/00004647-199609000-00002 16, 765–780 (1996). [DOI] [PubMed] [Google Scholar]
- Iida H., Kanno I., Miura S., Murakami M., Takahashi K., and Uemura K., “Error analysis of a quantitative cerebral blood flow measurement using H2(15)O autoradiography and positron emission tomography, with respect to the dispersion of the input function,” J. Cereb. Blood Flow Metab. 6, 536–545 (1986). [DOI] [PubMed] [Google Scholar]
- Meyer E., “Simultaneous correction for tracer arrival delay and dispersion in CBF measurements by the H215O autoradiographic method and dynamic PET,” J. Nucl. Med. 30, 1069–1078 (1989). [PubMed] [Google Scholar]
- Yeung W. T., Lee T. Y., Del Maestro R. F., Kozak R., Bennett J. D., and Brown T., “An absorptiometry method for the determination of arterial blood concentration of injected iodinated contrast agent,” Phys. Med. Biol. 37, 1741–1758 (1992). [DOI] [PubMed] [Google Scholar]
- Anissimov Y. G., Bracken A. G., and Roberts M. S., “Catheter effects in organ perfusion experiments,” J. Theor. Biol. 214, 263–273 (2002). [DOI] [PubMed] [Google Scholar]
- Evans A. M., Hussein Z., and Rowland M., “Influence of albumin on the distribution and elimination kinetics of diclofenac in the isolated perfused rat liver: analysis by the impulse-response technique and the dispersion model,” J. Pharm. Sci. 82, 421–428 (1993). [DOI] [PubMed] [Google Scholar]
- Weiss M., Ballinger L. N., and Roberts M. S., “Kinetic analysis of vascular marker distribution in perfused rat livers after regeneration following partial hepatectomy,” J. Hepatol. 29, 476–481 (1998). [DOI] [PubMed] [Google Scholar]
- Dhawan V., Jarden J. O., Strother S., and Rottenberg D. A., “Effect of blood curve smearing on the accuracy of parameter estimates obtained for 82Rb/PET studies of blood-brain barrier permeability,” Phys. Med. Biol. 33, 61–74 (1988). [DOI] [PubMed] [Google Scholar]
- De Nicolao G., Sparacino G., and Cobelli C., “Nonparametric input estimation in physiological systems: Problems, methods, and case studies,” Automatica 10.1016/S0005-1098(96)00254-3 33(5), 851–870 (1997). [DOI] [Google Scholar]
- Crone C. and Lassen N. A., Alfred Benzon Symposium: Capillary Permeability (Munksgaard, Copenhagen, 1970).
- Akaike H., “A new look at the statistical model identification,” IEEE Trans. Autom. Control 10.1109/TAC.1974.1100705 AC-19, 716–723 (1974). [DOI] [Google Scholar]
- Soret M., Bacharach S. L., and Buvat I., “Partial-volume effect in PET tumor imaging,” J. Nucl. Med. 48, 932–945 (2007). [DOI] [PubMed] [Google Scholar]
- Teo B. K., Seo Y., Bacharach S. L., Carrasquillo J. A., Libutti S. K., Shukla H., Hasegawa B. H., Hawkins R. A., and Franc B. L., “Partial-volume correction in PET: Validation of an iterative postreconstruction method with phantom and patient data,” J. Nucl. Med. 48, 802–810 (2007). [DOI] [PubMed] [Google Scholar]
- Huesman R. H. and Mazoyer B. M., “Kinetic data analysis with a noisy input function,” Phys. Med. Biol. 10.1088/0031-9155/32/12/004 32, 1569–1579 (1987). [DOI] [PubMed] [Google Scholar]
- Chen K. W., Huang S. C., and Yu D. C., “The effects of measurement errors in the plasma radioactivity curve on parameter estimation in positron emission tomography,” Phys. Med. Biol. 10.1088/0031-9155/36/9/003 36, 1183–1200 (1991). [DOI] [PubMed] [Google Scholar]
- Kanno I., Lammertsma A. A., Heather J. D., Gibbs J. M., Rhodes C. G., Clark J. C., and Jones T., “Measurement of cerebral blood flow using bolus inhalation of C15O2 and positron emission tomography: Description of the method and its comparison with the C15O2 continuous inhalation method,” J. Cereb. Blood Flow Metab. 4, 224–234 (1984). [DOI] [PubMed] [Google Scholar]
- Logan J., Fowler J. S., Volkow N. D., Wolf A. P., Dewey S. L., Schlyer D. J., MacGregor R. R., Hitzemann R., Bendriem B., and Gatley S. J., “Graphical analysis of reversible radioligand binding from time-activity measurements applied to [N-11C-methyl]-(-)-cocaine PET studies in human subjects,” J. Cereb. Blood Flow Metab. 10, 740–747 (1990). [DOI] [PubMed] [Google Scholar]
- Gjedde A., “Calculation of cerebral glucose phosphorylation from brain uptake of glucose analogs in vivo: A re-examination,” Brain Res. 257, 237–274 (1982). [DOI] [PubMed] [Google Scholar]
- Patlak C. S., Blasberg R. G., and Fenstermacher J. D., “Graphical evaluation of blood-to-brain transfer constants from multiple-time uptake data,” J. Cereb. Blood Flow Metab. 3, 1–7 (1983). [DOI] [PubMed] [Google Scholar]
- Munk O. L., Bass L., Feng H., and Keiding S., “Determination of regional flow by use of intravascular pet tracers: Microvascular theory and experimental validation for pig livers,” J. Nucl. Med. 44, 1862–1870 (2003). [PubMed] [Google Scholar]
- Munk O. L., Keiding S., and Bass L., “Capillaries within compartments: microvascular interpretation of dynamic positron emission tomography data,” J. Theor. Biol. 225, 127–141 (2003). [DOI] [PubMed] [Google Scholar]
- Munk O. L., Bass L., Roelsgaard K., Bender D., Hansen S. B., and Keiding S., “Liver kinetics of glucose analogs measured in pigs by PET: Importance of dual-input blood sampling,” J. Nucl. Med. 42, 795–801 (2001). [PubMed] [Google Scholar]
- Gjedde A., Wienhard K., Heiss W. D., Kloster G., Diemer N. H., Herholz K., and Pawlik G., “Comparative regional analysis of 2-fluorodeoxyglucose and methylglucose uptake in brain of four stroke patients. With special reference to the regional estimation of the lumped constant,” J. Cereb. Blood Flow Metab. 5, 163–178 (1985). [DOI] [PubMed] [Google Scholar]
- Iida H., Higano S., Tomura N., Shishido F., Kanno I., Miura S., Murakami M., Takahashi K., Sasaki H., and Uemura K., “Evaluation of regional differences of tracer appearance time in cerebral tissues using [15O] water and dynamic positron emission tomography,” J. Cereb. Blood Flow Metab. 8, 285–288 (1988). [DOI] [PubMed] [Google Scholar]
- Keiding S. (unpublished data).


