Abstract
A notable complication of applying current image-guided surgery techniques of soft tissue to kidney resections (nephrectomies) is the limited field of view of the intraoperative kidney surface. This limited view constrains the ability to obtain a sufficiently geometrically descriptive surface for accurate surface-based registrations. The authors examined the effects of the limited view by using two orientations of a kidney phantom to model typical laparoscopic and open partial nephrectomy views. Point-based registrations, using either rigidly attached markers or anatomical landmarks as fiducials, served as initial alignments for surface-based registrations. Laser range scanner (LRS) obtained surfaces were registered to the phantom’s image surface using a rigid iterative closest point algorithm. Subsets of each orientation’s LRS surface were used in a robustness test to determine which parts of the surface yield the most accurate registrations. Results suggest that obtaining accurate registrations is a function of the percentage of the total surface and of geometric surface properties, such as curvature. Approximately 28% of the total surface is required regardless of the location of that surface subset. However, that percentage decreases when the surface subset contains information from opposite ends of the surface and∕or unique anatomical features, such as the renal artery and vein.
Keywords: nephrectomy, kidney cancer, surface-based registration, curvature
INTRODUCTION
Approximately 30 000 new cases of kidney cancer, generally renal cell carcinoma, are detected each year in the U.S., and kidney resection, also known as a nephrectomy, is the only known curative treatment for this type of localized cancer.1 Traditionally, a radical nephrectomy, which is the resection of the kidney, its surrounding fat and lymphatics and the adrenal gland, is the primary treatment for patients with advanced renal cell carcinoma. Such a drastic resection is needed because the tumor commonly extends into the fat and lymphatics.2 However, with advances in imaging, surgical techniques and the early discovery of low stage carcinomas, a partial nephrectomy has become a more common form of treatment. A partial nephrectomy involves the complete removal of a renal tumor while leaving the largest possible amount of normal functioning kidney, also known as a clear margin.3 When carcinomas are detected early, the diseased tissue is localized to the kidney with the absence of metastasis, thus increasing the likelihood of a successful partial nephrectomy. Recent studies have demonstrated that a partial nephrectomy, either open or laparoscopic, with a clear margin is an effective procedure for renal cell carcinoma, especially for tumors less than 4 cm.4, 5, 6, 7 This nephron-sparing procedure is imperative when the contralateral kidney is functionally impaired, or has been surgically removed.5, 7 However, there are technical challenges associated with these procedures. Such challenges include adequate intraoperative identification of the tumor, identification and control of the vascular supply, and avoidance of ischemic injury to the normal kidney tissue.7
Currently, surgeons remove the renal tumor masses using only direct or laparoscopic visualizations. This limited view prolongs the procedure and decreases the likelihood of a clear margin. Surgeons are aiming for a target that they can barely see unless they significantly disturb healthy tissue. The less the surgeons are required to disturb the kidney and its surrounding tissue during the procedure, the shorter the recovery time will be for the patient. Thus, there remains a need for surgeons to acquire additional intraoperative visualization of the patient’s anatomy in order to improve surgical outcome. Employing image-guided surgery could provide such representations in the operating room (OR).
The goal of image-guided surgery (IGS) is to provide surgeons with an accurate, real-time location of a surgical probe or instrument within the context of a preoperative image containing patient anatomy and pathology. IGS applications have been developed for brain,8, 9, 10 spine,11 liver,12, 13, 14 and other organs.15 Most of these IGS techniques rely on the use of rigid anatomical landmarks or extrinsic objects placed on or near the site of surgery. An example are fiducial markers rigidly attached to the skull for neurosurgery.16 However, with open abdominal procedures, no such rigid landmarks are available. This led to the exploration of surface descriptions of anatomical features to drive surface-based registrations in such circumstances. Here an anatomic surface description is extracted from preoperative tomograms and registered to an intraoperatively obtained physical space description.17 A major limitation of surface-based registrations is the requirement for geometrically distinct surfaces. If an anatomical object is rotationally symmetric without any defining features, there will be multiple closest point pairs that provide an acceptable registration in the iterative closest point (ICP) algorithm. This can be mitigated by a close starting position for the ICP. However, the kidney represents a challenge in that there must be a balance between larger exposures for better registration and smaller exposures for faster patient recovery.
This article reports the results of testing whether applying current IGS registration techniques, as those used in liver cases, can be used in nephrectomies. After attending and analyzing a variety of nephrectomy procedures, the complications of incorporating IGS into kidney surgery became evident. The most prominent obstacle with these procedures is the limited field of view of the intraoperative kidney surface, which constrains the ability to obtain a geometrically descriptive surface. The kidney is normally surrounded by perirenal fat which serves as a support and insulator for the kidneys. However, that fat must be removed in order to expose the kidney.
Conventional surgical instruction would have the surgeon remove all of the perirenal fat in order to examine the kidney and the surrounding tissue for metastases, thus exposing the whole surface, however, such disruption increases both the necessary hospital stay and recovery discomfort. Modern imaging techniques give the surgeon the expectation that they will preoperatively know if there are metastatic tumors. Therefore, a number of surgeons have adopted minimally invasive procedures which reduce damage to healthy tissue and the concomitant recovery time and pain. However, even these techniques require some movement of perirenal fat and the percentage removed is a function of the patient, the surgeon, the location of the tumor, and the approach. The value of adding image-guidance is not specific to either fully exposed open approaches or to minimal exposure, minimally invasive approaches. This is because a critical surgical task is the determination of the location of the tumor margin on the interior of the kidney. Locating this margin allows the tumor to be resected without tumor margin violation and yet spare the maximum number of healthy nephrons. The goal of this research was to determine what fraction of the surface is required for accurate registrations in both open and minimally invasive orientations. We have attempted to determine the percentage necessary using naïve choices of surface patches and to elucidate whether intelligent patch choice can reduce the amount of exposure necessary.
What constitutes “accurate registration?” The only knowledge sources available at present to surgeons attempting to locate the interparenchymal margin of a tumor is either intraoperative ultrasound imaging or mechanically following the tumor capsule margin. Ultrasound has a low signal to noise in the grayscale and has poorly defined spatial features. In addition, some kidney tumors are poorly visualized using ultrasound.18 Mechanically following a tumor capsule has an asymmetric penalty in that violating the capsule, thus spilling tumor cells is a very bad outcome while cutting wide of the capsule “merely” costs the resection of healthy nephrons and potential intrusion into vascular structures. So the “necessary” accuracy of registration for improving clinical outcomes has yet to be determined. We will use a target registration error (TRE) for external structures of less than 5 mm as a threshold. Since the critical component of a spatial transformation is its rotational term, by using external targets we exaggerate the rotation-based error. In addition, by using an anthropomorphic phantom instead of an animal model, we can investigate the performance of the registration process in the absence of deformation or sample-to-sample variability. This allowed us to establish bounds on the system performance and later introduce those issues and see how (or if) the registration process degrades.
METHODS
Phantom setup
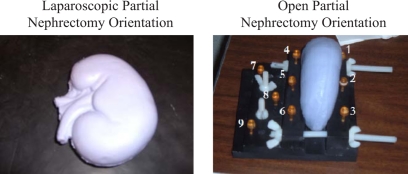
Testing the feasibility of extending the current image-guided surgery framework to kidney procedures first required the creation of an anthropomorphic, to-scale kidney phantom using silicon rubber (“Dragon Skin,” Smooth-On, Inc., Easton, PA). The phantom accurately modeled typical geometrical surface properties such as curvature and smoothness. The purpose of the kidney phantom was to provide a shape to test how much of the surface is needed for an accurate registration. Two different orientations of the phantom were used to simulate the different orientations usually presented in the OR. The typical view of the kidney during a laparoscopic nephrectomy is shown on the left side of Fig. 1. For traditional open partial nephrectomies, the patient is right∕left lateral with the smooth, round dorsal surface of the kidney facing upwards. To model this, a cradle was constructed using Plexiglas and nylon screws to hold the phantom upright as depicted on the right side of Fig. 1. Nine markers (Acustar™, z-kat, Hollywood, FL) were screwed into the cradle and the centroid of each marker served in either the fiducial and target point sets. Markers 2, 5, 7, 8, and 9 served as targets and the other four were used as fiducials.
Figure 1.
Laparoscopic orientation (left) of kidney phantom to resemble surface seen by surgeons during a laparoscopic partial nephrectomy. Cradle constructed to provide the open orientation (right) of kidney phantom to resemble surface seen by surgeons during an open partial nephrectomy.
Computed tomography (CT) images of both phantom orientations were acquired. The kidney phantom CT images were segmented manually using Analyze AVW 6.0.19 From the segmented images, the marching cubes algorithm was used to generate an initial approximation of the kidney phantom’s surface.20 The Fast RBF Toolbox™ (FarField Technology, Ltd., Christchurch, New Zealand) was then used to define a parametric version of the marching cubes surface.21 This smooth surface was considered as the image surface. The laparoscopic orientation RBF surface contained 50 812 points and the open orientation RBF surface contained 31 081 points. The construction of the image surface is improved when using a relatively small image slice thickness. A slice thickness of 1 mm with 0.4 mm inplane resolution was used for these experiments. The caps on the markers contained a liquid visible in CT images, and the image coordinates of each marker’s centroid for the phantom in the open orientation was determined. The liquid caps of the markers were replaced with divot caps designed to be localized with a probe. Fiducial point sets for the laparoscopic orientation were compiled from the CT image volume using anatomical features on the kidney phantom such as the ureter, renal artery, and renal vein.
Registration validation
For both phantom orientations, the fiducial points were used to perform a point-based registration, which then served as a guide for a surface-based registration. Physical surfaces were obtained using a laser range scanner (LRS) (3-D Digital Corp., Sandy Hook, CT) and were registered to the image surface. The surface descriptions of the phantom could be generated from any method that gives high density point coverage of the surface. The surface-based registrations used a rigid ICP algorithm formulated by Besl and McKay.21 In order to decrease closest point search times, k-d dimensional trees were used in the ICP implementation.22, 23 These registrations were validated in order to characterize the effect of restricted, visible surface on the robustness of the surface-based registrations. Robust surface-based registrations are characterized by subsets of the physical surface consistently achieving registration errors close to those attained when using the entire LRS surface, suggesting that the subsets are capable of accurately predicting a registration for the entire kidney surface. The metric used for assessment of registration accuracy is the TRE. The TRE is the root-mean-square (RMS) residual between the localized target position (y) and the transformed image position (x), using the transformation matrix (R,t) obtained during registration
Since any transformation is governed by a rotation (R) and a translation (t), by using targets outside of the registered object the TRE actually overestimates the expected target error for targets within the kidney. However, by using such an experimental process, we have confidence that the demonstrated performance can be obtained when taken to the operating room.
Laparoscopic orientation validation
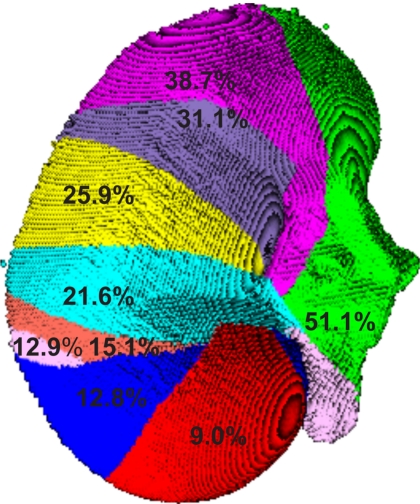
The LRS surface (25 938 points) was divided into subsets of increasing number of points in a sequential manner as seen in Fig. 2. Increasing the number of points in the surface subset should reflect the increase in the intraoperative surface available for a registration. Each colored surface represents the increase in the amount of surface used in a subset. This segmentation is not based on anatomically significant areas of the kidney, rather a representation of surgical unveiling. For example, the red surface represents the smallest surface used (9.0% of the total image surface) and the blue surface represents the amount of surface added to the red surface for the next largest surface subset (12.8% of the total image surface).
Figure 2.
Second segmentation of kidney surface in laparoscopic orientation. Each gray value corresponds to a different surface subset. The numbers represent the percentage of the total image surface used in the registration.
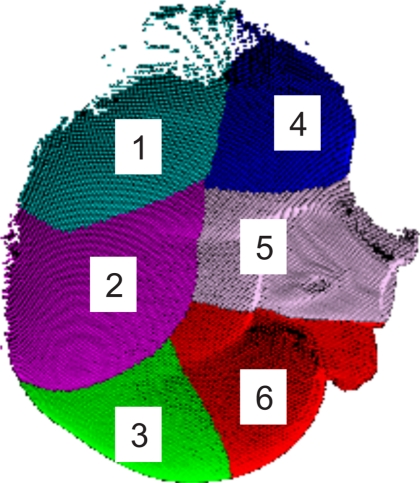
In a separate experiment, the surface was divided into six subsets, and various combinations of these subsets also served as a measure for the possible intraoperative views. This method of surface division explored the effect of using patches from different areas of the kidney, rather than contiguously adding more points to the surface. Using various patch combinations should reveal more on the nature of how each surface subset affects the registrations. The second segmentation of the kidney is shown in Fig. 3.
Figure 3.
Segmentation of kidney surface in open orientation.
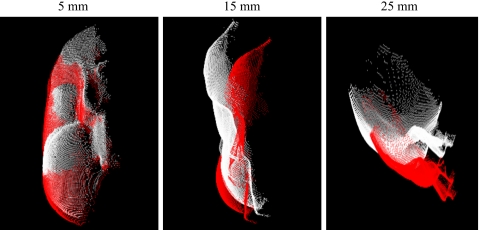
Since current methods of IGS in soft tissue may be sensitive to the initial pose provided by point-based registration, a rotation and translation were introduced to the physical fiducial points by applying a random normalized vector with magnitudes of 5, 10, 15, 20, and 25 mm to each fiducial point. Examples of this misalignment transformation of the LRS surface for perturbation vector magnitudes of 5, 15, and 25 mm are shown in Fig. 4. These perturbations should reveal the effects of poor initial alignments given by the point-based registration. In addition by using random perturbations from a “best fit” orientation, the performance of the surface registration can be isolated and tested in repeated trials with known point correspondence.
Figure 4.
Example of the transformation of the initial pose caused by perturbation vector with magnitudes of 5, 15, and 25 mm.
To test how different intraoperative views affect the robustness of the surface-based registration, each surface subset, or patch combination, was registered to the image surface using the perturbed initial alignments. The rotations and translations from those surface-based registrations were used to transform the rest of the LRS surface not included in the subset in order to assess the accuracy of using partial surfaces to estimate the rest of the physical space surface’s registration. Since no reliable targets were available, the RMS of the distances between closest points on the image surface and the transformed points on each LRS surface without the subset was calculated to serve as a measure for error. The RMS error was averaged over 500 trials for each magnitude of perturbation. It is expected that RMS distances will decrease when the LRS surface subset size increases. It is also expected that subsets with a variety of surface geometries will provide more accurate registrations. These experiments should reveal whether the robustness of the registrations depends strictly on a percentage of the surface used or on geometric surface properties.
Open orientation validation
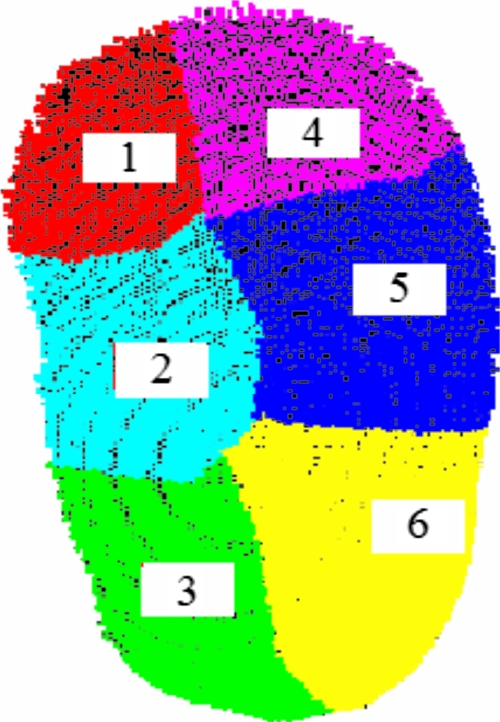
Subsets of the total LRS surface (11 802 points) were constructed to emulate the views seen in the OR. The LRS surface was divided into six patches as seen in Fig. 5. Various combinations of these six patches were used as subsets of the LRS surface to examine sequential versus random patch combinations.
Figure 5.
Segmentation of kidney surface in open orientation.
As with the other phantom orientation, the physical fiducial points were perturbed by a normalized random vector of magnitudes 5, 10, 15, 20, and 25 mm to simulate poor initial alignments. The various surface patch combinations were registered to the image surface using the perturbed initial alignment. The translation and rotation from the surface-based registration given by each patch combination were used to transform the rest of the physical space surface as well as the five targets. Mean RMS errors were calculated as before, but this time using 1000 trials. In addition, due to the ease of attaching targets on this phantom setup, TREs were averaged over 1000 trials for each magnitude of perturbation. This study should help further determine whether the threshold for an accurate registration is based on the number of points in the subset or on sequential patches that capture a surface’s descriptive characteristics.
Patch value
Surface registrations are somewhat notorious for being “fragile.”24 That is, they can minimize their cost function on completely incorrect surfaces. This can be minimized by selecting patches with low rotational symmetry or by patches which constitute volume edges. Since we had robust information in the form of LRS surfaces and tomographic scans we examined patches which provided good registrations with small total surface area to see if such a technique could assist the surgeon in defining the surfaces to unveil. We used a method adopted from Sander and Zucker25 to identify the Gaussian curvature (K) and mean curvature (H). Since we have the surfaces in (u,v) form and we can determine the surface normal n, K, and H can be determined from the Hessian matrix of h(u,v). Since we exhaustively search patch combinations we can visually inspect our results to see if patch combinations containing either surface edge patches or high curvature scores provide disproportionably better fits.
RESULTS
Laparoscopic orientation results
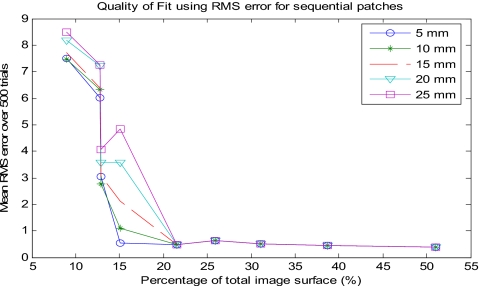
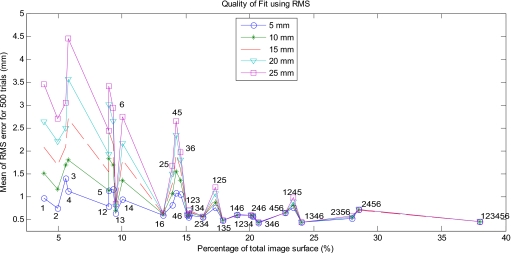
Our results suggest that approximately 28% of the total kidney surface is needed to drive an accurate surface-based registration. The amount of surface needed to produce low RMS errors for the sequential patches was evident. The RMS error for the surface subset using 22% of the total surface dropped significantly for all magnitudes of perturbation. In addition, the standard deviation also dropped significantly, further supporting the accuracy of the registration for this subset. The discrepancy between 28% and 22% of the surface will be discussed later. Figure 6 and Table 1 show the means and standard deviations of the RMS errors for the sequential patches at varying magnitudes of perturbation. Surfaces that contained percentages greater than 22% of the surface produced similar results. Higher RMS values were generated for surface subsets with fewer portions of the surface. For the 9% and the two 13% subsets, the RMS errors were very large (between 2.5 and 9 mm) for all magnitudes of perturbation. Increasing the magnitude of perturbation increased the registration error, which is consistent with similar surface-based registration studies. This is most evident with the 15% surface subset. For small magnitudes of perturbation the RMS error was on the order of 1 mm, but for higher magnitudes of perturbation the error was more on the order of 8 mm. The standard deviation also greatly increased for the 15% subset, revealing its inability to consistently provide an accurate registration. The perturbation effect was negligible with surfaces of 22% and higher, implying that their surface-based registrations are robust. These findings suggest that accurate surface-based registrations require obtaining fractions of the surface that include at least 22% of the total image surface.
Figure 6.
Mean RMS error over different magnitudes of perturbation for sequential patch combinations in the laparoscopic orientation.
Table 1.
Mean±standard deviation of RMS error (mm) of sequential patch combinations for laparoscopic orientation of phantom.
| RMS error (mm) for sequential patches | |||||
|---|---|---|---|---|---|
| Portion of total surface (%) | Magnitude of Perturbation (mm) | ||||
| 5 | 10 | 15 | 20 | 25 | |
| 9.0 | 7.5±1.7 | 7.5±2.8 | 7.2±3.5 | 8.2±4.5 | 8.5±5.1 |
| 12.8 | 6.0±2.2 | 6.3±3.4 | 6.4±4.3 | 7.2±5.3 | 7.3±6.1 |
| 12.9 | 3.1±1.7 | 2.8±2.1 | 3.1±2.8 | 3.6±4.0 | 4.1±4.9 |
| 15.1 | 0.5±0.0 | 1.1±2.7 | 2.1±4.6 | 3.6±6.3 | 4.8±7.5 |
| 21.6 | 0.5±0.0 | 0.5±0.0 | 0.5±0.0 | 0.5±0.0 | 0.5±0.1 |
| 25.9 | 0.6±0.0 | 0.6±0.1 | 0.6±0.1 | 0.6±0.1 | 0.6±0.1 |
| 31.1 | 0.5±0.0 | 0.5±0.0 | 0.5±0.0 | 0.5±0.0 | 0.5±0.0 |
| 38.7 | 0.4±0.0 | 0.4±0.0 | 0.4±0.0 | 0.4±0.0 | 0.4±0.0 |
| 51.0 | 0.4±0.0 | 0.4±0.0 | 0.4±0.0 | 0.4±0.0 | 0.4±0.0 |
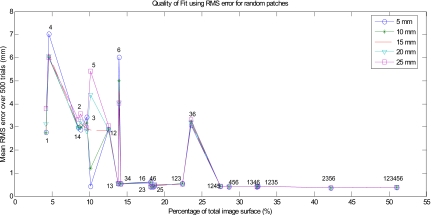
The results of the various patch combinations suggest that while obtaining 22% of the image surface works most of the time, 28% surface exposure provides a more robust registration. The mean RMS errors for many of the patch combinations tested are displayed in Fig. 7 and Table 2. Similar to the sequential patches experiment, patch combinations containing fewer than 13% of the surface yield RMS errors greater than 1 mm for all magnitudes of perturbation. Patch 5 also demonstrated the lack of robustness of the registration in that by increasing magnitudes of perturbation the RMS error increased to 5 mm. Surface subsets containing patch combinations 1 and 3; and 3 and 4 are of particular interest since they yield RMS errors below 1 mm but only contained 15% of the image surface. These surfaces contain information from opposite sides of the kidney surface, confining the possible registration solutions. The patch combination of 3 and 6 (25%) yields a much higher RMS error (∼3 mm) than the patches containing similar surface percentages (less than 1 mm). This surface subset contains more than 22% of the surface, yet performed poorly in the robustness test. Additionally, the surface containing very smooth patch 6 was inconsistent with the patches with similar percentages. These results suggest that the constraint for an intraoperative surface to be able to drive an accurate surface-based registration is not just a percentage of the total surface. The surface subsets that appeared to include enough percentage of the total surface did not contain enough geometric descriptions to be able to drive an accurate registration. Further, surface subsets with a relatively small percentage of the total surface but with more geometrically descriptive surfaces were able to provide accurate registrations. The percentage of total surface does play a role, but should not be the only criterion considered when deciding how much of a surface to use for an accurate registration.
Figure 7.
Mean RMS error for different magnitudes of perturbation for various patch combinations in the laparoscopic orientation.
Table 2.
Mean±standard deviation of RMS error (mm) of random patch combinations for laparoscopic orientation of phantom.
| RMS error (mm) for various patch combinations | ||||||
|---|---|---|---|---|---|---|
| Portion of total surface | Magnetude of Perturbation (mm) | |||||
| Patch No. | Percentage (%) | 5 | 10 | 15 | 20 | 25 |
| 1 | 4.2 | 2.8±0.4 | 2.7±0.7 | 2.9±1.0 | 3.1±1.6 | 3.8±2.4 |
| 4 | 4.6 | 7.0±2.1 | 6.0±2.7 | 6.2±2.4 | 6.1±2.5 | 6.0±2.6 |
| 2 | 8.5 | 3.0±0.5 | 3.0±0.5 | 3.0±1.4 | 2.9±1.6 | 3.3±2.0 |
| 1 and 4 | 8.8 | 2.9±0.4 | 3.0±1.1 | 3.2±1.5 | 3.2±1.8 | 3.6±2.2 |
| 3 | 9.6 | 3.4±0.4 | 3.2±0.6 | 3.0±0.9 | 2.8±1.0 | 3.0±1.8 |
| 5 | 10.1 | 0.4±0.7 | 1.2±3.4 | 2.9±5.5 | 4.4±6.7 | 5.4±7.2 |
| 1 and 2 | 12.6 | 2.9±0.4 | 2.9±0.9 | 2.8±1.1 | 2.9±1.4 | 3.1±1.6 |
| 1 and 3 | 13.9 | 0.6±0.0 | 0.6±0.0 | 0.6±0.1 | 0.5±0.1 | 0.5±0.1 |
| 6 | 13.9 | 6.0±0.8 | 5.0±2.3 | 4.6±2.6 | 4.1±2.8 | 4.0±2.9 |
| 3 and 4 | 14.2 | 0.6±0.0 | 0.5±0.0 | 0.5±0.0 | 0.5±0.0 | 0.5±0.1 |
| 2 and 3 | 18.2 | 0.6±0.0 | 0.6±0.1 | 0.6±0.1 | 0.5±0.1 | 0.6±0.1 |
| 1 and 6 | 18.2 | 0.4±0.0 | 0.4±0.0 | 0.4±0.0 | 0.4±0.0 | 0.4±0.0 |
| 4 and 6 | 18.5 | 0.4±0.0 | 0.4±0.0 | 0.4±0.0 | 0.4±0.0 | 0.4±0.0 |
| 2 and 5 | 18.7 | 0.5±0.0 | 0.5±0.0 | 0.5±0.0 | 0.5±0.5 | 0.5±0.7 |
| 1,2, and 3 | 22.5 | 0.6±0.0 | 0.5±0.0 | 0.5±0.0 | 0.5±0.0 | 0.5±0.0 |
| 3 and 6 | 23.6 | 3.1±3.1 | 3.2±3.1 | 3.1±3.1 | 3.2±3.1 | 3.3±3.1 |
| 1,2,4, and 5 | 27.5 | 0.4±0.0 | 0.4±0.0 | 0.4±0.0 | 0.4±0.0 | 0.4±0.0 |
| 4,5, and 6 | 28.7 | 0.4±0.0 | 0.4±0.0 | 0.4±0.0 | 0.4±0.0 | 0.4±0.0 |
| 1,3,4, and 6 | 32.4 | 0.4±0.0 | 0.4±0.0 | 0.4±0.0 | 0.4±0.0 | 0.4±0.0 |
| 1,2,3, and 5 | 32.5 | 0.4±0.0 | 0.4±0.0 | 0.4±0.0 | 0.4±0.0 | 0.4±0.0 |
| 2,3,5, and 6 | 42.3 | 0.4±0.0 | 0.4±0.0 | 0.4±0.0 | 0.4±0.0 | 0.4±0.0 |
| 1,2,3,4,5, and 6 | 51.0 | 0.4±0.0 | 0.4±0.0 | 0.4±0.0 | 0.4±0.0 | 0.4±0.0 |
Open orientation results
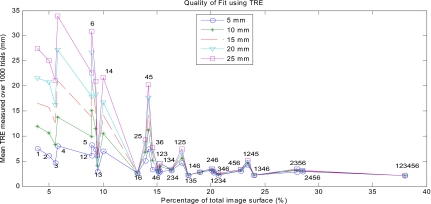
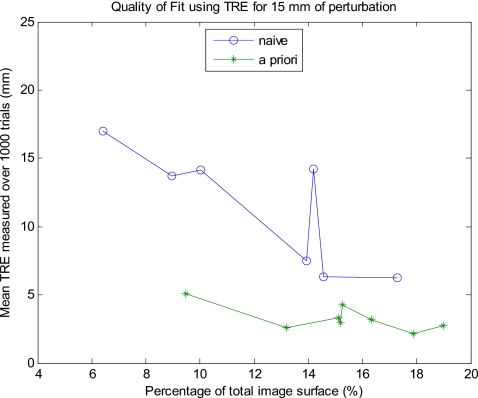
The results for the open orientation suggest that at least 24% of the total surface is needed for an accurate registration, but that less of a percentage can produce an accurate registration when it captures more surface information. Not all combinations of the surface patches were tried, but representative data are shown in Fig. 8. Unlike the laparoscopic results for sequential patches, there was not a clear drop off in the error after a certain percentage of points are acquired. In this case, obtaining about 15% of the total LRS surface points yielded varying results depending on the location of those points. A small a patch as 13% of the total surface with patch combination 1 and 6 resulted in relatively low TREs (on the order of 2.5 mm) for all magnitudes of perturbation as well as low standard deviations (less than 1 mm). The means and standard deviations of the TREs calculated for the combinations of patches tried are shown in Table 3. Additionally, patch combination 1 and 3 (9.5%) consistently produced TREs from 1 to 3 mm less than those produced by larger portions of the surface such as combinations 2 and 5 (14%) and 3 and 6 (14.5%). This result seemed to follow a trend that combinations of patches that included a section from the celiac and dorsal surfaces produced much lower TREs with little variance and were insensitive to initial alignment. For example, the lateral celiac (patch 1) and the medial dorsal (patch 6) sections produce the most favorable TREs (∼2.5 mm) for any two patches combined. The curvature information from the celiac and dorsal surfaces is needed to “lock” the surface in during the ICP. Further, surface patch combinations that did not contain patches from both ends of the surface (1; 2; 1 and 4; 2 and 5; and 3 and 6) generated high TREs on the order of 20 mm (the spikes in the graph) with larger standard deviations, which increased with higher magnitudes of perturbation. This finding suggests that the sides of the kidney are not as geometrically descriptive as the celiac and dorsal surfaces. However, if a patch combination contains information from the celiac, dorsal, medial, and lateral surfaces, then the mean TRE will further decrease for all magnitudes of perturbation. Such patch combinations include 2, 4 and 6; 1, 2 and 3; and 4, 5, and 6. This outcome is also why the patch combination of 1 and 6 produced such low TREs. Thus, one must use care when choosing which part of the kidney surface to unveil in order to maximize its ability to be accurately registered. Determining which parts of the kidney’s surface are the most descriptive preoperatively would be prudent when planning the surgical exposure. Using these portions of the surface will decrease registration errors while using the least amount of surface. By using this a priori knowledge of the kidney surface, the TRE significantly drops for a given percentage of the total surface and this holds true for the variety of percentages tested. This effect for 15 mm of perturbation is shown in Fig. 9, where the “a priori” results represent errors yielded with careful preoperatively planning and the “naïve” results represent no preoperative planning.
Figure 8.
Mean TRE for different magnitudes of perturbation in the open orientation.
Table 3.
Mean±standard deviation of TRE (mm) for open orientation of phantom.
| Portion of total surface | Magnitude of perturbation (mm) | |||||
|---|---|---|---|---|---|---|
| Patch No. | Percentage (%) | 5 | 10 | 15 | 20 | 25 |
| 1 | 3.89 | 7.5±4.0 | 12.0±6.6 | 16.6±9.3 | 21.5±11.5 | 27.5±16.0 |
| 2 | 4.98 | 6.1±3.1 | 10.6±6.2 | 15.8±9.9 | 20.8±13.5 | 25.0±15.6 |
| 1 and 3 | 9.48 | 3.0±1.2 | 4.1±2.1 | 5.1±2.7 | 5.6±3.0 | 6.2±3.3 |
| 1 and 4 | 10.0 | 7.0±3.7 | 10.5±6.6 | 14.2±9.6 | 16.7±12.4 | 21.6±17.9 |
| 1 and 6 | 13.2 | 2.6±0.7 | 2.6±0.6 | 2.6±0.6 | 2.6±0.6 | 2.6±0.6 |
| 2 and 5 | 14.0 | 5.1±2.0 | 6.8±2.3 | 7.5±2.6 | 8.4±3.1 | 9.3±4.1 |
| 3 and 6 | 14.6 | 3.3±1.7 | 5.2±3.5 | 6.4±4.3 | 7.1±4.5 | 7.8±4.8 |
| 4 and 6 | 15.1 | 3.0±0.7 | 3.2±0.8 | 3.3±0.8 | 3.4±0.8 | 3.5±0.7 |
| 1,2, and 3 | 15.2 | 2.7±0.7 | 2.7±0.7 | 3.0±0.7 | 3.1±0.7 | 3.2±0.7 |
| 1,3, and 4 | 15.3 | 3.0±1.2 | 3.9±1.7 | 4.3±2.0 | 4.5±2.1 | 4.5±2.1 |
| 2,4, and 6 | 20.1 | 3.1±0.7 | 3.2±0.8 | 3.3±0.9 | 3.4±1.0 | 3.5±1.0 |
| 4,5, and 6 | 22.8 | 3.0±0.9 | 3.1±0.9 | 3.3±0.9 | 3.4±0.9 | 3.4±0.9 |
| 1,2,4, and 5 | 23.4 | 4.3±1.6 | 4.5±1.7 | 4.7±1.7 | 4.8±1.8 | 5.2±3.0 |
| 1,3,4, and 6 | 24.0 | 2.2±0.2 | 2.2±0.2 | 2.2±0.2 | 2.3±0.2 | 2.2±0.2 |
| 2,3,5, and 6 | 28.0 | 2.5±0.7 | 3.2±0.9 | 3.3±1.0 | 3.3±1.0 | 3.5±1.2 |
| 1,2,3,4,5, and 6 | 38.0 | 2.1±0.1 | 2.1±0.1 | 2.1±0.1 | 2.1±0.1 | 2.1±0.1 |
Figure 9.
A priori vs naïve approach to obtaining intraoperative surface.
The RMS error results followed the same pattern as the TRE results with the exception of patches 2 and 5; and 3 and 6. RMS data are shown in Fig. 10 and Table 4. The RMS error for combination 2 and 5 was lower than for combination 3 and 6, whereas the TRE for combination 2 and 5 was higher than combination 3 and 6. The RMS errors were on the order of 4 mm, whereas TREs were much larger, on the order of 30 mm. Nevertheless, the RMS errors yielded the same implications as the TRE data, suggesting that the RMS errors for the laparoscopic orientation are a good estimate of actual TREs.
Figure 10.
Mean RMS error over different magnitudes of perturbation in the open orientation.
Table 4.
Mean±standard deviation of RMS error (mm) for open orientation of phantom.
| Portion of total surface | Magnitude of perturbation (mm) | |||||
|---|---|---|---|---|---|---|
| Patch No. | Percentage (%) | 5 | 10 | 15 | 20 | 25 |
| 1 | 3.89 | 7.5±4.0 | 12.0±6.6 | 16.6±9.3 | 21.5±11.5 | 27.5±16.0 |
| 2 | 4.98 | 6.1±3.1 | 10.6±6.2 | 15.8±9.9 | 20.8±13.5 | 25.0±15.6 |
| 1 and 3 | 9.48 | 3.0±1.2 | 4.1±2.1 | 5.1±2.7 | 5.6±3.0 | 6.2±3.3 |
| 1 and 4 | 10.0 | 7.0±3.7 | 10.5±6.6 | 14.2±9.6 | 16.7±12.4 | 21.6±17.9 |
| 1 and 6 | 13.2 | 2.6±0.7 | 2.6±0.6 | 2.6±0.6 | 2.6±0.6 | 2.6±0.6 |
| 2 and 5 | 14.0 | 5.1±2.0 | 6.8±2.3 | 7.5±2.6 | 8.4±3.1 | 9.3±4.1 |
| 3 and 6 | 14.6 | 3.3±1.7 | 5.2±3.5 | 6.4±4.3 | 7.1±4.5 | 7.8±4.8 |
| 4 and 6 | 15.1 | 3.0±0.7 | 3.2±0.8 | 3.3±0.8 | 3.4±0.8 | 3.5±0.7 |
| 1,2, and 3 | 15.2 | 2.7±0.7 | 2.7±0.7 | 3.0±0.7 | 3.1±0.7 | 3.2±0.7 |
| 1,3, and 4 | 15.3 | 3.0±1.2 | 3.9±1.7 | 4.3±2.0 | 4.5±2.1 | 4.5±2.1 |
| 2,4, and 6 | 20.1 | 3.1±0.7 | 3.2±0.8 | 3.3±0.9 | 3.4±1.0 | 3.5±1.0 |
| 4,5, and 6 | 22.8 | 3.0±0.9 | 3.1±0.9 | 3.3±0.9 | 3.4±0.9 | 3.4±0.9 |
| 1,2,4 and 5 | 23.4 | 4.3±1.6 | 4.5±1.7 | 4.7±1.7 | 4.8±1.8 | 5.2±3.0 |
| 1,3,4 and 6 | 24.0 | 2.2±0.2 | 2.2±0.2 | 2.2±0.2 | 2.3±0.2 | 2.2±0.2 |
| 2,3,5, and 6 | 28.0 | 2.5±0.7 | 3.2±0.9 | 3.3±1.0 | 3.3±1.0 | 3.5±1.2 |
| 1,2,3,4,5, and 6 | 38.0 | 2.1±0.1 | 2.1±0.1 | 2.1±0.1 | 2.1±0.1 | 2.1±0.1 |
DISCUSSION AND CONCLUSION
These preliminary experiments imply that image-guided kidney surgery using current IGS techniques for soft tissue is feasible with a reasonable amount of the kidney unveiled during the procedure. Both the laparoscopic and open orientation experiments gave promising results in that just 28% of the total surface was enough to provide an accurate surface-based registration for the kidney. This varied by orientation and patch selection but 28% provided acceptable TRE values for all orientations and patch combinations. The variability between orientations and combination of patches could be due to one of two possible reasons.
-
(1)
Some patches are more geometrically descriptive than others. That is, because surface rotational symmetry is broken in these patches, the ICP registration search can “dip” to a distinct minimal distance. We define broken rotational symmetry as areas where the surface curvature is irregular. Clearly additional development of the effect of curvature needs to be done perhaps in conjunction with a weighting term that penalizes unveiling patches a long distance from the surgical target.
-
(2)
The patches in some way bound the possible transformation solution by providing information on the six surfaces (cephalic, caudal, lateral medial, celiac, and dorsal based on anatomic locations).
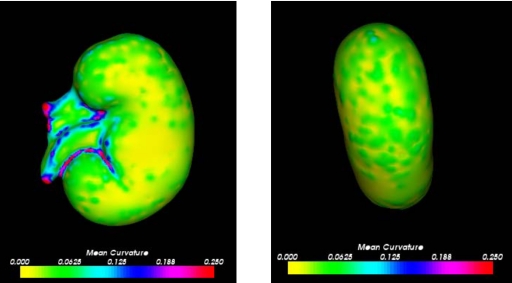
The laparoscopic orientation had an “unfair” advantage over the open partial nephrectomy orientation because it exposed more descriptive properties of the kidney. This view of the surface contained anatomical features, such as the ureter and the renal artery and vein. These anatomical features provided a more geometrically descriptive properties of the kidney surface, resulting in lower errors. For instance, the surface subsets of 22% and higher for the sequential patches contained the ureter and the renal artery and vein, thus providing an explanation for the success of these surface subsets. Similarly, for the random patch experiment we would expect any patch combination containing patch 5 or 6 to yield relatively low RMS errors since these patches contain the anatomical descriptive features. However, the errors for patch 6 and patch combination 3 and 6 were surprisingly high for all magnitudes of perturbation. Although, according to the theory that subsets only containing information from one side of the kidney perform poorly, the patch combination 3 and 6 is from the caudal surface and produced similar errors to patch combination 1 and 4, which contained information only from the cephalic surface. Also, it is expected that the single patches 1–6 would produce high errors since there was simply not enough of the total surface. It was anticipated that patch 6 would have performed more like patch 5. On the other hand, patch combination 2 and 3 unexpectedly yielded low RMS errors for all perturbation magnitudes. This surface subset did not contain a relatively large percentage of the surface, information from opposite sides of the kidney, nor any anatomical features. Thus, it was unanticipated that it would be able to accurately predict a registration for the rest of the surface. A reason for the success of the patches containing the renal artery and vein is because they possess the greatest changes in curvature. The right side of Fig. 11 indicates that these anatomical features have the greatest changes in curvature on the entire kidney’s surface. Therefore, obtaining intraoperative surfaces with relatively high curvature will yield the most accurate surface-based registrations.
Figure 11.
Mean curvature over kidney surface: laparoscopic orientation (left) and open orientation (right).
The findings from the open orientation experiment demonstrate that a threshold for an accurate registration is dependent upon geometric surface properties. Patches 1, 3, 4, and 6 contained more descriptive information since they covered the furthest points on the kidney (they were part of the celiac and dorsal surfaces). Any combination of regions that contained at least one region from the celiac surface and from the dorsal surface produced better registrations, regardless of the percentage of the total surface. For example, using region combination 1 and 6 produced low errors since it contained information from the celiac and dorsal surfaces, and both the lateral and medial sides of the kidney. The ends of the kidney were needed to lock the surface into place and ensure an accurate registration for the rest of the kidney. However, regions 2, 3, 5, and 6; and 1, 2, 4, and 5 produced relatively low TREs considering they contained a larger percentage of the total surface. These two patch combinations did not contain information from both the celiac and dorsal sides of the surface. Thus, points that covered more of the kidney surface, although not necessarily sequential as in the laparoscopic orientation, produce lower TREs. Surfaces that did not contain information from both the celiac and dorsal surfaces and were less than 20% of the surface were poor predictors for an accurate registration since they were not geometrically descriptive enough.
So our results are that a surgeon must unveil at least 28% of the kidney surface. This would ensure that despite its location, the kidney’s exposed surface should be enough to produce robust surface-based registrations. However, we believe a more elegant approach is possible requiring less removal of perirenal fat and the resultant improvement in patient outcome. If patches can be selected based on surface properties extracted from the preoperative tomograms, then better registrations can be obtained with smaller exposures. Our anthropomorphic phantom showed little variation in coordinate transform curvature, however, areas with greater change in curvature were demonstrated to provide good registrations with smaller patches. In addition, our investigations showed that having bounding patches locked the registration in place.
There are two questions still to be addressed here. Can we quantify patch location and size to do bounding? We are investigating the role surface normals may play in patch selection. The second, and perhaps more important issue, is how do we transfer the patch locations to the kidney? The purposes of the patches is for registration, therefore they are obtained prior to registration. If the bounding patch method proves to require the smallest percentage of the surface but requires that the surgeon either reach or view all six sides of the kidney, have we reduced the invasiveness of the procedure? Last, in a project beyond the scope of this article, we are investigating the deformations of the surface caused by the clamping of the renal vessels. While we have demonstrated that surface registration is possible for guiding partial nephrectomies, our next steps will be to implement this in a clinical setting while refining techniques on patch identification.
ACKNOWLEDGMENTS
This work was supported by the NIH R44 Grant No. CA 115263. The authors would like to thank Dr. Michael Miga for his valuable input to the curvature discussion of the article. The authors would also like to thank Debbie Deskins, Dahl Irving, and Jerry DeWitt in Vanderbilt University’s Department of Radiology for their aid in acquiring CT images of the phantom. In addition, the authors would like to acknowledge Dr. Cookson and Dr. Chang, as well as the nursing staff of urology for their assistance in the OR. Some of the code was provided by Prashanth Dumpari, Dr. David Cash, and Dr. Tuhin Sinha. A number of algorithms developed in this work were developed using the Visualization Toolkit.26
References
- Drucker B. J., “Renal cell carcinoma: current status and future prospects,” Cancer Treat Rev. 31, 536–545 (2005). [DOI] [PubMed] [Google Scholar]
- Cookson M. S., “Radical nephrectomy,” in Glenn’s Urologic Surgery, 5th ed., edited by Graham S. D. (Lippincott-Raven, Philadelphia, 1998), pp. 61–72. [Google Scholar]
- Novick A. C., “Partial nephrectomy,” in Glenn’s Urologic Surgery, 5th ed., edited by Graham S. D. (Lippincott-Raven, Philadelphia, 1998), pp. 51–60. [Google Scholar]
- Orvieto M. et al. , “Simplifying laparoscopic partial nephrectomy: Technical considerations for reproducible outcomes,” Adult Urology 66, 976–980 (2005). [DOI] [PubMed] [Google Scholar]
- Fergany A. F., Hafez K. S., and Novick A. C., “Long-term results of nephron sparing surgery for localized renal cell carcinoma: 10-year followup,” J. Urol. (Baltimore) 163, 442–445 (2000). [PubMed] [Google Scholar]
- Godley P. A. and Ataga K. I., “Renal cell carcinoma,” Curr. Opin. Oncol. 12, 260–264 (2000). [DOI] [PubMed] [Google Scholar]
- Vogelzang N. J. and Stadler W. M., “Kidney cancer,” Lancet 352, 1691–1696 (1998). [DOI] [PubMed] [Google Scholar]
- Galloway R. L., Edwards C. A., Lewis J. T., and Maciunas R. J., “Image display and surgical visualization in interactive, image-guided neurosurgery,” Opt. Eng. (Bellingham) 10.1117/1.2171239 32, 1955–1962 (1993). [DOI] [Google Scholar]
- Maciunas R. J., Galloway R. L., Fitzpatrick J. M., and Allen G. S., “Lateral ventricular tumors treated using techniques of interactive image-guided neurosurgery,” Techn. Neurosurg. 4, 67–84 (1998). [Google Scholar]
- Interactive, Image-Guided Neurosurgery, edited by Maciunas R. J. (Williams and Wilkins, Baltimore, 1993). [Google Scholar]
- Herring J. L., Dawant B. M., Muratore D., Maurer C. R., Galloway R. L., and Fitzpatrick J. M., “Surface-based registration of CT images to physical space for image-guided surgery of the spine,” IEEE Trans. Med. Imaging 10.1109/42.736029 17, 743–752 (1998). [DOI] [PubMed] [Google Scholar]
- Herline A. J., Stefansic J. D., Debelak J. P., Hartman S., Pinson C. W., Galloway R. L., and Chapman W. C., “Studies in the feasibility of interactive image-guided liver surgery,” IEEE Trans. Med. Imaging 134, 644–669 (1999). [Google Scholar]
- Stefansic J. D., Herline A. J., Shyr Y., Chapman W. C., Fitzpatrick J. M., and Galloway R. L., “Registration of physical space to laparoscopic image space for use in minimally invasive hepatic surgery,” IEEE Trans. Med. Imaging 19, 1012–1023 (2000). [DOI] [PubMed] [Google Scholar]
- Cash D. M., Sinha T. K., Chapman W. C., Galloway R. L., and Miga M. I., “Compensating for intra-operative soft tissue deformations using incomplete surface data and finite elements,” IEEE Trans. Med. Imaging 10.1109/TMI.2005.855434 24, 1479–1491 (2005). [DOI] [PubMed] [Google Scholar]
- Warmath J. R., Herline A. J., Clements L. W., Bao P., and Galloway R. L., “Development of a 3-D freehand endorectal ultrasound system for use in rectal cancer staging,” Med. Phys. 10.1118/1.1925228 32, 1757–1766 (2005). [DOI] [PubMed] [Google Scholar]
- C. R.Maurer, Jr., Fitzpatrick J. M., Wang M. Y., R. L.Galloway, Jr., Maciunas R. J., and Allen G. S., “Registration of head volume images using implantable fiducial markers,” IEEE Trans. Med. Imaging 10.1109/42.611354 16, 447–462 (1997). [DOI] [PubMed] [Google Scholar]
- Cash D. M., Sinha T. K., Chapman W. C., Terawaki H., Dawant B. M., Galloway R. L., and Miga M. I., “Incorporation of a laser range scanner into image-guided liver surgery: Surface acquisition, registration, and tracking,” Med. Phys. 10.1118/1.1578911 30, 1671–1682 (2003). [DOI] [PMC free article] [PubMed] [Google Scholar]
- Schlichter A., Schubert R., Werner W., Zermann D. H., and Schubert J., “How accurate is diagnostic imaging in determination of size and multifocality of renal cell carcinoma as a prerequisite for nephron-sparing surgery?,” Urol. Int. 64, 192–197 (2000). [DOI] [PubMed] [Google Scholar]
- Mayo, Clinic, Rochester MN, http://www.mayo.edu/bir.
- Lorensen W. E. and Cline H. E., “Marching cubes: A high resolution 3D surface construction algorithm,” ACM Comput. Graphics 21, 163–169 (1987). [Google Scholar]
- Besl P. J. and Mckay N. D., “A method for registration of 3-D shapes,” IEEE Trans. Pattern Anal. Mach. Intell. 10.1109/34.121791 14, 239–256 (1992). [DOI] [Google Scholar]
- Zhang Z. Y., “Iterative point matching for registration of free-form curves and surfaces,” Int. J. Comput. Vis. 10.1007/BF01427149 13, 119–152 (1994). [DOI] [Google Scholar]
- Friedman J. H., Bentley J. L., and Finkel R. A., “An algorithm for finding best matches in logarithmic expected time,” ACM Trans. Math. Softw. 10.1145/355744.355745 3, 209–226 (1977). [DOI] [Google Scholar]
- West J. et al. , “Comparison and evaluation of retrospective intermodality brain image registration techniques,” J. Comput. Assist. Tomogr. 10.1097/00004728-199707000-00007 21, 554–566 (1997). [DOI] [PubMed] [Google Scholar]
- Sander P. T. and Zucker S. W., “Tracing surfaces for surfacing traces,” Proceedings of the First International Conference Comput. Vision, London, 8–11 June 1987, pp. 231–240 (unpublished).
- http://www.vtk.org.


