Abstract
This work presents extensive investigations to evaluate the robustness (intradosimeter consistency and temporal stability of response), reproducibility, precision, and accuracy of a relatively new 3D dosimetry system comprising a leuco-dye doped plastic 3D dosimeter (PRESAGE) and a commercial optical-CT scanner (OCTOPUS 5× scanner from MGS Research, Inc). Four identical PRESAGE 3D dosimeters were created such that they were compatible with the Radiologic Physics Center (RPC) head-and-neck (H&N) IMRT credentialing phantom. Each dosimeter was irradiated with a rotationally symmetric arrangement of nine identical small fields (1×3 cm2) impinging on the flat circular face of the dosimeter. A repetitious sequence of three dose levels (4, 2.88, and 1.28 Gy) was delivered. The rotationally symmetric treatment resulted in a dose distribution with high spatial variation in axial planes but only gradual variation with depth along the long axis of the dosimeter. The significance of this treatment was that it facilitated accurate film dosimetry in the axial plane, for independent verification. Also, it enabled rigorous evaluation of robustness, reproducibility and accuracy of response, at the three dose levels. The OCTOPUS 5× commercial scanner was used for dose readout from the dosimeters at daily time intervals. The use of improved optics and acquisition technique yielded substantially improved noise characteristics (reduced to ∼2%) than has been achieved previously. Intradosimeter uniformity of radiochromic response was evaluated by calculating a 3D gamma comparison between each dosimeter and axially rotated copies of the same dosimeter. This convenient technique exploits the rotational symmetry of the distribution. All points in the gamma comparison passed a 2% difference, 1 mm distance-to-agreement criteria indicating excellent intradosimeter uniformity even at low dose levels. Postirradiation, the dosimeters were all found to exhibit a slight increase in opaqueness with time. However, the relative dose distribution was found to be extremely stable up to 90 h postirradiation indicating excellent temporal stability. Excellent interdosimeter reproducibility was also observed between the four dosimeters. Gamma comparison maps between each dosimeter and the average distribution of all four dosimeters showed full agreement at the 2% difference, 2 mm distance-to-agreement level. Dose readout from the 3D dosimetry system was found to agree better with independent film measurement than with treatment planning system calculations in penumbral regions and was generally accurate to within 2% dose difference and 2 mm distance-to-agreement. In conclusion, these studies demonstrate excellent precision, accuracy, robustness, and reproducibility of the PRESAGE∕optical-CT system for relative 3D dosimetry and support its potential integration with the RPC H&N credentialing phantom for IMRT verification.
Keywords: 3D dosimetry, optical-CT, PRESAGE, radiation, quality assurance
INTRODUCTION
The Radiological Physics Center (RPC) head and neck (H&N) intensity modulated radiation therapy (IMRT) credentialing phantom test is routinely taken by institutions that wish to participate in the H&N clinical trial protocols.1 The dosimetry for credentialing comprises point dose verification whereby eight thermoluminescent dosimeters located inside the planning-target-volume and organ-at-risk record the dose, which is then compared with the planned dose. Also, 2D dose distributions recorded into central axial and sagittal plane films are compared with planning calculations. A lenient passing criterion of 7% dose difference and 4 mm distance-to-agreement is employed for dosimetric evaluations. It has been reported that 25% of the institutions fail the credentialing test at first attempt2 in spite of the generous verification criteria. The significant failure rate in point and 2D comparisons emphasize the urgent need for comprehensive 3D dosimetry tools, which could potentially catch more errors that were not detected by the TLD and central plane comparisons. This work presents rigorous investigations into the feasibility of a relatively new 3D dosimetry system, PRESAGE∕optical CT, in the context of 3D dosimetry in the RPC H&N IMRT phantom.
In 2003, a novel 3D dosimeter was introduced (PRESAGE),3 which had many favorable characteristics for optical-CT dose readout4 including stability in clinical settings, linear radiochromic (light absorbing not light scattering) response to radiation and nonrequirement of external containers. The potential of the PRESAGE∕optical-CT system as a practical, 3D, dosimetric quality assurance tool in the clinic was recognized5, 6, 7, 8 and Guo et al. reported the first investigations into its feasibility.5 Guo et al. demonstrated that encouraging agreement (4% dose difference, 4 mm distance-to-agreement gamma level) between planned dose distribution and measured 3D dose readout from the PRESAGE∕optical-CT system could be achieved in spite of limitations presented by edge artifacts (∼8 mm from edge) and noise in reconstruction (∼4%). Subsequent publications also reinforced the potential of PRESAGE as a clinically viable 3D dosimeter.7, 8, 9
Most of the previous studies used snapshot 3D dose readout from the PRESAGE∕optical-CT system for comparison with treatment planning system calculations and independent 2D film measurements. However, critical issues of robustness (intradosimeter consistency and temporal stability of response), reproducibility, precision, and accuracy of 3D dosimetry are yet to be addressed in sufficient detail. Some robustness and reproducibility properties of PRESAGE were previously characterized by Guo et al.6 For example, encouraging interdosimeter reproducibility and temporal stability of response have been demonstrated.6 These results were based on laser beam scanning 1D profile measurements [optical density (OD) change] in 1 cm cuvettes of PRESAGE material. A comprehensive 3D analysis of robustness and reproducibility for multiple dose levels and depths is still lacking in the literature. Such an evaluation is critical to the clinical establishment of the PRESAGE∕optical-CT 3D dosimetry system.
In this study, experiments were specifically conducted to evaluate robustness (intradosimeter uniformity and temporal stability of response), interdosimeter reproducibility and accuracy of radiochromic response for multiple dose levels and in 3D for PRESAGE dosimeters compatible with the RPC H&N phantom. This was achieved by irradiating multiple 3D dosimeters with an identical treatment plan, tracking the readout at periodic time intervals and intercomparison of the readouts. The treatment plan was carefully designed to facilitate rigorous investigation of these characteristics.
MATERIALS AND METHODS
Four identical RPC H&N phantom compatible PRESAGE inserts (Sec. 2A) were irradiated with a rotationally symmetric treatment plan (Sec. 2B). The treatment plan was designed such that the dose distribution in any axial plane was divided into three identical sectors and identical dose distributions were recorded in each sector. There was only a slight variation of dose distribution along the long axis. The 3D radiochromic response of the dosimeters was readout periodically using the OCTOPUS 5× optical-CT scanner (operating details in Sec. 2C). The regions receiving identical dose should elicit identical radiochromic response (change in OD or attenuation). This was the basis for the evaluation of intradosimeter uniformity of response. The radiochromic response of the dosimeters was tracked at 24 h intervals postirradiation to evaluate temporal stability. Readouts from the four dosimeters were compared to evaluate interdosimeter reproducibility of measurement. The accuracy and precision of the dose readout was evaluated by comparison with an independent 2D measurement (GAFCHROMIC® EBT film; Sec. 2D) in the central axial plane. Calculations from the treatment planning system (ECLIPSE® version 8.1, Varian Medical Systems, Inc., Palo Alto, CA) were also used in comparative analysis. Data analysis tools and procedures for various evaluations are described in Sec. 2E.
PRESAGE 3D dosimeters
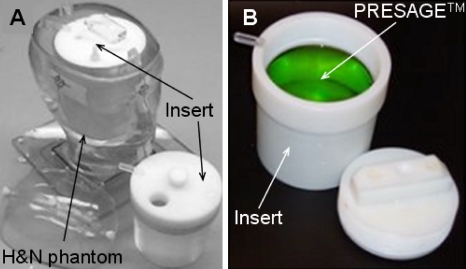
PRESAGE™ dosimeters (Heuris Pharma LLC, Skillman, NJ) were molded from the same batch of premold mixture comprising a solvent, leuco dye, and free radical initiator. The solid, radiochromic plastic dosimeters were 10 cm diameter cylinders with a length of 8 cm along the long axis and were prepared to fit inside a standard RPC H&N phantom designed to hold 3D cylindrical dosimeters (Fig. 1). Radiochromic properties of PRESAGE have been well characterized.6, 10, 11, 12, 13 The sensitivity, stability, effective atomic number (Z), density, and hardness can be altered by varying the formulation of the premold mixture. The formulation used in this study had an effective Z number of 8.3, a physical density of 1.07 g∕cm3, and a CT number of ∼180. The radiochromic response was linear with sensitivity of 0.045 OD change for a 1 cm path length and 1 Gy delivered dose as determined spectrophotometrically. Based on calculation method recommended by Xu et al.14 it was estimated that a dose of 4 Gy delivered over a path length of 3 cm, over which maximum OD change occurs, would result in an optimal response.
Figure 1.
Photograph of a PRESAGE 3D dosimeter that was designed to fit as an insert inside the RPC H&N credentialing phantom.
Treatment planning and delivery
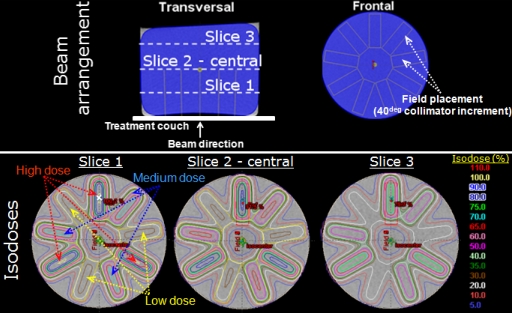
A treatment planning x-ray CT scan (slice thickness of 1.25 mm) of a dosimeter was acquired. For the CT scan, the dosimeter was placed with its flat circular face on the CT couch. The low dose (∼1 cGy) of the x-ray CT did not induce any OD change in the dosimeter.5 The CT data was exported to a commissioned ECLIPSE® treatment planning workstation where the treatment plan was designed. The treatment plan shown in Fig. 2 was designed to facilitate rigorous investigation of robustness (intradosimeter uniformity and temporal stability), reproducibility and accuracy of response of the dosimeters in 3D and at multiple dose levels. The gantry was positioned at 180° with SSD calculated to be 96.6 cm. Nine rotationally symmetrical (collimator increments of 40°) open field (1×3 cm2) beams were placed. The central axes of all fields were parallel and coincident with the cylindrical axis of the dosimeter, but the field positions were offset to create a symmetric pattern in axial cross section, resembling the spokes of a wheel. Starting with the first field (collimator rotation 0°), a repetitious sequence of three dose levels (high, medium, and low dose) was planned, such that the dose distribution in any axial plane was divided into three identical sectors of 120°. In effect, the planned dose distribution in any axial plane was rotationally symmetric, i.e., identical if rotated by 120° or 240°. In the dose prescription plane (first slice in Fig. 2), a dose of 100% at 4 Gy was planned to the center of the high dose beam. The medium dose and low dose beams were weighted to 72% (2.88 Gy) and 32% (1.28 Gy) of 4 Gy, respectively. Beam energy was 6 MV. This beam arrangement produced a dose range from 4 Gy (100%) to 1.28 Gy (32%) in the center of the open fields with penumbral doses going down to 6% at a distance of 8 mm from the center of the low dose field. Although the dose distribution was highly modulated in axial planes, there was only a slight variation along the long axis. The standard pencil beam algorithm in ECLIPSE was used to calculate the 3D dose distribution (spatial resolution of 1.25 mm) delivered by the treatment plan.
Figure 2.
Treatment planning and irradiation of PRESAGE inserts. The PRESAGE inserts were placed with their flat face on the treatment couch. The gantry was rotated to 180° and beams were placed in an axially symmetric pattern shown in the top row. Three dose groups of high, medium and low dose (100%, 72%, and 32% beam weighting) were delivered alternately through the open beams to generate symmetric dose distribution at all depths as shown in the second row. The crossmark in slice 1 represents the dose prescription point where a dose of 4 Gy was prescribed.
The significance of this treatment plan was that, a rotationally symmetric and highly modulated dose distribution is achieved at all depths, with three regions within an axial plane receiving identical dose distribution thereby enabling rigorous investigation of intradosimeter consistency, temporal variation, and interdosimeter reproducibility of response for multiple dose levels. The setup and delivery (detailed in next paragraph) were reproducible to within 1 mm thereby facilitating accurate EBT film dosimetry in the axial plane for independent verification.
On the day of irradiation, gantry rotation (180°) and SSD (96.6 cm) were set commensurate with the plan. The primary challenge was to accurately and reproducibly deliver the small fields in a rotationally symmetric manner to the four dosimeters and for EBT verification. This was achieved by performing rigorous quality assurance tests for rotational symmetry. The collimator jaws were opened and rotated over 360° to test the rotational consistency of large fields. Thedosimeter was placed with its flat circular face on the treatment couch such that the long axis coincided with the collimator cross hair. The small field size (1×3 cm2) defined by the collimator jaws was set. Before delivery of the beams, the small field was again rotated over 360° to ascertain rotational consistency. Quality assurance tests showed that an accurate and reproducible setup could be achieved to within 1 mm error. After careful setup, monitor units calculated by the ECLIPSE planning system were delivered through the nine small fields. Irradiated dosimeters were immediately placed in the refrigerator (4 °C) before dose readout.
Optical-CT scanning of the dosimeters
The OCTOPUS™ 5× optical-CT scanner (MGS Research Inc., Madison, CT), which is an upgrade over previously used apparatus,5 was used for 3D dose readout. The upgrade facilitated ∼5× faster scanning because of manufacturer recommended hardware and software alterations. The hardware alterations included a new turntable with improved docking mechanism (enabled reproducible docking of phantoms), elimination of reference diode for higher sampling rate and changes in motor axes configurations to facilitate synchronized linear projection, and turntable rotation. The software alterations included new driver software which includes an interface to automatically∕manually optimize the speed and acceleration of the motors driving the linear projection and angular rotation such that the overall scan time is minimized. The manufacturer discontinued the use of the reference diode in the OCTOPUS™ 5× scanner for higher sampling rate but has accounted for the laser drift and output variation in the driver software, where each linear projection scan is normalized to the same point in the fluid. To ensure identical output performance of the scanner on different days, same refractive index matching fluid was used for all scans. The fluid was filtered before each scan to remove suspended impurities.
The dosimeters were scanned before (prescan) and after (postscan) irradiation. The 3D scan consisted of 15 slices separated by a coarse interslice spacing of 5 mm because the dose distribution was expected to show only a gradual variation in that dimension. The scanner was optimally configured for a pixel size of 1 mm and a total of 168 pixels comprised a linear projection scan. Based on the image matrix and pixel size, the driver software recommended acquisition of 600 projections (0.6° separation) per slice for compliance with the Nyquist sampling criteria. Scanning time for a single slice was about 8–9 min. The 3D distribution of OD or attenuation (units: ∕m) was reconstructed using in-house MATLAB software (Mathworks, Natic, MA) based on the filtered backprojection algorithm. The reconstructed cube had a spatial resolution of 1 mm×1 mm×5 mm. After every scan, the dosimeters were placed in the refrigerator and were repeatedly scanned at 24 h time intervals to monitor temporal stability of radiochromic response.
Independent 2D EBT film measurement
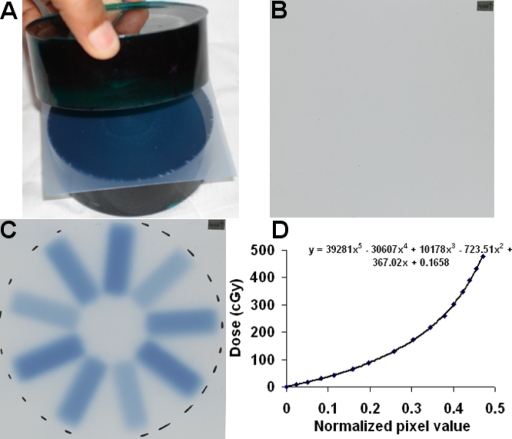
A major advantage of the treatment plan described in Sec. 2B was that the dose distribution was amenable to accurate EBT film verification, which facilitated resolution of discrepancies between PRESAGE∕OCTOPUS dose-readout and ECLIPSE® calculations. The GAFCHROMIC® EBT film (ISP corporation, NJ)∕EPSON® Perfection 4990 flatbed scanning system has been described previously5 and has many advantages including energy and directional independence, temporal stability, and practical convenience (e.g., self-development).5, 15 A dosimeter was cut into two pieces and an EBT film was inserted (see Fig. 3). The dosimeter together with the inserted film was then irradiated by the same treatment plan delivered to the whole dosimeters with the same setup precautions to ensure symmetric delivery. A calibration curve was also acquired for the EBT film response at the time of experimental irradiation. The EBT film (preirradiation, postirradiation, and calibration curve) was scanned using an EPSON® Perfection 4990 flat-bed scanner in transmission mode the day after irradiation (storage at room temperature) to ensure complete response. The red color channel of the scanned EBT film images was extracted for analysis because EBT has a maximum response to red light. The calibration curve was applied to the radiation induced pixel value change in EBT film scans to enable conversion to dose (henceforth called EBT dose). EBT dose was acquired for only one slice because the dose distribution did not vary appreciably with depth.
Figure 3.
Independent 2D verification using GAFCHROMIC EBT film. (a) After the PRESAGE insert was scanned by optical-CT, it was cut into two sections. EBT film was inserted at the cut plane to provide independent 2D measurement of the dose distributions in this plane. (b) Preirradiation scan of EBT film, (c) postirradiation scan, and (d) calibration curve used to convert to dose distribution.
Data analysis
The optical-CT datasets from four dosimeters acquired at periodic time intervals were analyzed to evaluate intradosimeter consistency, temporal stability, and reproducibility of radiochromic response in 3D. The radiochromic response in the dosimeters (net OD or net attenuation) was estimated by subtracting prescans from postscans. For PRESAGE dosimeters, the net distribution is directly proportional to dose5 and a map of net distribution is a measure of relative dose distribution in that plane. The accuracy of the PRESAGE dose was evaluated by comparison with registered EBT dose in lieu of inaccuracies of the ECLIPSE® calculations (referred as an ECLIPSE dose) in high dose-gradient regions.5 Comparison of the PRESAGE dose with the ECLIPSE dose was also evaluated to resolve the extent and distribution of inaccuracies in modeling. 3D dose registration, processing and analysis were done in DoseQA software.18 Profiles and gamma comparison tools were used as measures of agreement∕disagreement. While profiles remain an excellent metric for agreement∕disagreement, 3D analysis using profile comparisons would be cumbersome. The gamma comparison metric16, 17 was used because it combines dose difference and distance-to-agreement criteria into a single quantitative index to facilitate straightforward assessment of failure in 3D. The detailed methodology for data-analysis metrics and tools to evaluate robustness, reproducibility, and accuracy are presented below.
Intradosimeter uniformity of radiochromic response
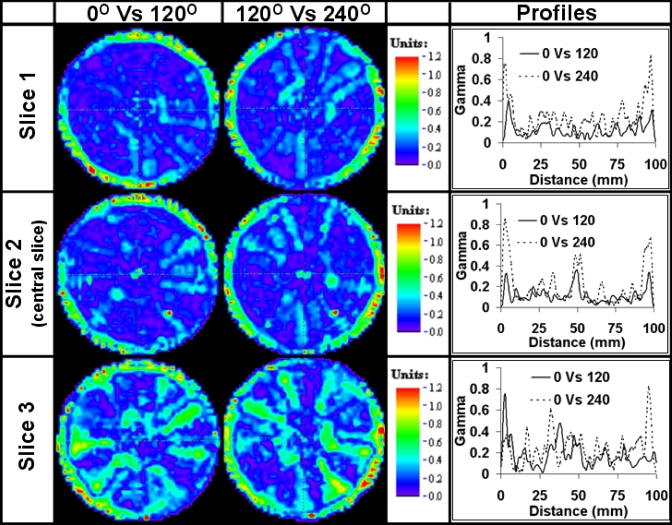
The rotationally symmetric dose distribution and delivery of the treatment plan (described in Sec. 2B) provided an excellent model to evaluate the intradosimeter uniformity of response for multiple doses and in 3D. The basis for this evaluation was that the cylindrical dose distributions should be identical if rotated by 120° and∕or 240°. PRESAGE dose distributions from a dosimeter were loaded three times into DoseQA under different names. One distribution was rotated by 120° and another distribution was rotated by 240°. The three distributions were then evaluated for differences using profiles and gamma maps [2% dose difference, 1 mm distance-to-agreement (DTA) criteria]. The 2% dose-difference criterion was very stringent considering the highly modulated dose distribution with very low penumbral doses and potential for noise in measurement. The 1 mm DTA criterion accounted for ∼1 mm setup error.
Temporal stability of response
Radiochromic responses of each dosimeter at daily (24 h) intervals postirradiation were used to evaluate temporal stability of response. These datasets were preregistered because the dosimeter was scanned in the same orientation during all measurements. The temporal measurements of postirradiation radiochromic response for a dosimeter were evaluated for linearity. Each data point in the 3D net distribution was fit to a linear regression model of y=m×t+C. Here, m (creep rate; units: ∕m∕h) and C (initial distribution; units: ∕m) are the parameters of the linear model; y (net distribution at any time t; units:∕m) is the dependent variable and t (time; units: h) is the independent variable. The percentage rate of change of radiochromic response (percent creep; units: %∕h) for all dose levels was obtained from the parameters of the linear model (m∕C) and was used to evaluate temporal stability. The percent creep is a measure of consistent aging of the radiochromic response at all dose levels.
Interdosimeter reproducibility of response
Interdosimeter reproducibility of response was evaluated by comparing dose measurements from four separate dosimeters that were irradiated with the same treatment plan but on different days. The highly modulated treatment plan provided an excellent model to evaluate interdosimeter reproducibility for multiple dose levels and multiple depths. Registered distributions from the four dosimeters were each normalized to convert to relative dose distribution. Dose profiles and gamma maps (2% dose difference and 2 mm DTA) between individual dose distributions were used to evaluate differences. The 2% dose difference and 2 mm DTA criteria were used because of highly modulated dose distribution and interdosimeter setup error. In addition, dose distributions from the four dosimeters were averaged and gamma (2% dose difference and 2 mm DTA) maps between the individual dose distributions and average distribution were obtained to estimate the extent of deviation about the mean.
Accuracy of dose measurement
Accuracy of measurement was evaluated by comparing PRESAGE dose with registered EBT dose. Since PRESAGE dose and EBT dose are independent relative dose measurements, their agreement would imply consistency of measurement and provide confidence that the PRESAGE dose measurement is likely accurate. Comparative dose profiles and gamma maps (2% dose difference and 2 mm DTA) were used for analysis. PRESAGE dose was also compared with ECLIPSE dose to highlight modeling inaccuracies. A relatively lenient 3% (dose difference), 3 mm (DTA) criteria was used for in this comparison.
RESULTS AND DISCUSSION
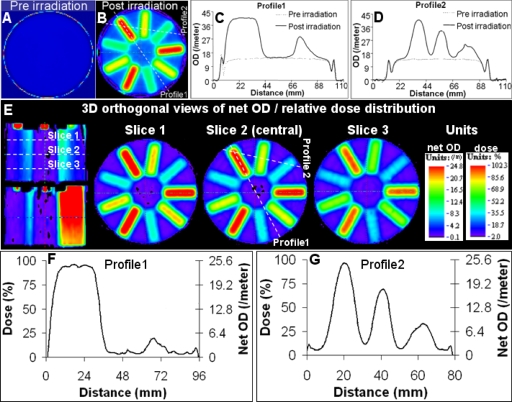
The use of improved optics and acquisition technique resulted in improvement in noise (reduced to ∼1%–2% root mean squared error) in reconstructions (Figs. 4567891011). The quality of the measured 3D data was comparable to the quality of film measurement and is the first presentation of such high quality data for the PRESAGE™∕OCTOPUS™ system. Slight edge artifact was evident in the pre- and postscans [Figs. 4a, 4b, 4c, 4d] but was minimized (3 mm) in the net distribution obtained by subtracting prescans from postscans [Figs. 4e, 4f, 4g]. The low noise and significantly reduced edge artifact in dose measurement was an important improvement whereby high precision dose measurement was possible even at low dose levels and near the edge. Evaluation of the robustness, reproducibility and accuracy characteristics of the PRESAGE dosimeter (presented henceforth) were facilitated because of this improvement.
Figure 4.
Reconstructed optical-CT data in one of the PRESAGE inserts. (a) An image of pre-irradiation scan of central slice. (b) An image of post-irradiation scan of central slice. (c) and (d) Profiles along dotted lines in (b). (e) 3D orthogonal views of relative dose distribution. (f) and (g) Profiles along dotted lines in (e) demonstrate reduced noise and edge artifact.
Figure 5.
Intradosimeter uniformity—2D evaluation. PRESAGE dose distribution was registered with the same distribution rotated by 120° and 240°. Such comparison was possible because of radially symmetric distribution. For all dose levels, close agreement of flat and penumbral profiles was observed [(b) and (c)]. Profiles are along dotted lines in (a), which is the dose distribution in the central slice.
Figure 6.
Intradosimeter uniformity—3D evaluation. Gamma distributions (2% difference, 1 mm DTA) for three slices are shown. ∼98% acceptance was observed with encouraging agreement even along the edge. Please see Fig. 4 for the position of slices.
Figure 7.
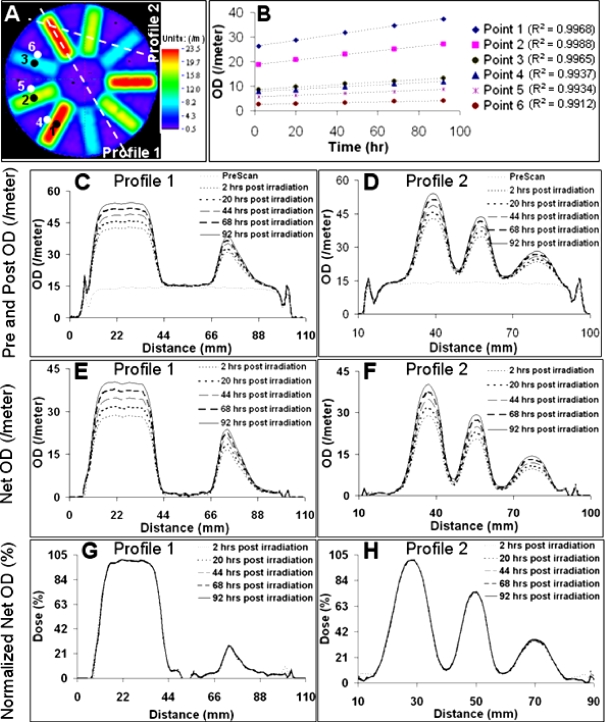
Temporal stability—2D evaluation. (a) Net distribution of central slice. (b) Change with time for six sample points shown in (a). (c) and (d) Postirradiation measurements vary with time. (e) and (f) Net measurements show commensurate temporal variation. (g) and (h) Normalized (dose) plots show close agreement indicating linearity of temporal variation (creep rate), and hence, temporal stability of relative dose measurement.
Figure 8.
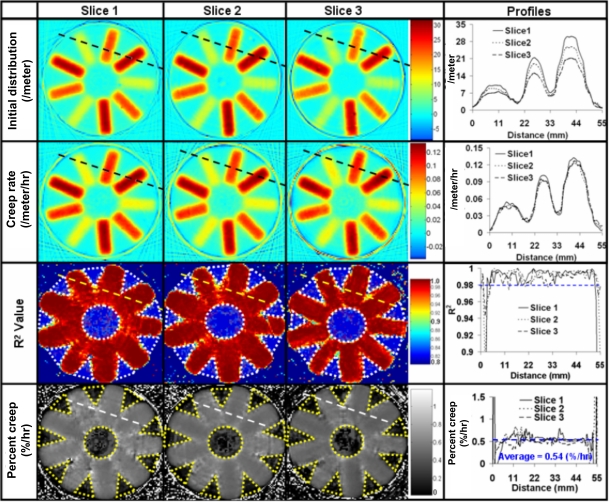
Temporal stability—3D evaluation. The parameters of the linear regression model (see Sec. 2E2), C (initial distribution) and m (creep rate) are shown for three slices (similar to Fig. 4) in the top two rows. The third row shows the R2 value of the linear fit for the three slices. The percent creep was uniform in the irradiated regions of the dosimeter and was estimated from the model to be 0.54%∕h (fourth row). In the third and fourth row, the dotted regions were excluded from analysis because of uncertainty in measurement of low dose (<6% dose).
Figure 9.
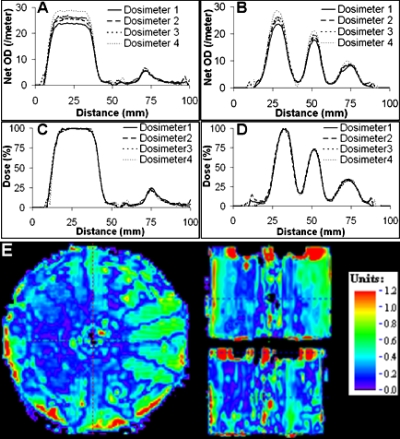
Interdosimeter reproducibility—Profiles and representative gamma map in central slice. Profiles are along dotted lines in Fig. 7a. (a) and (b) Net profiles from four different dosimeters irradiated with the same treatment plan. (c) and (d) Relative dose profiles showed close agreement. (e) Representative 3D gamma comparison map (2% dose difference and 2 mm distance-to-agreement) between dose readout from dosimeter 1 and dosimeter 4.
Figure 10.
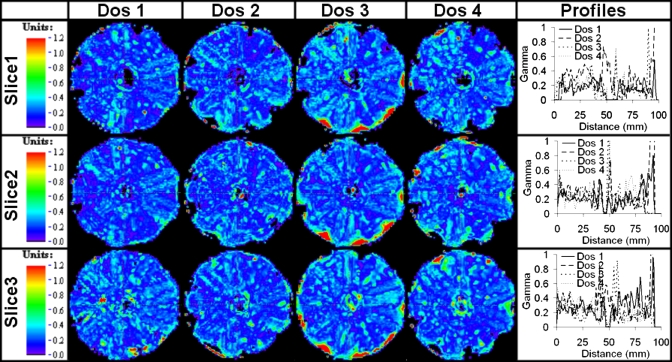
Inter dosimeter reproducibility—3D evaluation. The relative dose distributions from the four different dosimeter inserts (Dos 1-4) were averaged. Gamma comparison maps (2% dose difference, 2 mm distance-to-agreement) for each dosimeter insert against the average distribution of all 4. Maps for three slice positions are shown corresponding to the locations in Fig. 4.
Figure 11.
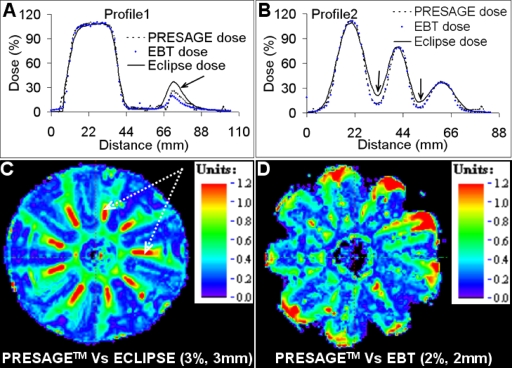
Accuracy and precision of PRESAGE dose measurement. (a) and (b) Dose profiles comparing PRESAGE dose, EBT dose, and ECLIPSE dose. (c) Gamma comparison image (3% dose difference, 3 mm distance to agreement criteria) between PRESAGE dose and ECLIPSE dose shows failure in penumbral regions (arrows). (d) Gamma comparison image between PRESAGE dose and EBT dose indicates excellent agreement in penumbral regions. A more stringent 2%-2 mm gamma criterion was used for this evaluation.
Intradosimeter uniformity of radiochromic response
Multiple regions within a single dosimeter should elicit identical radiochromic response when identical dose is delivered. The rotationally symmetric treatment plan and delivery (described in Sec. 2B) provided an excellent model to evaluate the intradosimeter consistency of response. The nature of the treatment plan implied that the 3D radiochromic response of the dosimeters should be identical if rotated by 120° and∕or 240° about the cylindrical axis. Results indicated that intradosimeter consistency of response of the dosimeters was excellent as shown in Figs. 56. The profiles in the central slice showed excellent agreement as seen in Fig. 5. Two types of profiles were examined. The flat profile and penumbral profiles were chosen for evaluation because any differences in measurement are most likely to show up in these profiles. The extent of noise in measurement was evident in the flat profiles whereas the penumbral profiles show the resolution of steep dose fall off for multiple dose levels. A 3D analysis of intradosimeter uniformity is presented in Fig. 6. Gamma comparative maps ascertained excellent intradosimeter uniformity throughout the dosimeter although only three slices are shown here for brevity. In general gamma maps showed >99% pass rate over the 3D volume if the outer 4 mm ring around the edge is ignored. Presence of imperfections (e.g., impurities) within the dosimeter led to disagreement at certain points and was accountable for the 1% failure in the central region. Collectively, the results showed that for all dose levels, the consistency of radiochromic response was within 2% difference, accounting for 1 mm setup error in 3D. Thus, for this PRESAGE™ formulation, the radiochromic response is consistent to within 2% for all dose levels and is independent of the spatial position within the dosimeter.
Temporal stability of radiochromic response
Previous work with the PRESAGE dosimeter has demonstrated temporal creep of radiochromic response.6 This is undesirable unless the creep is linear with respect to time for all dose levels. Temporal variation within one of the dosimeters for >90 h postirradiation is shown in Figs. 78. As discussed in methods, linear regression was applied to each data point in the 3D datasets radiochromic response obtained at different times. The parameters of the linear regression fit model (C and m) were obtained for each data point with corresponding R2 values. Figure 7 shows the characteristic temporal variation in the central slice using single point and profile representation. For this formulation, the net distribution changed (increased OD or attenuation) with respect to time for all dose levels. Figure 7b shows that, m (creep rate) was larger if C (initial distribution) was larger implying that higher the delivered dose, higher was the m and C and vice versa. Also, the creep rate was found to be linear (R2>0.99) for the sample dose levels. Figures 7c, 7d, 7e, 7f show the representation of temporal variation for two different profiles along dotted lines in Fig. 7a. Figures 7g, 7h show the same profiles when the distributions are normalized. The normalized (dose) profiles show close agreement because the percent creep was constant for all dose levels and is a demonstration of excellent temporal stability. The results in Fig. 7 were encouraging but limited to point and profile evaluations.
A comprehensive 3D evaluation is shown in Fig. 8 and is a 3D extension of Fig. 7. The top two rows of Fig. 8 show 2D maps of C and m, respectively, obtained at each point in the slice for three different slices. The third row shows the 2D maps of the R2 value for the same three slices. The R2 value is a measure of the reliability of the linear fit (R2=1 represents ideal case of perfect linear fit). For all dose levels, the R2 value was found to be >0.9 except in the regions encompassed by yellow dotted areas. This indicates an excellent statistical measure of the reliability of linear fit even in penumbral low dose regions. The R2 value was <0.9 for the exclusion region of the yellow dots because of very low dose (<6%) deposition whereby there was some uncertainty in dose measurement. Taken together, the top three rows of Fig. 8 show that the temporal creep was linear and predictable for dose levels >6% in 3D. This implies that the percent creep should be consistent throughout the dosimeter. The fourth row shows 2D maps of the percent creep for the same three slices. Except for the exclusion region defined above, the percent creep was found to be consistent (0.54% per hour) throughout and demonstrates excellent temporal stability of radiochromic response for >90 h postirradiation in 3D. This is ideal for the RPC IMRT credentialing application because the relative dose distribution is expected to be invariant over the duration of shipping and analysis.
Interdosimeter reproducibility of response
Interdosimeter reproducibility of response was evaluated by irradiating four different dosimeters with an identical treatment plan but on different days and comparing the measurements. Results indicated that interdosimeter reproducibility of the radiochromic response was excellent as shown in Figs. 910. Although the radiochromic responses were different for different dosimeters [Figs. 9a, 9b], the normalized (dose) distributions were very close [Figs. 9c, 9d] indicating high reproducibility of relative dose measurement. The maximum difference in absolute measurements was ∼15% and could be attributed to slight differences in formulation and irradiation on different days because of which the temperature response might differ. A representative gamma comparison map (2% difference and 2 mm DTA acceptance criteria) between relative dose distributions from two dosimeters (dosimeter 1 and dosimeter 4 in Fig. 9) shows interdosimeter reproducibility in 3D. These dose distributions were chosen for gamma analysis because the absolute distributions showed maximum difference. Some points near the edge and within the dosimeter failed the acceptance criteria but these are exceptions to the otherwise excellent pass rate of ∼98% in 3D. The pass rate calculations excluded the outer 4 mm ring near the edge. Detailed 3D analysis of interdosimeter reproducibility between all four dosimeters is presented in Fig. 10, which shows the gamma comparison maps between individual relative dose distributions and the average relative dose distribution over three slices. This evaluation is a measure of the standard error between different measurements about the mean. The gamma pass rate was ∼98% following the constraints mentioned above. Majority of failure was near the edge or could be attributed to physical imperfections within the dosimeters. Collectively, the results indicated that the error in reproducibility of relative dose measurement between different dosimeters was within 2% dose difference if a 2 mm allowance is made for setup error and an exclusion region of 4 mm conduit along the edge.
Precision and accuracy of relative dose measurement
The intradosimeter consistency, temporal stability, and interdosimeter reproducibility of radiochromic response coupled with the excellent noise characteristics are a measure of precision of measurement which was generally within 2%. The accuracy of PRESAGE dose measurement was primarily evaluated by comparison with an independent measurement using EBT film in a single central plane. The PRESAGE dose measurement was also compared with ECLIPSE dose calculations to highlight errors in penumbral modeling. The results are shown in Fig. 11 and indicated that PRESAGE measurement agreed better with independent EBT measurement than with ECLIPSE calculations. This was particularly true in penumbral regions (shown by arrows) and is attributed to the dosimetric blurring in ECLIPSE calculations particularly in high dose-gradient regions.5 The 3%-3 mm gamma criteria was chosen for the PRESAGE versus ECLIPSE gamma evaluation to highlight the regions where ECLIPSE modeling is inaccurate. A more stringent 2%-2 mm criteria applied to the gamma comparison between PRESAGE dose and EBT dose, resulted in a pass percentage of >98% if an allowance is made for the outer 5 mm ring around the edge where edge artifacts might be predominant for both PRESAGE and EBT measurements. If a 3%-3 mm criteria is applied to PRESAGE dose and EBT dose comparison, the pass rate is >99% even without the edge artifact allowance, which demonstrates reduction of edge artifact in PRESAGE dose measurement. Collectively, these results indicated that the accuracy of PRESAGE dose measurement was ∼2%, allowing for 2 mm setup error.
CONCLUSION
This study presents the first rigorous investigations into the robustness, reproducibility, precision, and accuracy of 3D PRESAGE inserts compatible with the RPC H&N IMRT credentialing phantom. A highly modulated treatment plan was created to test these properties at multiple dose levels and depths. Improvements in optics and acquisition technique produced very high quality (noise ∼2%) 3D data using the PRESAGE™∕OCTOPUS™ dosimetry system even at low dose levels. Results indicated that the PRESAGE inserts were extremely robust for relative 3D dosimetry as indicated by excellent intradosimeter consistency (within 2%) of radiochromic response and stability of relative dose distribution for >90 h postirradiation. Reproducibility of response for different 3D inserts was found to be highly consistent (within 2%) at all dose levels. Accuracy of relative dose measurement was evaluated by comparison with independent EBT film measurement and was within 2% even along the penumbra and at low dose levels. The excellent quality of 3D dose measurement that was achieved with the PRESAGE™∕OCTOPUS™ dosimetry system (comparable to EBT film) supports its viability as a clinical 3D dosimetry tool. Further tests are needed to test robustness to shipping before a final verdict on potential integration with the RPC H&N IMRT credentialing phantom.
ACKNOWLEDGMENT
This work was supported through NIH Grant No. RO1 CA 100835.
References
- Ibbott G. S., Molineu A., and Followill D. S., “Independent evaluations of IMRT through the use of an anthropomorphic phantom,” Technol. Cancer Res. Treat. 5, 481–487 (2006). [DOI] [PubMed] [Google Scholar]
- Ibbott G. S., Followill D. S., Molineu H. A., Lowenstein J. R., Alvarez P. E., and Roll J. E., “Challenges in credentialing institutions and participants in advanced technology multi-institutional clinical trials,” Int. J. Radiat. Oncol., Biol., Phys. 71, S71–75 (2008). [DOI] [PMC free article] [PubMed] [Google Scholar]
- Adamovics J. and Maryanski M., “New 3D radiochromic solid polymer dosimeter from leuco dyes and a transparent polymeric matrix,” Med. Phys. 10.1118/1.1521940 30, 1 (2003). [DOI] [PubMed] [Google Scholar]
- McJury M. et al. , “Radiation dosimetry using polymer gels: Methods and applications,” Br. J. Radiol. 73, 919–929 (2000). [DOI] [PubMed] [Google Scholar]
- Guo P., Adamovics J., and Oldham M. A., “Practical three-dimensional dosimetry system for radiation therapy,” Med. Phys. 10.1118/1.2349686 33, 3962–3972 (2006). [DOI] [PMC free article] [PubMed] [Google Scholar]
- Guo P. Y., Adamovics J. A., and Oldham M., “Characterization of a new radiochromic three-dimensional dosimeter,” Med. Phys. 10.1118/1.2192888 33, 1338–1345 (2006). [DOI] [PMC free article] [PubMed] [Google Scholar]
- Oldham M., Sakhalkar H., Guo P., and Adamovics J., “An investigation of the accuracy of an IMRT dose distribution using two- and three-dimensional dosimetry techniques,” Med. Phys. 10.1118/1.2899995 35, 2072–2080 (2008). [DOI] [PMC free article] [PubMed] [Google Scholar]
- Oldham M., Guo P., Gluckman G., and Adamovics J., “IMRT verification using a radiochromic∕optical-CT dosimetry system,” J. Phys. (Moscow) 56, 221–224 (2006). [DOI] [PMC free article] [PubMed] [Google Scholar]
- Guo P., Adamovics J., and Oldham M., “Quality assurance in 3D dosimetry by optical-CT,” J. Phys. (Moscow) 56, 191–194 (2006). [DOI] [PMC free article] [PubMed] [Google Scholar]
- Adamovics J., Dietrich J., and Jordan K., “Enhanced performance of PRESAGE—Sensitivity, and post-irradiation stability,” Med. Phys. 10.1118/1.1830041 32, 1 (2005).15719946 [DOI] [Google Scholar]
- Adamovics J. and Maryanski M., “OCT scanning properties of PRESAGE—A 3D radiochromic solid polymer dosimeter,” Med. Phys. 10.1118/1.1630968 31, 1 (2004).14761013 [DOI] [Google Scholar]
- Adamovics J. and Maryanski M. J., “Characterisation of PRESAGE: A new 3-D radiochromic solid polymer dosemeter for ionising radiation,” Radiat. Prot. Dosim. 10.1093/rpd/nci555 120, 107–112 (2006). [DOI] [PubMed] [Google Scholar]
- Schulz R. J., Maryanski M. J., Ibbott G. S., and Bond J. E., “Assessment of the accuracy of stereotactic radiosurgery using Fricke-infused gels and MRI,” Med. Phys. 10.1118/1.597126 20, 1731–1734 (1993). [DOI] [PubMed] [Google Scholar]
- Xu Y., Wuu C. S., and Maryanski M. J., “Performance of a commercial optical CT scanner and polymer gel dosimeters for 3-D dose verification,” Med. Phys. 10.1118/1.1803674 31, 3024–3033 (2004). [DOI] [PubMed] [Google Scholar]
- Devic S. et al. , “Precise radiochromic film dosimetry using a flat-bed document scanner,” Med. Phys. 10.1118/1.1929253 32, 2245–2253 (2005). [DOI] [PubMed] [Google Scholar]
- Low D. A. and Dempsey J. F., “Evaluation of the gamma dose distribution comparison method,” Med. Phys. 10.1118/1.1598711 30, 2455–2464 (2003). [DOI] [PubMed] [Google Scholar]
- Low D. A., Harms W. B., Mutic S., and Purdy J. A., “A technique for the quantitative evaluation of dose distributions,” Med. Phys. 10.1118/1.598248 25, 656–661 (1998). [DOI] [PubMed] [Google Scholar]
- www.3cognition.com.


